

Justin Sullivan
Introduction
As Ford Motor Company (NYSE:F) has moved into being more of a truck-only vehicle manufacturer, this has proven to be a success story for the company. However, as the automotive industry can be cutthroat, it is no wonder the future stock price of Ford may not be a star performer. Ford does provide some consistent profit in its stock price, but it is worth considering a lower quantity of stock to hold.
Fundamentals Have Been Flat
Ratios
Ford’s current ratio and quick ratio have been relatively flat and even in decline since 2017. As a result, Ford needs to be more innovative to impact its organic growth.
|
Metric |
2017 |
2018 |
2019 |
2020 |
2021 |
|
Period |
FY |
FY |
FY |
FY |
FY |
|
Current ratio |
1.225 |
1.200 |
1.162 |
1.201 |
1.201 |
|
Quick ratio |
1.075 |
1.041 |
0.994 |
1.053 |
1.031 |
|
Cash ratio |
0.195 |
0.175 |
0.178 |
0.260 |
0.226 |
Source: Financial Modelling Prep
Growth
As stated earlier, revenue and gross profit growth have not been favorable for 2019 and 2020. Unfortunately, 2021 was not a strong-enough year to show any recovery from these negative periods.
|
Metric |
2017 |
2018 |
2019 |
2020 |
2021 |
|
Period |
FY |
FY |
FY |
FY |
FY |
|
Revenue growth |
0.033 |
0.023 |
-0.028 |
-0.184 |
0.072 |
|
Gross profit growth |
0.009 |
-0.054 |
-0.119 |
-0.321 |
0.507 |
|
Ebit growth |
0.069 |
-0.090 |
-0.955 |
-8.679 |
2.026 |
|
Operating income growth |
0.069 |
-0.090 |
-0.955 |
-8.679 |
2.026 |
|
Net income growth |
0.654 |
-0.516 |
-0.987 |
-28.213 |
15.024 |
|
Eps growth |
0.647 |
-0.513 |
-0.989 |
-33 |
15.031 |
Source: Financial Modelling Prep
Data
Consider that 2022 has been the most decisive year for Ford over the last five years. Many companies have shown negative returns for both simple moving average periods of 50 days and 200 days. Compared to other companies, which have shown much steeper negatives, this could be a year of a potential turnaround for Ford Motor Company.
|
Metric |
Values |
|
SMA20 |
9.12% |
|
SMA50 |
8.42% |
|
SMA200 |
-1.77% |
Source: FinViz
Enterprise
As Ford has had flat revenue and profit growth, the stock price shows otherwise, with a solid return for the last year. Also, market capitalization has almost doubled from 2020 to 2021.
|
Metric |
2017 |
2018 |
2019 |
2020 |
2021 |
|
Symbol |
F |
F |
F |
F |
F |
|
Stock price |
11.060 |
8.710 |
8.840 |
10.530 |
19.540 |
|
Number of shares |
3.980 B |
3.954 B |
3.972 B |
3.973 B |
3.991 B |
|
Market capitalization |
44.020 B |
34.437 B |
35.112 B |
41.836 B |
77.984 B |
Source: Financial Modelling Prep
Estimate
If 2021 proved to be a much stronger year than prior years, 2022 has been a relatively more robust year than other large blue-chip companies can say. The critical factor will be if Ford Motor Company’s forward guidance will sustain this momentum. Looking at 2023 and beyond, the forecasted revenue could be more substantial but should still be considered a winner for long-term holders. In addition, the EBITDA could be more convincing, which is decent enough to show some performance over the next few years. I recommend that investors look for stronger performers, as the car market may be super-sensitive if an upcoming recession turns into a long-term economic downturn.
|
YEARLY ESTIMATES |
2022 |
2023 |
2024 |
2025 |
2026 |
|
Revenue |
155,862 |
161,408 |
166,093 |
170,845 |
– |
|
Dividend |
– |
– |
0.58 |
0.60 |
0.60 |
|
Dividend Yield (in %) |
3.77 % |
4.39 % |
4.02 % |
4.15 % |
4.15 % |
|
EPS |
1.98 |
1.76 |
1.82 |
1.87 |
1.30 |
|
P/E Rati |
7.29 |
8.22 |
7.96 |
7.75 |
11.12 |
|
EBIT |
11,315 |
10,383 |
10,714 |
10,857 |
8,085 |
|
EBITDA |
15,728 |
15,395 |
16,871 |
16,373 |
– |
|
Net Profit |
7,944 |
7,271 |
7,592 |
7,586 |
5,293 |
Source: Business Insider.
Does Technical Analysis Show It is Time to Order Ford Stock?
Fibonacci
As one can see with the red trendline, Ford has roughly another 50% move to full recover from its stock price historical high from last year. So, it is conceivable there will be growth in the stock price of Ford, but do not expect high momentum growth.
fibonacci f (custom platform)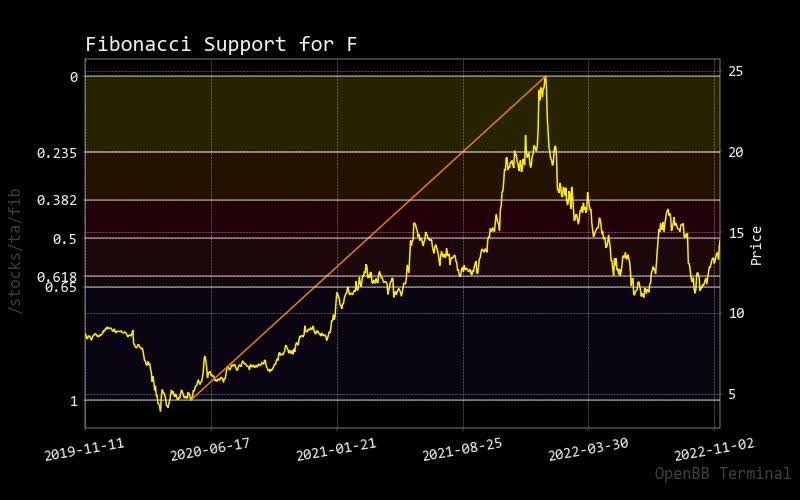
Bollinger Bonds
It could be a positive indicator of how Ford’s stock price continues to breach Bollinger’s upper band potentially. However, I would not consider this strong outperformance relative to significant stock indices or automaker competition.
f bollinger bands (custom platform)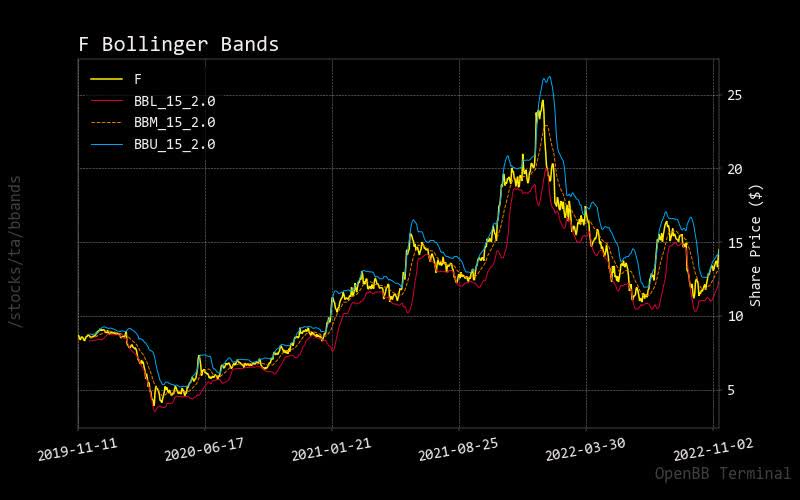
MACD
As said, there are some encouraging signs of how Ford has managed its negative downside. It is also encouraging to know that market entry potential exists, as the stock price has broken through the zero line of the lower panel in this chart.
f macd (custom platform)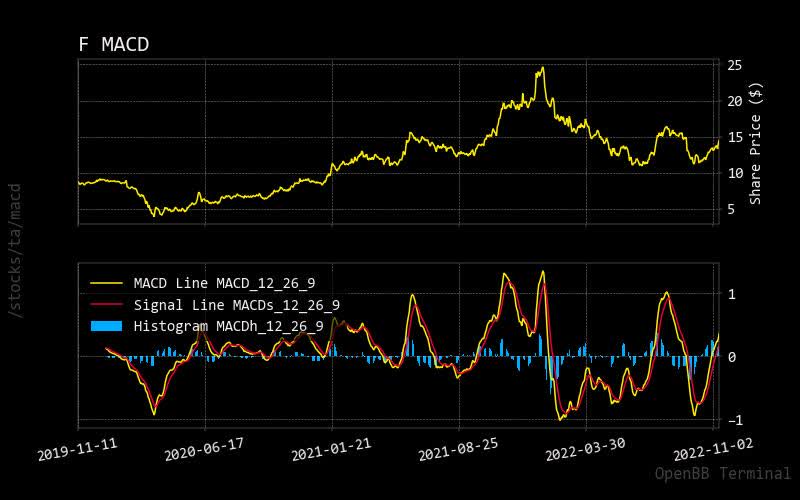
RSI
One does need to worry when one sees a stock price cross above the upper overbought relative strength indicator condition. Historically you need to compare to previous events of this to see if there is a possible pullback on the stock price. Based on Ford’s flat growth fundamental history, there might not be much impact negatively on the stock price. However, there is a need for price velocity to slow down to maintain momentum.
f rsi (custom platform)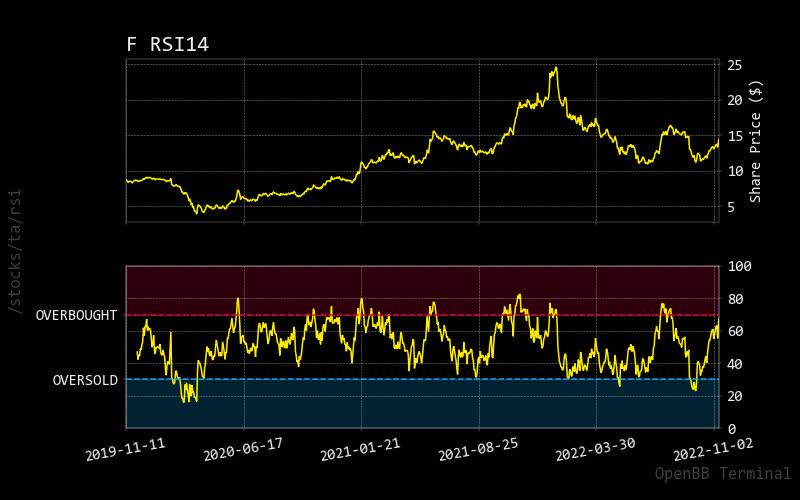
Prediction via Artificial Intelligence
Monte Carlo
Monte Carlo simulations always show the relative strength of expected stock price comparing many forecasted predicted paths. In this case for Ford, there is quite a high magnitude of stock price expectation to recover its historical peak over the short term.
The same could be said for normalized distribution, as there seem to be higher odds of stock price rising in the coming weeks. It can add to the narrative of potential stock price upswings.
monte carlo f (custom platform)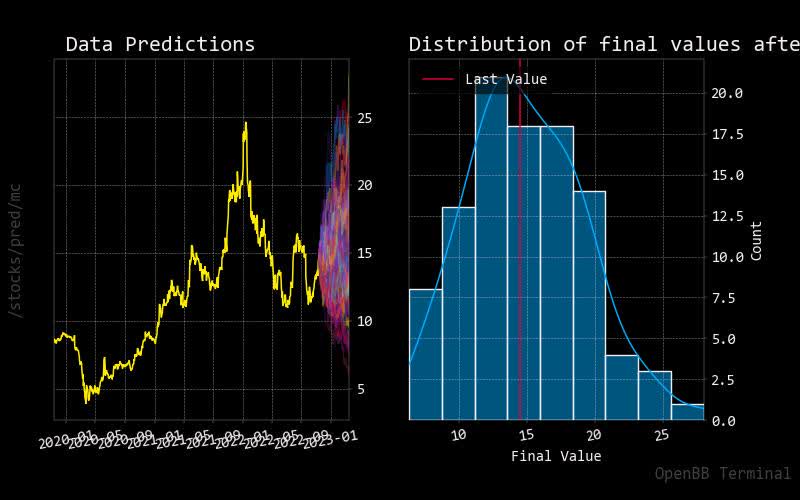
Regression
As shown in this 30-day red regression line forecasted based on historical price action, Ford will likely have a suppressed stock price increase which seems more realistic based on flatter fundamentals.
regression f (custom platform)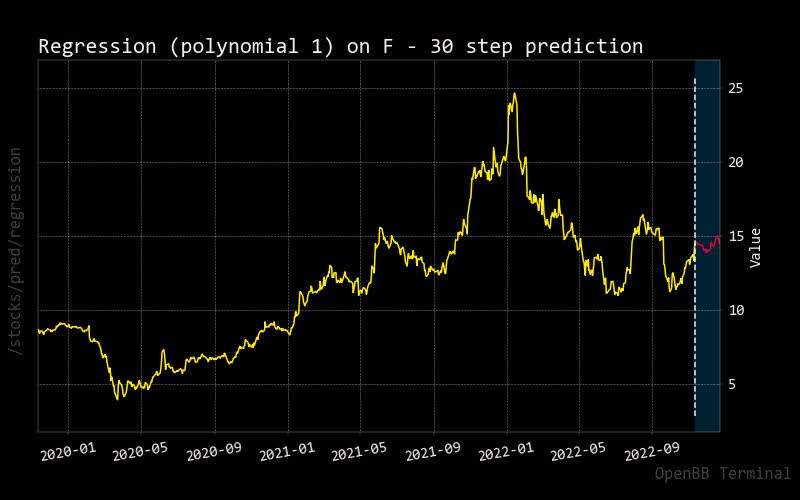
Risks Indicate Not Optimal Time for Ford Market Entries
Price vs. Short Volume
One solid, encouraging sign for Ford is how the stock price goes up while trading volume on the shorting side drops. As a result, investors can raise their confidence in future car models to be released or more robust market conditions.
shorting f (custom platform)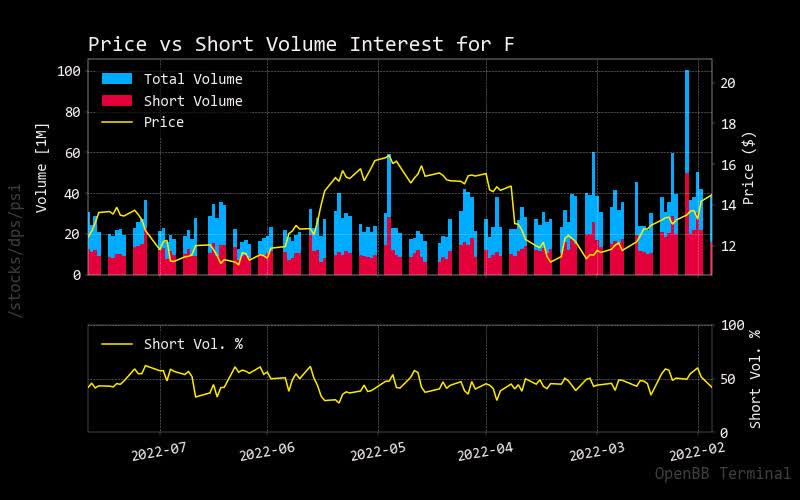
Source: StockGrid.
Sustainability
Considering Ford is an automotive manufacturer that negatively impacts the environment, you would expect Ford to have an outperforming rating. But instead, they are only set at average, meaning there is work to do to become more environmentally friendly.
|
Metric |
Value |
|
Social score |
11.34 |
|
Peer count |
37 |
|
Governance score |
9.35 |
|
Total esg |
29.95 |
|
Highest controversy |
3 |
|
ESG performance |
AVG_PERF |
|
Percentile |
63.41 |
|
Peer group |
Automobiles |
|
Small arms |
False |
|
Environment score |
9.27 |
Source: Yahoo Finance.
Price Targets
Market analysts were setting high, unrealistic targets that Ford could not meet with its stock price. Does this mean that Ford promised strong guidance?
f target (custom platform)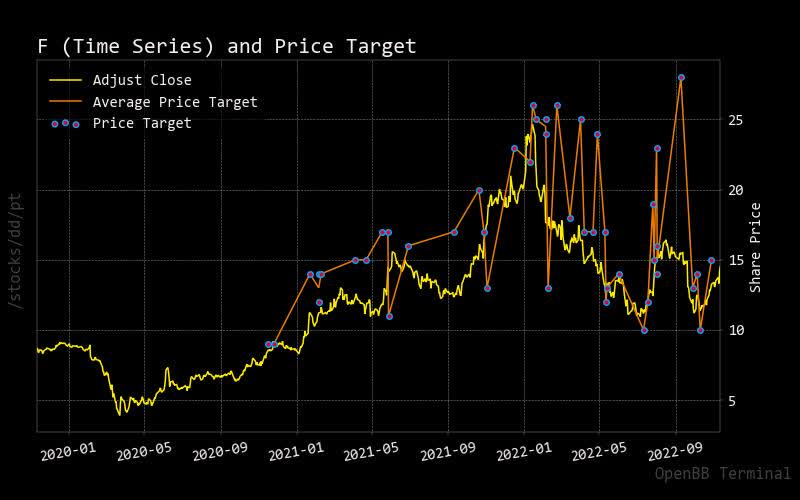
Source: Business Insider.
Recommendation
Looking at what other market analysts believe, with sell ratings over the last month, I would agree with Ford being more of a hold for now, but eventually watch to see if you want to add exposure of Ford to your portfolio.
|
Interval |
RECOMMENDATION |
BUY |
SELL |
NEUTRAL |
|
One month |
SELL |
1 |
15 |
10 |
|
One week |
SELL |
2 |
14 |
10 |
|
One day |
NEUTRAL |
7 |
10 |
9 |
Source: Trading View.
Conclusion
As shown for Ford’s stock price, forward guidance estimates seem strong but could be a concern if recessionary conditions come to fruition. Based on current market technical indicator conditions and higher predicted stock prices using artificial intelligence, we have confidence that Ford Motor Company, at some point, will become a turnaround story. The stock price might become more reasonable as compared to higher-performing stock prices. I recommend a hold status on Ford stock to be placed on a watch list for this to turn around.
Be the first to comment