

There are lovers and there are haters of Ford. Acronyms abound. Feel free to elect your personal favorite. Since I was a kid I’ve heard many. Fix Or Repair Daily. Found On Road Dead. Fast On Race Day. Fast Only Rolling Downhill. And there are more with a few choice words, but since this is a family show, we’ll leave those out for now.
In this case, we’re choosing “Go, Baby, Go” as an homage to the 1967 Mustang Shelby GT500 driven in “Gone In 60 Seconds”. Love it or hate it, that car could really move. Of course, it was the movies, but who doesn’t love the “Go, Baby, Go” button igniting the nitrous and vaulting the car into insane mode.
The setup we’re currently tracking may indeed take (NYSE:F) to new all-time highs. Let’s take a look at the details. Now, as we do so, I ask you to approach this with an open mind; not to deceive you. And certainly not to proffer an unproven concept.
While there are many other methods of analysis for tracking stocks and the markets, we use Elliott Wave theory. This is a topic that can produce scorn and ridicule. A wise person once said, “We mock what we do not understand.” If you enjoy slapstick and silly movies, you may think this is a reference to “Spies Like Us.” But, alas, it is not…
The entire quote is actually attributed to author Sarah Gerdes and goes something like this: “We mock that which we don’t understand, and then we get to experience it ourselves.” We know many that began by making fun of Elliott Wave. And then, in time, they experience it for themselves.
Whether we want to admit it or not, Elliott Wave theory is actually all around us. Put quite simply, in the financial markets, Elliott Wave theory is the manifestation of human behavior on a mass scale. You certainly don’t have to believe me. Feel free to continue with your current belief system. If it is working for you, then I’m content for you.
If you’re open to learning new ideas and concepts then let’s discuss a few questions and see where that takes us to. Which is more important in financial markets? Fundamentals or sentiment? There are those that only base their decisions on fundamental analysis. In fact, I was around that environment for years. I even met with and discussed at length the financials of large publicly-traded companies with professional analysts that had pored over the various statements and releases available to them.
One issue continually popped up. Markets seems to bottom on the worst fundamental news and top on the most positive. As well, there were many stocks that seemed to trade far outside normal metrics of fundamental analysis. What’s more, markets would often do the exact opposite of what the news of the day indicated should have happened.
Is there an analysis method that can reliably track and then project what is most likely to happen in markets? Yes. Consider Elliott Wave theory. But it’s necessary to overlay something else onto that theory. Lest the practicer of Elliott Wave be swayed by their own leanings, we use what we affectionately call Fibonacci Pinball.
This overlay on top of Elliott Wave theory tells us when to shift our scenario or even when to completely disregard the scenario as nullified. We have published many articles here discussing the finer points of Elliott Wave theory and Fibonacci Pinball. To maintain ourselves on theme here with (F) let’s discuss more what we specifically see as most probable in the near term.

Ford Daily Chart (TradingView)
From the 2020 lows (F) has completed 5 waves up. This tells us that a new uptrend at a larger degree has taken hold. We’re now awaiting the finish to the current corrective pattern which is projected to have three waves, (A)-(B)-(C). And, the (C) wave should consist of five waves itself. I want you to go back and re-read the start of this paragraph. EW works by degrees, it is fractal in nature. We look for specific patterns to establish a larger trend and then look for confirmation in the subwaves. The smaller the degree the more potential for variability in the pattern but the larger degree context will guide us.
If we zoom into the one-hour interval time frame, note that our support area is in the $12 – $13 range. There are two likely paths we are tracking, Blue and Red, as you can see.
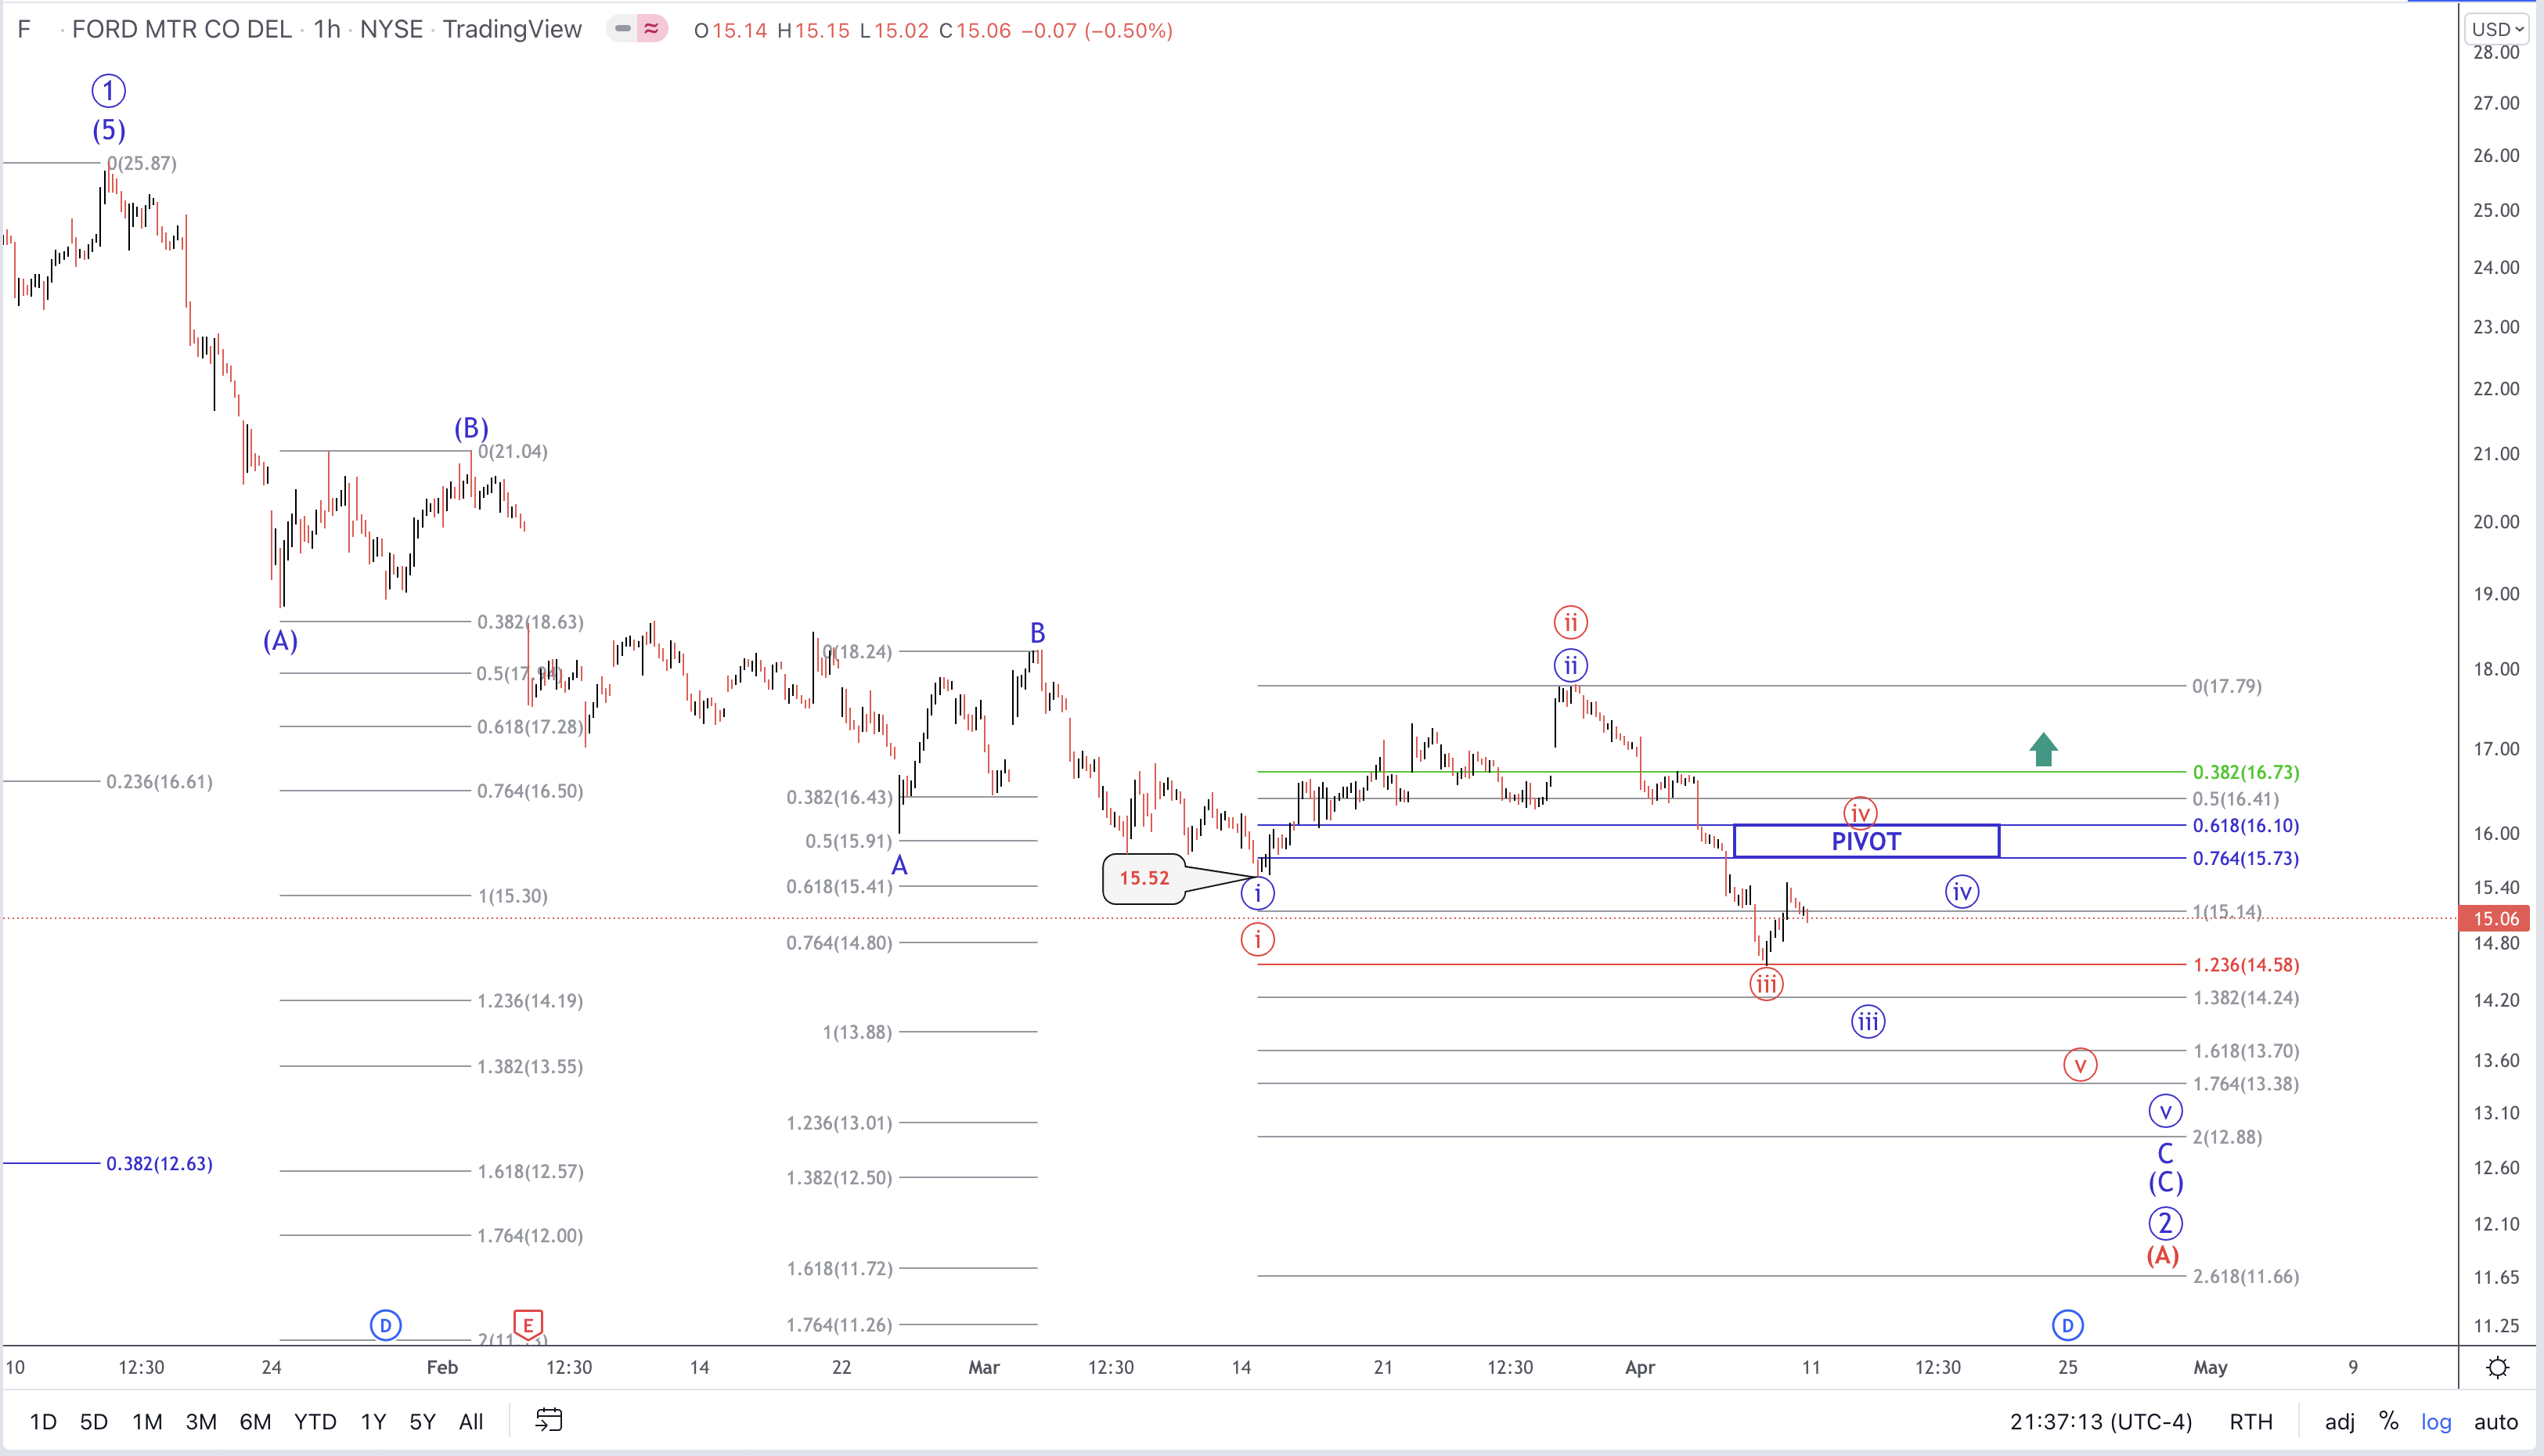
Ford Hourly chart (TradingView)
From this point, the conclusion is fairly straightforward. If we’re following the Blue path then without a further bounce up, (F) would proceed rather directly to the high $13’s in wave circle ‘iii’. The blue circle ‘iv’ to $15 or so and then one final low in circle ‘v’ in the $12 – $13 range.
There’s also the Red path possibility. We would know Red should actually be our primary expectation if we see a larger bounce here in the next few days that rises as high as the $16’s. For as long as this does not exceed the $16.73 area, we would anticipate one more low in the $13 area.
Where might these expectations be incorrect? Should (F) take out the prior high at $17.79 then it would become more likely that an important low has already been struck at $14.56. As well, if this were to proceed directly under the $12 area then we would also stand aside and await further clarity.
Once (F) sees its corrective low then we will also track two main possibly trajectories. Both suggest much higher than the $12 – $13 level whether it is the Red (B) wave path or the Blue wave 1. We will differentiate between the two by the structure of price. 3 wave up will suggest Red; 5 waves up says Blue.
This is not an attempt to put forth so many scenarios that one of them must come true and we proclaim victory, vigorously patting ourselves on the back. Please recognize that markets and the stocks of which they are comprised are non-linear, fluid and dynamic in nature. We adapt in real time to what we’re given. As well, analysis will evolve and become even more clear as data fills in the chart. There will come a moment where the analyst can apparently even complete the sentence for the stock or market they observe.
One way of comparing our analysis is to that of a head coach of a football team and the staff that compose a game plan for their upcoming opponent. Many coaches even have 15 pre-scripted plays that they run at the beginning to see what the reaction of the opposing coach will be. As well, the game plan of each coach usually has provisos and possible adaptations given certain scenarios that can come up during the actual game.
The football coach must adapt to what’s given during the real game. It simply is not possible to stubbornly stick to one specific path when the facts in front of you change. We do the same in our analysis. There’s a likely path in the bigger picture. This is similar to it being likely that the superior team will come out victorious in any competition. We have our most likely scenario that we follow, but we also have an alternative to consider.
Being able to quickly adapt to changing landscapes is one of the hallmarks of Elliott Wave analysis, when correctly applied.
I would like to take this opportunity to remind you that we provide our perspective by ranking probabilistic market movements based upon the structure of the market price action. And, if we maintain a certain primary perspective as to how the market will move next, and the market breaks that pattern, it clearly tells us that we were wrong in our initial assessment. But here’s the most important part of the analysis: We also provide you with an alternative perspective at the same time we provide you with our primary expectation, and let you know when to adopt that alternative perspective before it happens.
There are many ways to analyze and track stocks and the market they form. Some are more consistent than others. For us, this method has proved the most reliable and keeps on us the right side of the trade much more often than not. Nothing is perfect in this world, but for those looking to open their eyes to a new universe of trading and investing, why not consider studying this further? It may just be one of the most illuminating projects you undertake.

Dean Mouhtaropoulos/Getty Images Sport
Be the first to comment