

J2R/iStock Editorial via Getty Images
In this article, we will be focusing on the determination of Foot Locker’s (NYSE:FL) fair value using the Gordon growth model. Then, we will also establish what forward price-to-earnings ratio could be justifiable for the stock.
The Gordon growth model
The Gordon growth model is a simple and well-recognized dividend discount model often used to value the equity of dividend paying companies. The main assumption of this model is that the dividend grows indefinitely at a constant rate. Due to this criterion, the growth model is particularly appropriate for firms that are:
1.) Paying dividends
2.) In the mature growth phase
3.) Relatively insensitive to the business cycle
A strong track record of steadily increasing dividend payments at a stable growth rate could also serve as a practical criterion if the trend is expected to continue in the future.
Although FL is not considered to be insensitive to the business cycle, due to its continuous dividend payments and steady dividend growth rates, we believe that the Gordon growth model is an appropriate valuation method for the firm.
The Gordon growth model is described by the following formula:
Gordon growth model (Wallstreetprep.com)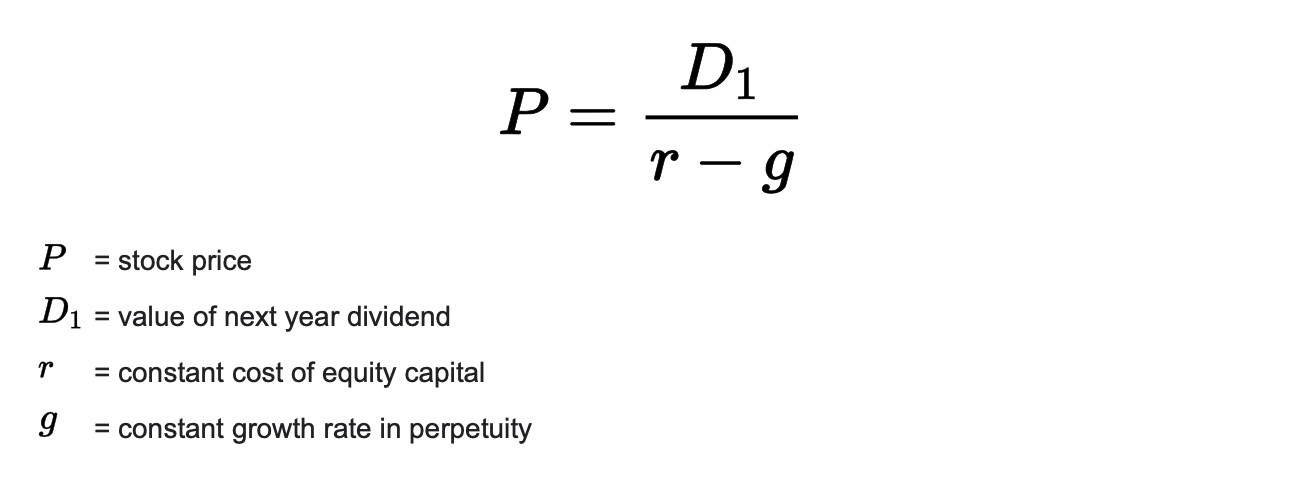
In order to make a meaningful evaluation of the fair value of the stock, we have to make several assumptions:
1.) What is our required rate of return?
We decided to use Foot Locker’s weighted-average cost of capital (WACC) for our required rate of return. The current WACC of the firm is 9.0%.
2.) What could be a reasonable constant dividend growth rate in perpetuity?
To answer this question, we have to take a look at FL’s dividend payment history and try to establish a reasonable long term trend.
The following chart depicts the firm’s dividend history.
Dividend history (seekingalpha.com)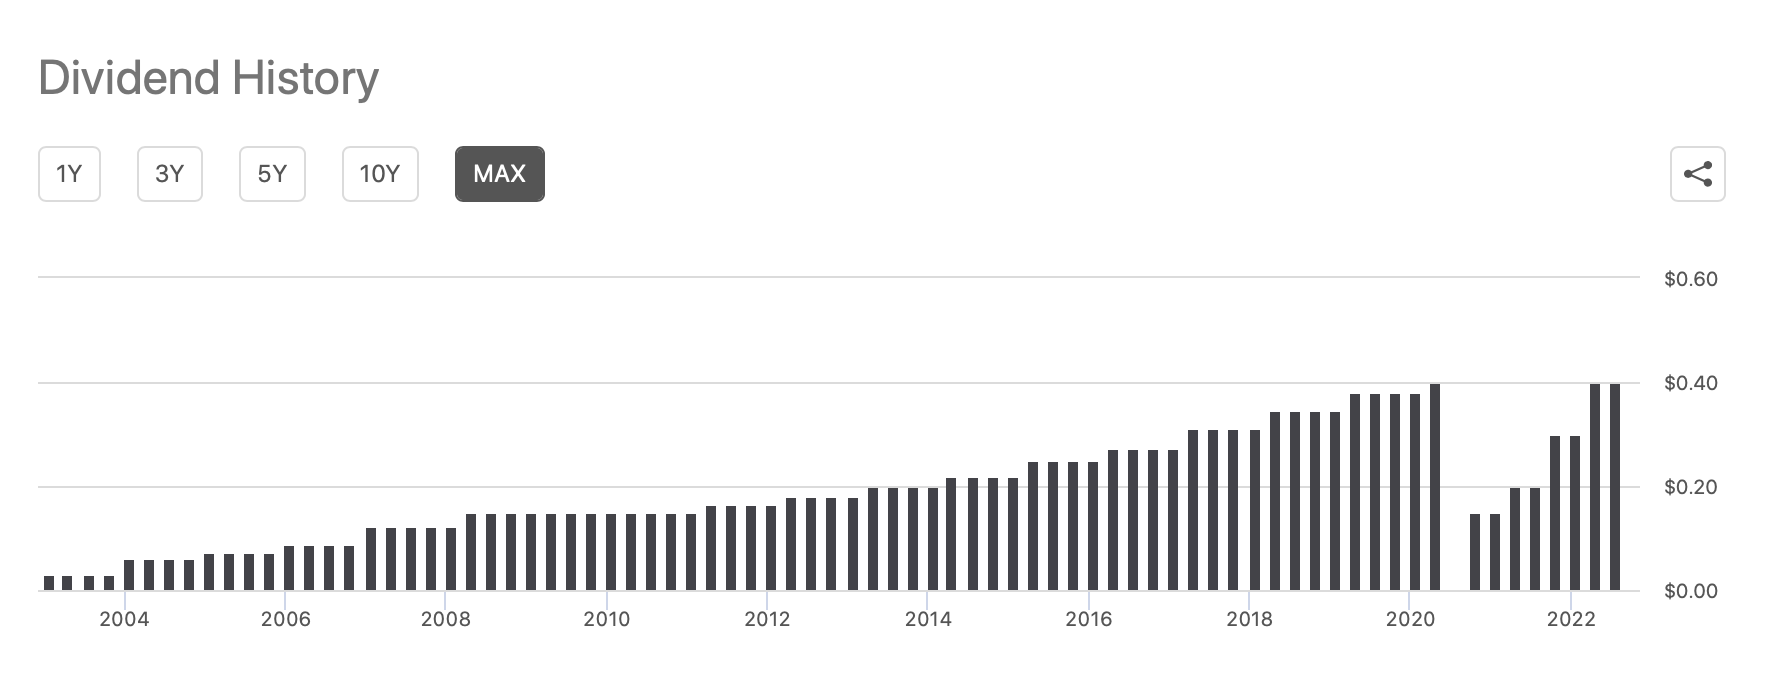
The firm has a relatively strong track record of paying dividends, as they have been returning value to their shareholders in this form since 2003. Due to the dividend cut in 2020, and its rapid increase 2021 and 2022, we believe this period is not a representative time period for our forecasting purposes.
In order to account for any uncertainty, we will take a look at several growth rate assumptions and try to come up with a reasonable range of fair values using historic averages.
Dividend growth rate (seekingalpha.com)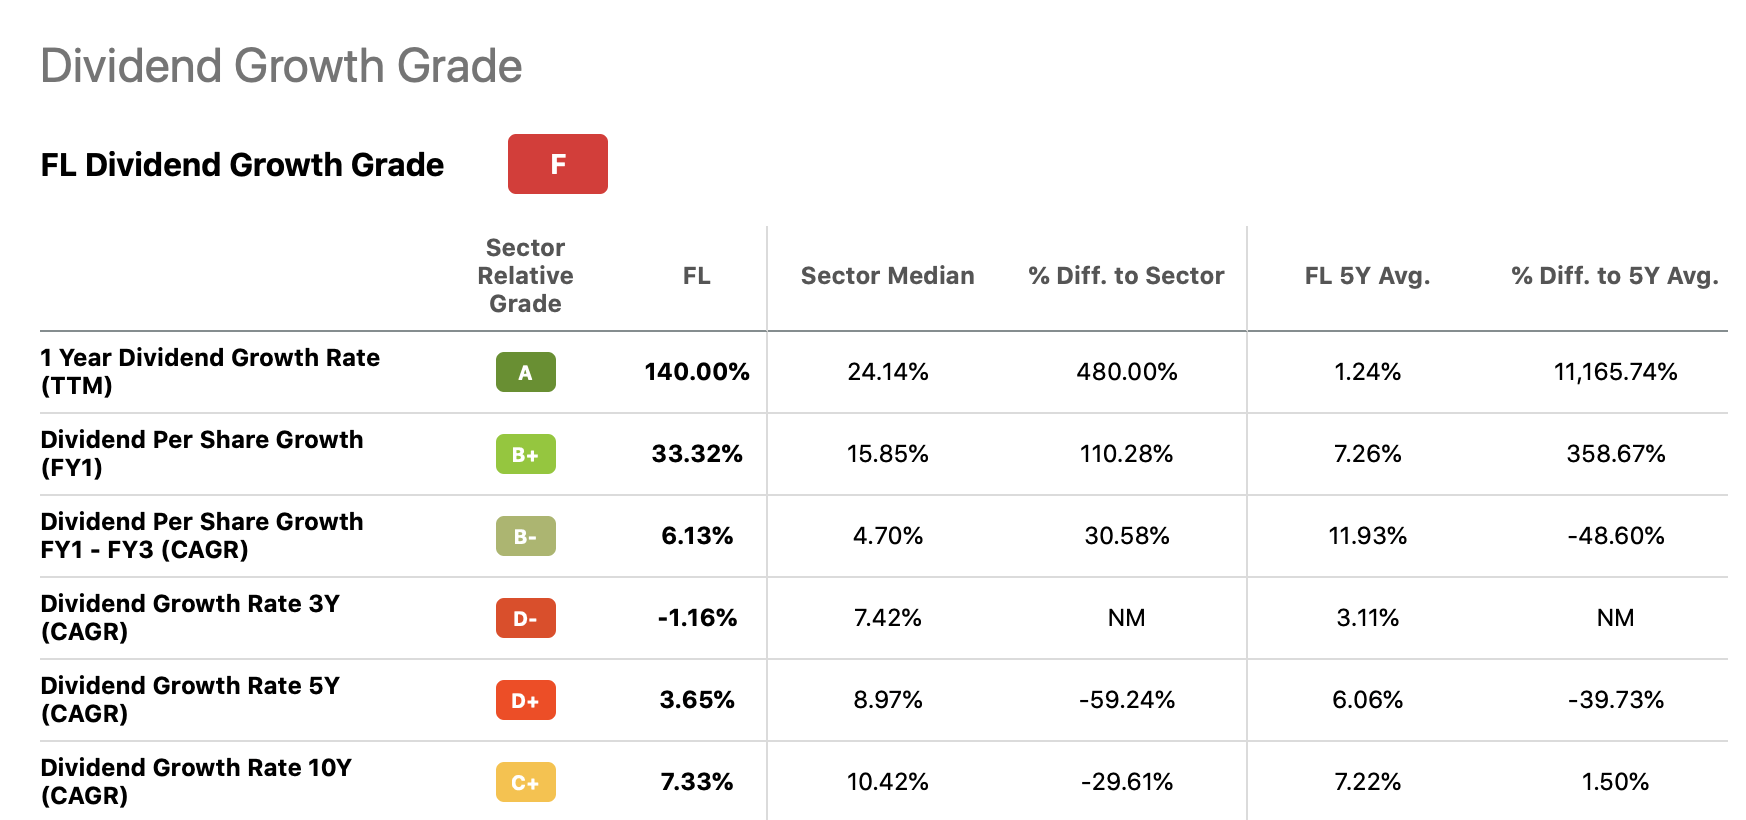
Based on historical dividend growth rates, a range of 3.5% to 7.5% appears to be an appropriate choice.
The following table shows the results of our fair value calculation using a 9% required rate of return and the above defined range of constant sustainable dividend growth rate.
Fair value (Author)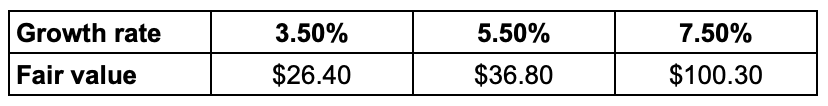
In our opinion, a fair value of $100 per share, based on the constant 7.5% growth, appears to be very high. But, as the stock is currently trading at about $25 per share, even our most conservative growth assumption indicates that the stock could be undervalued.
Let us now take a look at the valuation from a different angle.
Estimation of a justified price-to-earnings ratio
Price multiples are often used separately from present value models. On the other hand, the Gordon growth model could be used to relate fundamentals through a discounted cash flow model. This method allows to determine a so-called justified P/E ratio.
Justified P/E (corporatefinanceinstitute.com)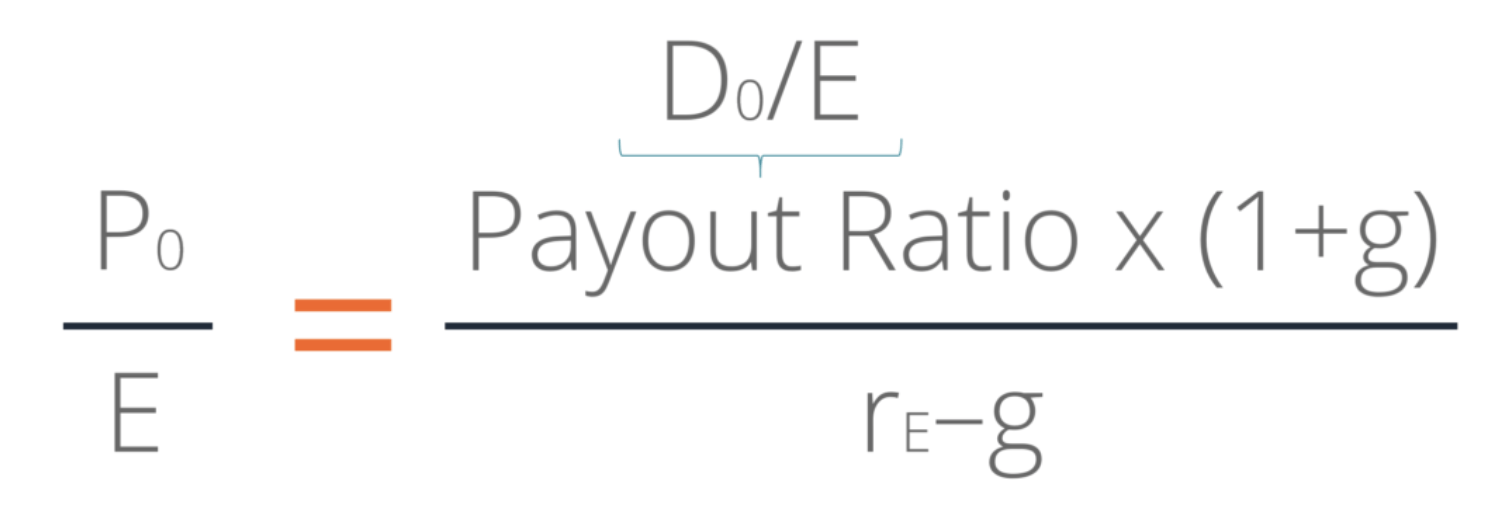
In this calculation our required rate of return assumption remains 9.0%. For the estimated dividend growth rate we also stick to our previously determined 3.5%-5.5%.
The following table and chart depict the firm’s dividend payout ratio.
Dividend payout (seekingalpha.com) Payout ratio (Seekingalpha.com)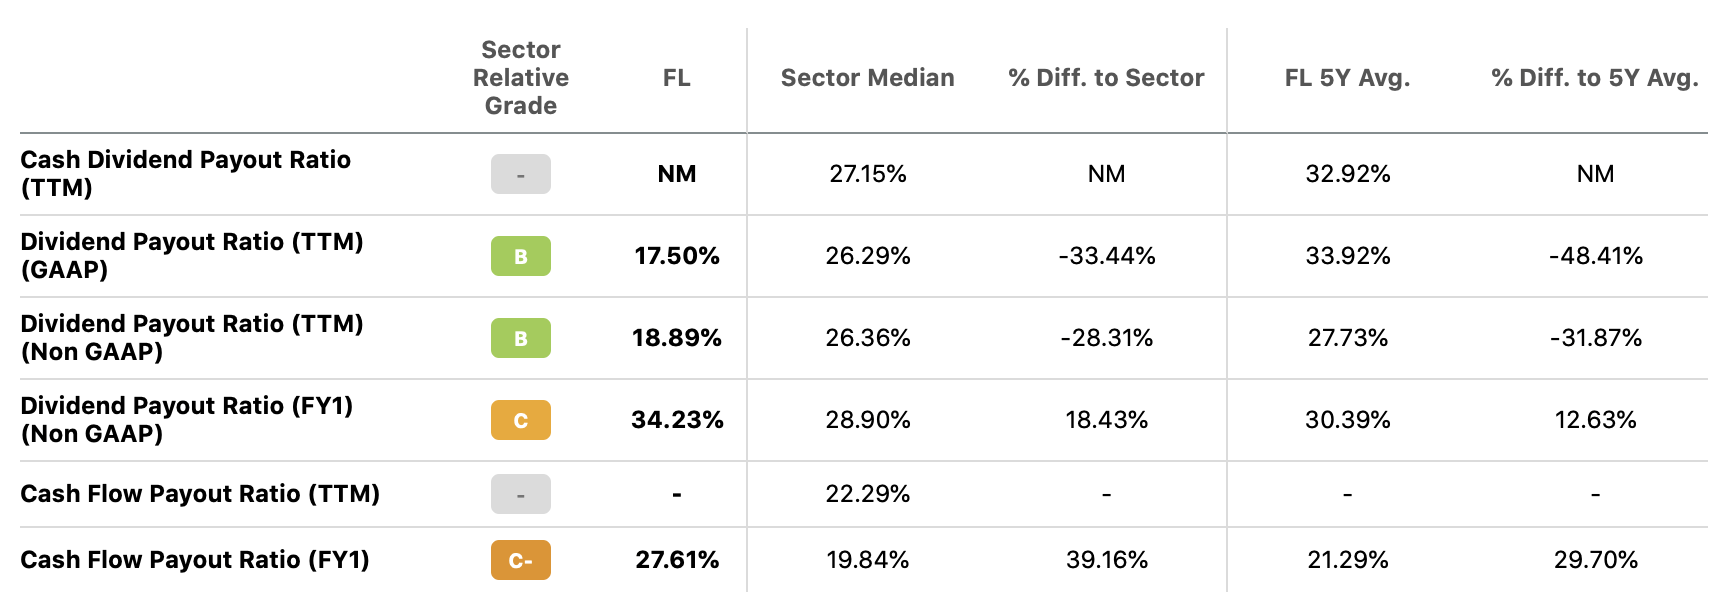
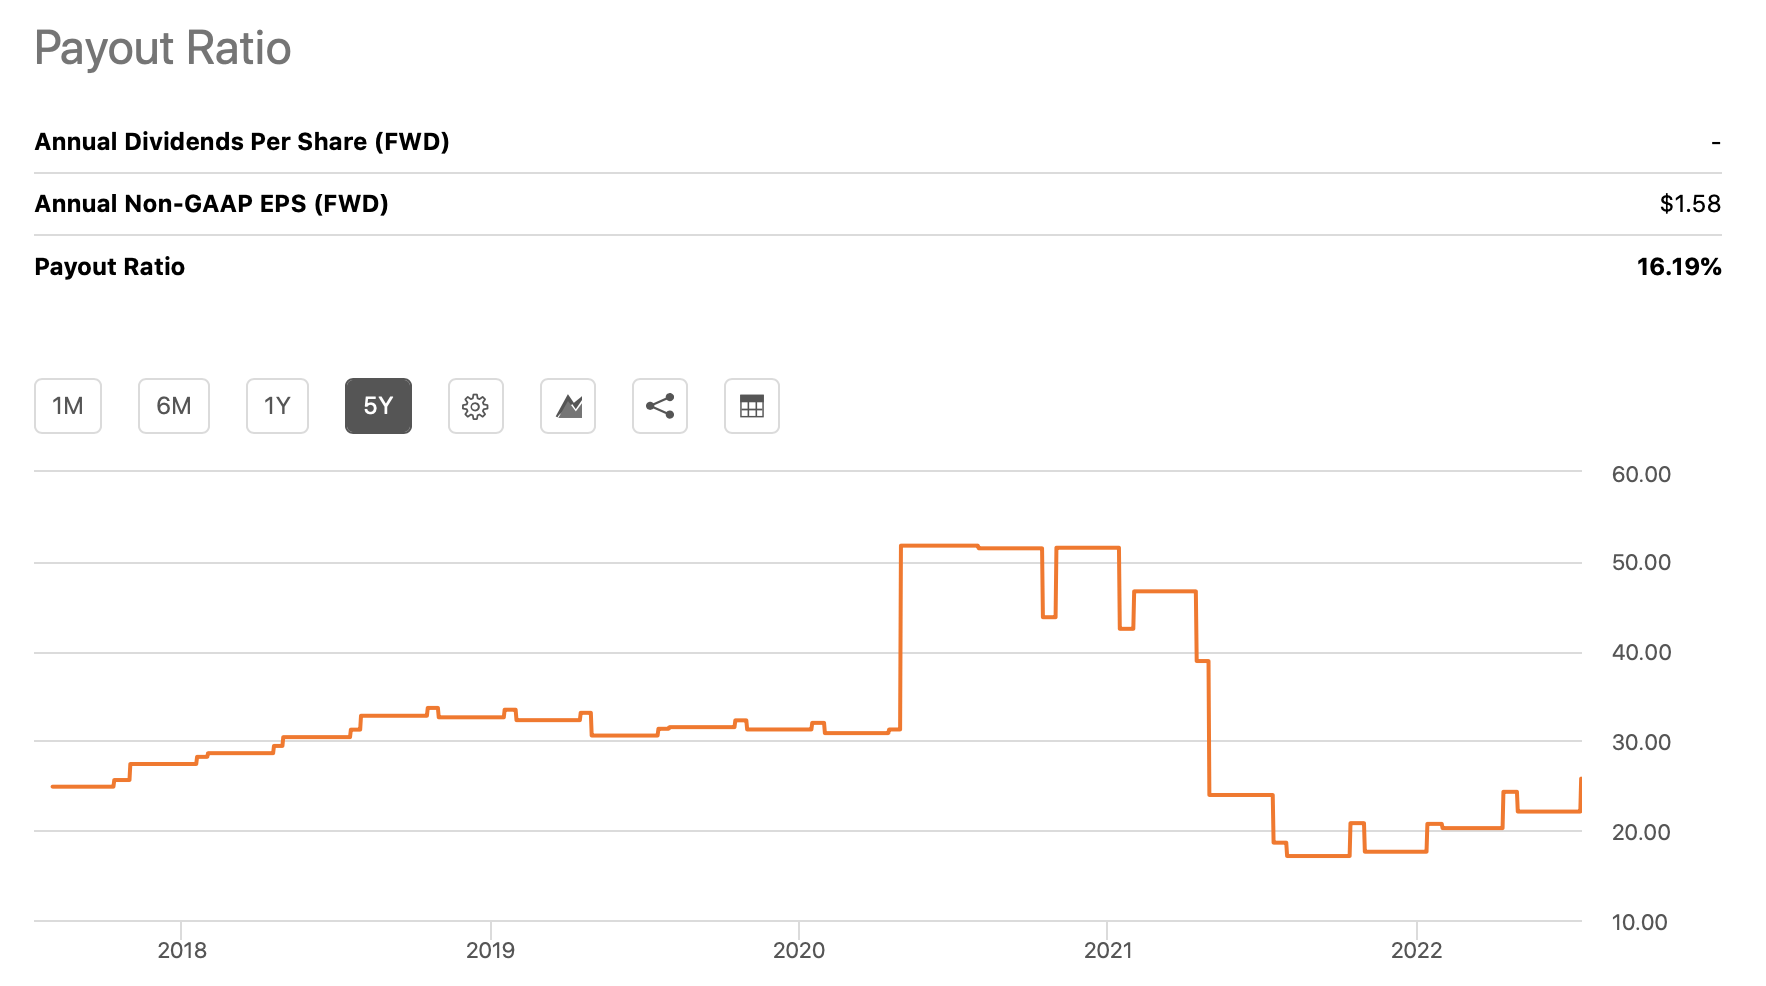
According to this data, a range of 20% to 35% appears to be appropriate. By using the defined assumptions and setting them in to the justified P/E formula, we get the following matrix of results.
Results – justified P/E (Author)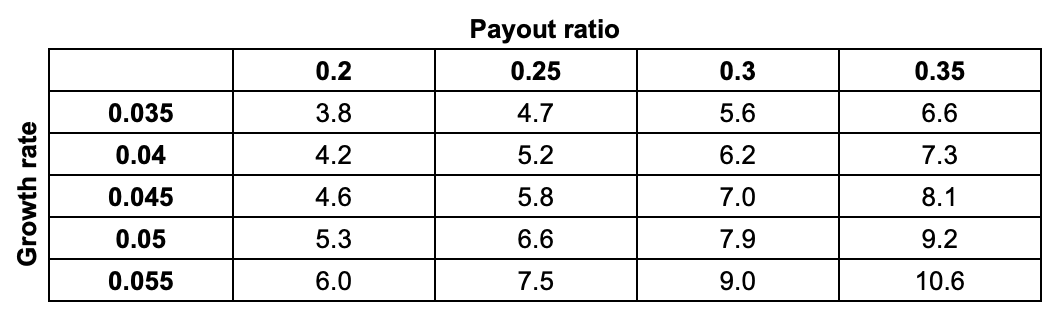
Based on our assumptions, the justified P/E ratio of Foot Locker is estimated to be in the range of 3.8x to 10.6x, with an average of 6.6x.
As FL has a P/E of 3.27 (TTM) and 5.4 (FWD), we believe that the firm is undervalued based on this valuation method as well.
Valuation (seekingalpha.com)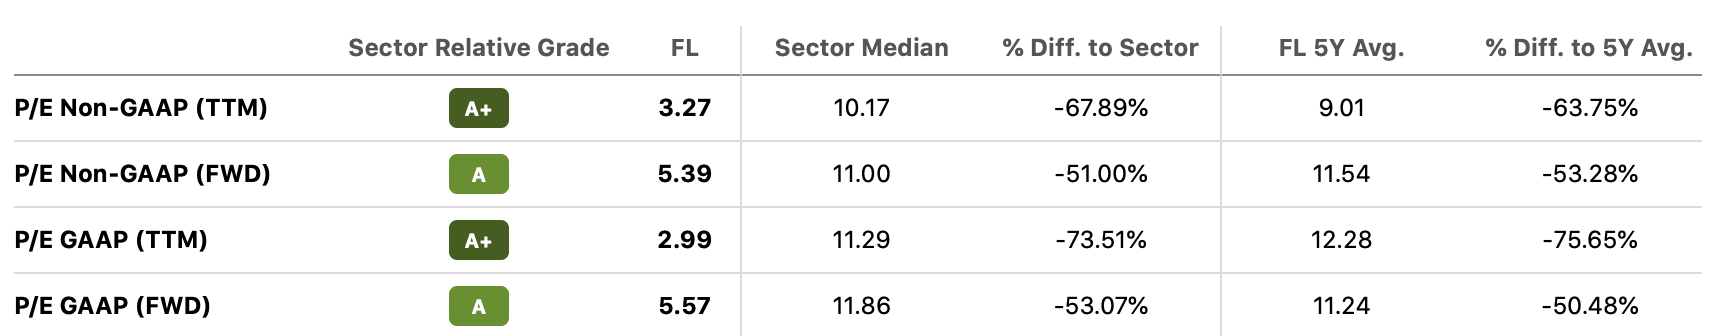
In our opinion, Foot Locker could be an attractive buy at the current price levels from a valuation point of view, based on the results of the Gordon growth model and on the estimation of a justified P/E ratio.
Key takeaways
According to our calculations, based on the Gordon growth model, FL’s stock appears to be undervalued. Also, when calculating the justified forward P/E for the stock, our calculations result in a range of 3.8x to 10.6x, with an average of 6.6x, which compares favourably to FL’s current multiples.
If you are interested in a broader analysis of FL’s stock, take a look at our previous article on the firm, highlighting financial and operational performance and the potential risks associated with the firm.
Be the first to comment