

US Dollar Talking Points:
Chart formations can be helpful tools in a trader’s arsenal. Surely, not all traders are fans, so let’s just go ahead and address their primary failing up front: They do not predict the future. Chart formations will fail. And while it can be easy to walk away from a scenario with an imperfect success rate while saying it ‘doesn’t work,’ the fact of the matter is formations are not designed to be perfect. They’re help for traders to incorporate with an overall approach that’s also addressing risk and money management, and that’s what can start to make trading with formations more attractive: The ability to impart strategy.
As we discuss in Traits of a Successful Trader, a trader’s risk management is going to have a big impact on their bottom line, regardless of how great their analysis might be.
The entire realm of technical analysis is based on the past. And we should all know that the past does not predict the future. But while history may not repeat, it can often rhyme, and this is where formations can come in, helping the trader to see a market in a way that they might not otherwise have seen it, and this can allow for the trader to implement an ‘if-then’ statement that could open the door to larger risk-reward ratios.
US Dollar Builds into Ascending Triangle
Sometimes the formation will match the backdrop really well and it appears as though that’s what we have in the US Dollar currently. Last week saw the FOMC warn that rate hikes may be appearing faster than expected, with a possible hike on the horizon for next year. The bank also said that they may be nearing an announcement of tapering asset purchases, similarly, a factor that’s largely considered to be USD positive.
Add on to this that there are very few economies outside of the US looking at tighter policy options and this can further expose the USD to the potential for strength.
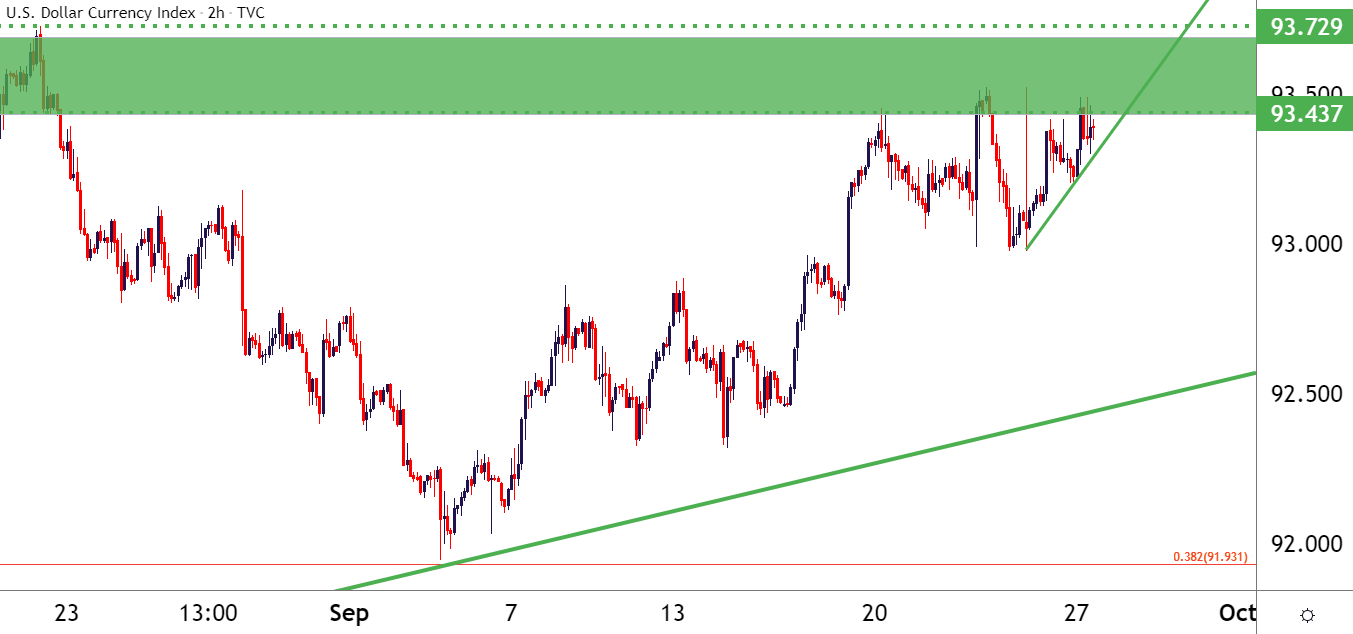
Last week’s announcement from the Fed sent the US Dollar back up to a key level of resistance, at 93.43, which was the same swing-high that set the top in Q1. That price held buyers at bay and late last week saw a support test; but already this week buyers have pushed the Greenback to that 93.43 level and price action is threatening a breakout.
US Dollar Two-Hour Price Chart
Chart prepared by James Stanley; USD, DXY on Tradingview
US Dollar Longer-Term Breakout Potential
Taking a further step back on the chart illustrates the formation well.
The US Dollar has so far spent the bulk of this year mean reverting, and if we take into account the bruising sell-off in the back nine months of 2020 trade, that makes sense. But now that we’re heading into Q4 and the Fed has made this shift, warning of a potential rate hike next year, the backdrop may be setting up for some bigger-picture strength.
From the below chart we can see this year’s dynamics at-play in the US Dollar, with resistance set in Q1 still helping to hold the highs today. That resistance was breached temporarily in August, with the 2021 high coming in at 93.73 and this creates a zone of resistance that remains in-play today.
On the support side of the equation, it’s the area around the 90 psychological level that helped to set the low shortly after the New Year open and then again in May/June. A higher-low in September, right around the Fibonacci level at 91.93, helps to make the bullish trendline that defines the other side of the formation.
To learn more about the ascending triangle formation, check out DailyFX Education
US Dollar Daily Price Chart
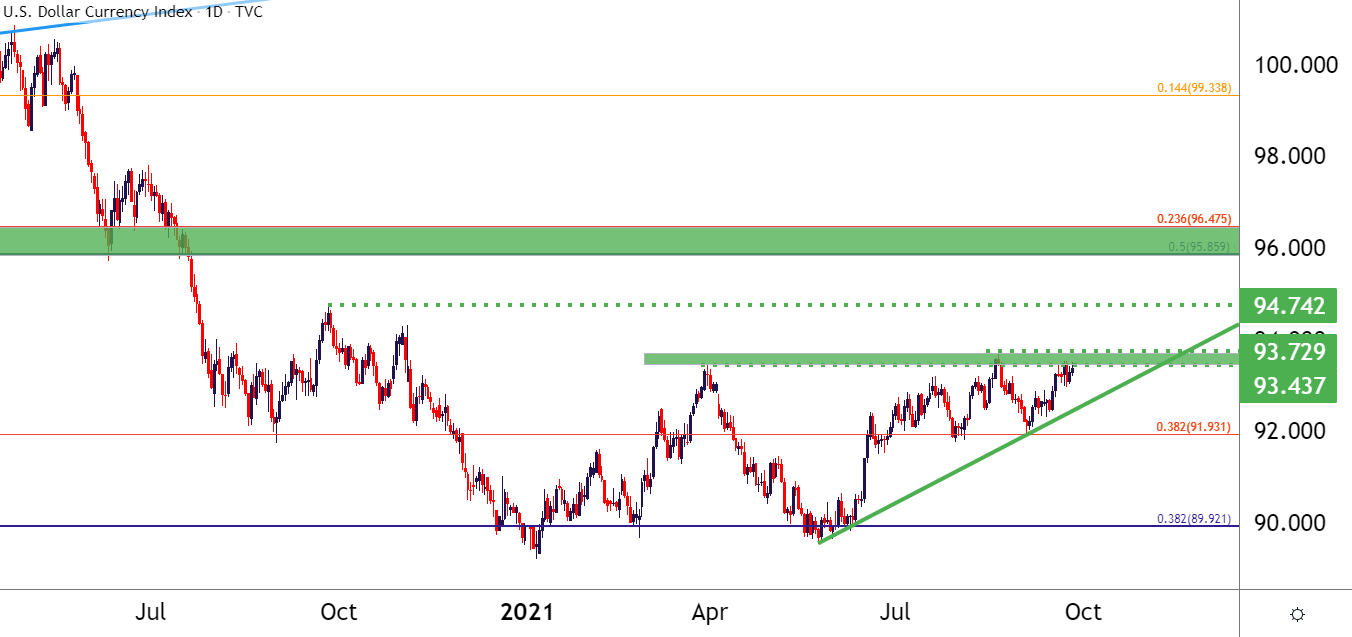
Chart prepared by James Stanley; USD, DXY on Tradingview
Working with the Ascending Triangle in the US Dollar
I’ve just published an Analyst Pick looking at price action setups around the US Dollar and more specifically this ascending triangle formation in the USD. And it’ll probably come as no surprise that three of the four setups that I looked at focus on USD-strength.
EUR/USD carries the mirror image of the US Dollar set up, with breakdown potential to match the USD’s breakout potential. USD/JPY similarly carries breakout potential and as I outlined in this week’s forecast for JPY, a repeat of the Q1 scenario could continue to push the pair higher. There’s a really big resistance zone in-play right now. And in USD/CAD, the pair is holding support at a really big spot on the chart; so slightly different than a pair like USD/JPY or EUR/USD that’s already reflecting that USD-strength quite well.
On the other side of the matter, if this resistance does hold for the next week or two, fade plays could be attractive and the market that I had looked at for that also comes from a fundamental bent, as the Bank of England may be even closer to hiking rates than the Federal Reserve; and with GBP/USD holding higher-low support at a key spot on the chart, there could be an open door to topside plays there, and this could balance out an otherwise heavily long-USD approach.
— Written by James Stanley, Senior Strategist for DailyFX.com
Contact and follow James on Twitter: @JStanleyFX
Be the first to comment