

Enes Evren
Fidelity MSCI Financials Index ETF (NYSEARCA:FNCL) is an exchange-traded fund provided by Fidelity that invests in small-, mid- and large-cap U.S. financial companies, in accord with its chosen benchmark index, the MSCI USA IMI Financials Index. The net expense ratio is just 0.08%.
As of October 31, 2022, FNCL had 387 holdings with net assets under management of $1.6 billion. Over the past year, FNCL’s estimated net fund flows have been negative, as illustrated below (a drop of about $81 million).
ETFDB.com
I previously covered FNCL in August 2021, when I was bullish on the basis that the fund appeared undervalued. Since then, while the fund has technically out-performed (Seeking Alpha data tells me that the price change since then equals -10.84% as compared to the S&P 500 U.S. equity index’s change of -15.00%), the return has still been negative. That is in spite of the fact that longer-term bond yields have risen since August 2021, which are usually constructive for financial companies (especially commercial banks, who lend at longer rates and borrow at very low short-term rates).
Recent weakness across equity markets has stretched across almost all sectors, with some exemptions, such as the energy sector (given higher energy prices this year). Nevertheless, while FNCL has performed poorly this year too, the sub-1.00x “downside beta” is constructive and does potentially indicate better value in FNCL’s portfolio. It is worth revisiting the fund’s valuation.
Some data sources offer exaggerated earnings estimates, whether directly or implicitly via forward price/earnings ratios. Therefore, I am referencing FNCL’s benchmark index factsheet from MSCI instead, as of October 31, 2022, as a proxy for FNCL’s portfolio which closely resembles the benchmark. The forward price/earnings ratio as of that date was 11.57x, with a price/book ratio of 1.54. The implied forward return on equity and earnings yield was 13.31% and 8.64%, respectively. The return on equity used to be higher, but as I noted in my last article, it made sense that it would normalize in the 12-15% range; in fact, I would probably argue that closer to 10-12% might be the long-run return on equity, as the financial industry is generally mature and competitive.
Nevertheless, a forward earnings yield of almost 9% is healthy, even if longer-term U.S. bond yields have risen.
Three- to five-year earnings growth is expected to hit circa 12.40% on average, according to Morningstar. That is high; I would prefer to assume a lower average of about 4-5%, in line with an assumption that FNCL’s average return on equity will drop to about 10% over the next few years. While that might be conservative, this is a better starting point for valuation purposes. Meanwhile, the current U.S. 10-year yield is about 4.16%, however I will assume 4% for simplicity. Keeping most other factors constant, I arrive at an implied IRR of about 11%.
Author’s Calculations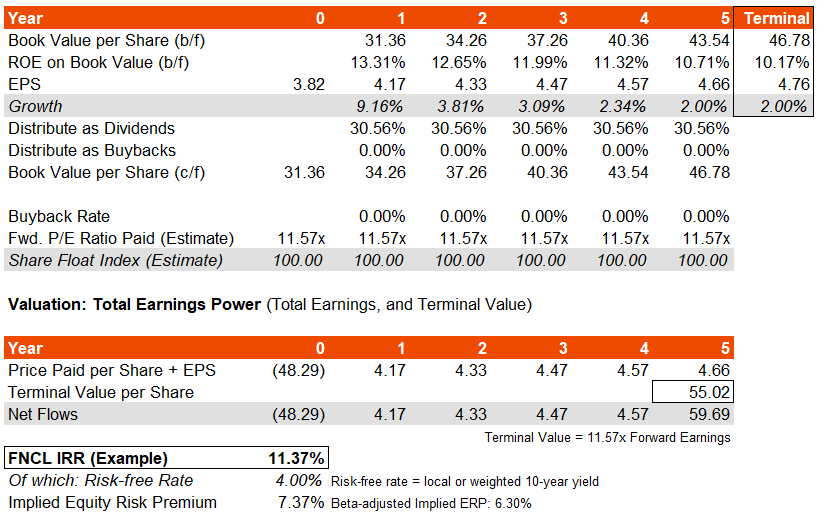
The implied underlying equity risk premium is 7.37%, which is high, and on a historical beta-adjusted basis, that is still 6.30% (FNCL’s five-year beta is about 1.17x, so potentially a little riskier than broader U.S. equity funds).
If we assumed a 5.5% equity risk premium (what I would consider conservative for U.S. equities) scaled by expected beta of 1.17x, and added 4% as a notional risk-free rate for a long-term equity holding, the implied cost of equity would come to 10.44%. Assuming long-term earnings growth of at least 2% would provide us with an indicative forward price/earnings ratio of 11.85x, which is very close to the most recent earnings multiple of 11.57x referenced above.
I would say that the present FNCL valuation is between fair and conservative, with an implicitly elevated equity risk premium. That is, based on my more conservative earnings growth trajectory, which is about half as generous as consensus analyst estimates. Once again, FNCL appears undervalued. Implied downside is basically zero, while implied upside would be about 10% given that the forward IRR of over 11% beats my fair cost of equity estimate of about 10%.
The current global business cycle, illustrated below, would currently support slowing growth in basically all major economies across the world. This negative trajectory, at least in terms of growth acceleration/deceleration, can make it difficult for financial companies’ stock prices to appreciate.
Fidelity.com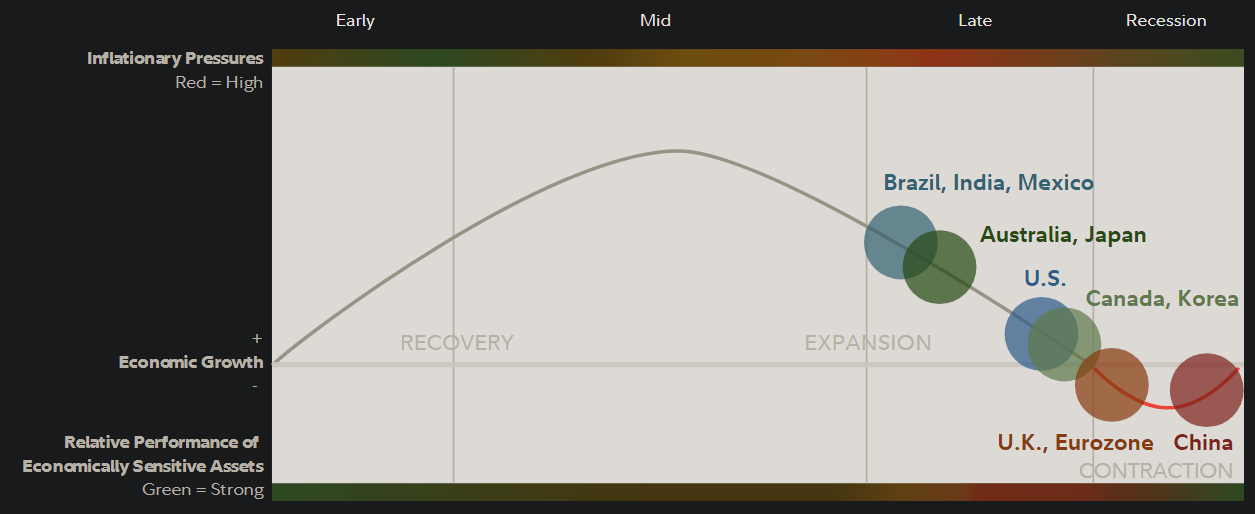
Financial companies can be viewed as more general bets on the macroeconomy. They are “cyclical stocks”, and the current cyclical direction is negative. It makes sense that financial stocks are heading down along with other stocks, but the better value on offer has helped to compress the downside beta below 1.00x against the broader local equity indices.
Contracting stimulus (fiscal and monetary) as well as higher inflation have also weakened the investment case for all equities, and made the broader economic environment simply riskier for financial companies, including commercial banks. Customers, and potential customers, are now riskier credits. Meanwhile, a very difficult investment environment has made it difficult for pro-cyclical financial companies to profit, with almost all asset classes bar certain commodities (and commodity-exposed equities) performing poorly this year.
Equities tend to lead the economy by about 6-12 months. It is certainly possible that a recession occurs in 2023 in the United States, given contradictory policy and other factors. Fidelity’s research above is based on growth moderating, tighter credit availability (especially vs. GDP), earnings pressures, contradictory policy, and higher inventory/sales ratios. If an uncomfortable (not just a technical) recession were to hit in 2023, it makes sense that FNCL might have already bottomed, alongside other equities. That could mean that FNCL’s cyclicality makes it well-positioned to bounce back.
TradingView.com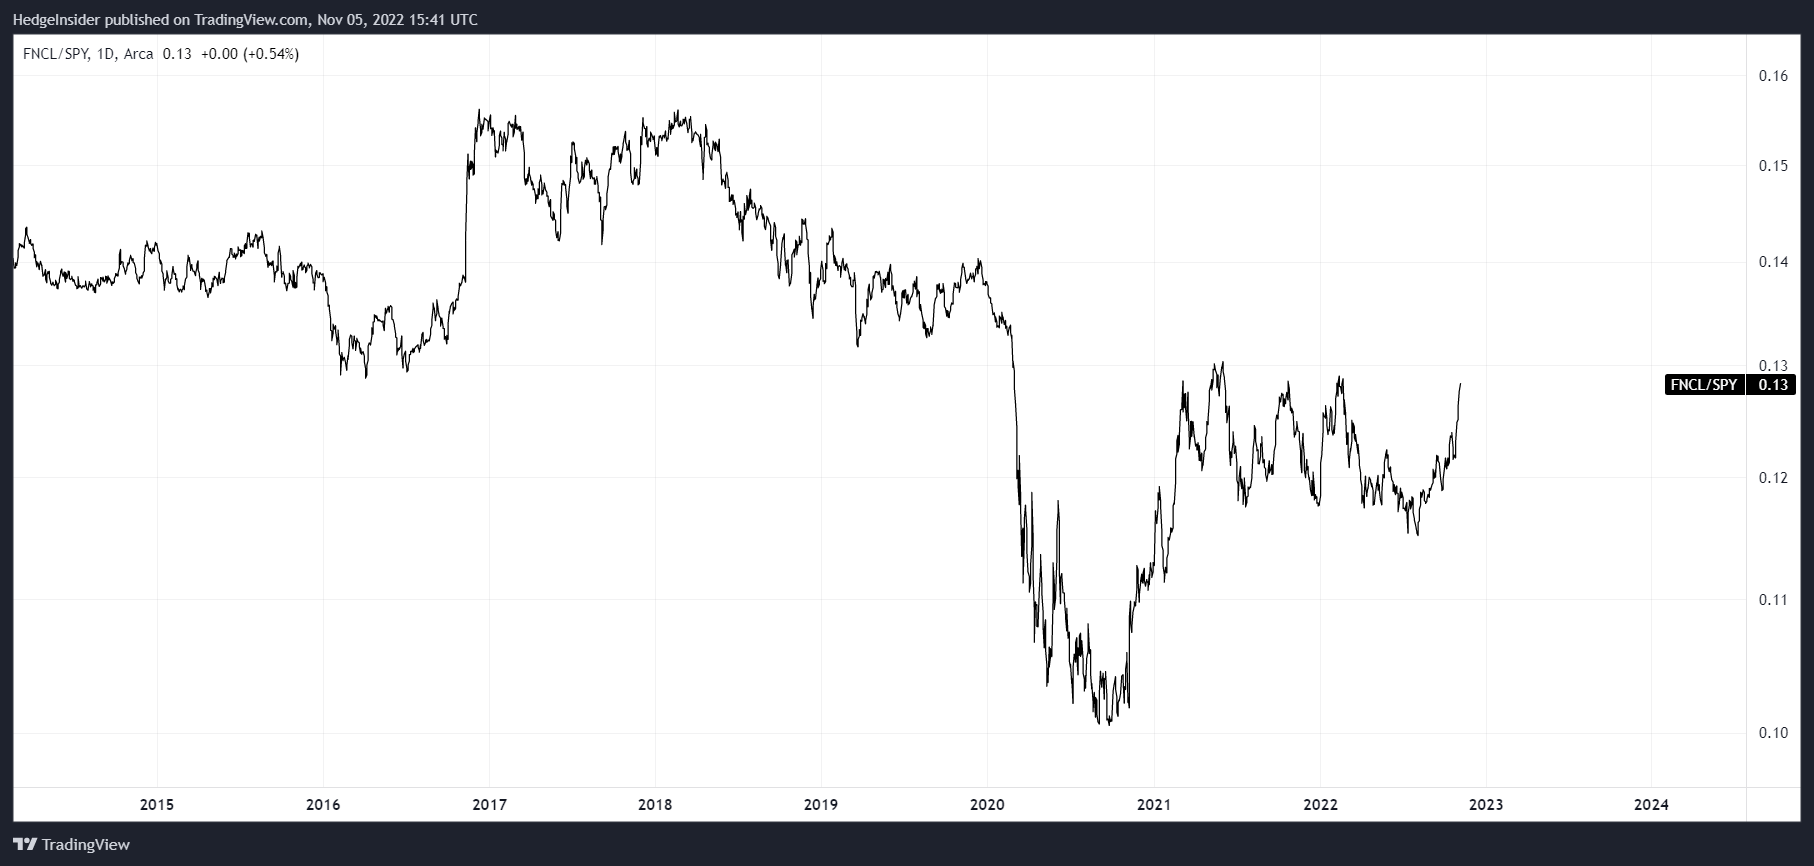
FNCL is already rallying against SPDR S&P 500 ETF Trust (SPY), a popular S&P 500 index tracker. The chart above is the FNCL/SPY ratio, which you can also notice rallied from late 2020 (after initial under-performance). The bottom in the FNCL/SPY ratio (end of Q3 2020) came after the U.S. equity market bottom in (end of Q1 2020). Nevertheless, FNCL beat SPY materially thereafter, and from the end of Q1 2020 to the end of Q1 2021 it was up 8% on a relative basis.
It is difficult to time relative performance, but if we are about to head into a contractionary phase, it would be unsurprising for the FNCL/SPY ratio to break out of its late-2020 to present trading range. This would mark the beginning of the next business cycle. The fact that the ratio is already out-performing could in fact be optimistically viewed as the market trusting in a relatively average-length recession. That makes sense at this juncture given that while the U.S. unemployment recently rose to 3.7% in October 2022, unemployment is still very low in absolute terms and may well remain low by historical standards.
In summary, FNCL could be becoming cyclically well-positioned, it remains undervalued, and relative to the broader equity markets it is priced at a relatively low earnings multiple, making it an interesting fund with a low expense ratio.
Be the first to comment