luoman/E+ via Getty Images
I enjoy searching for real estate investment trust (“REITs”) that are flying under the radar.
Sometimes these less popular stocks don’t have the same analyst love as the large cap names.
But that’s okay with me.
These a reason that our Small-Cap REIT portfolio has generated impressive results.
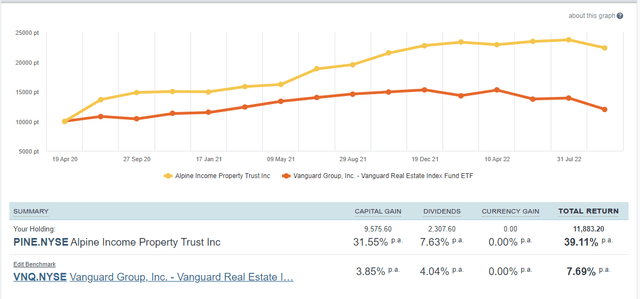
Take Alpine Income Property Trust, Inc. (PINE).
I was one of the first analysts on Seeking Alpha to hit the Strong Buy button, and shares have returned a whopping 39% annually since April 2020.
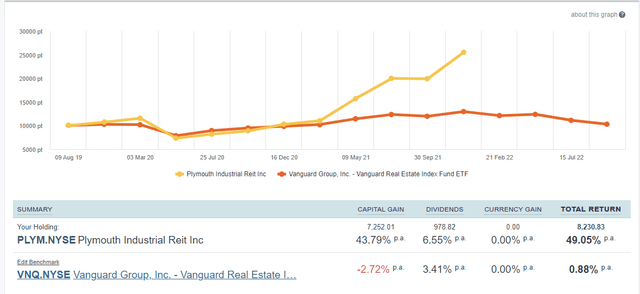
Plymouth Industrial REIT, Inc. (PLYM) is another small-cap pick that we scored on in early innings. As I explained in April 2019, “I’m warming up to Plymouth,” and in August 2020 – during the pandemic – we backed up the truck. We unloaded shares in November 2021, and the result was 49% annualized returns.
Of course, the key to selecting sound securities, whether big or small, is to focus on fundamentals. Just because a company is “flying under the radar” does not mean you should take shortcuts.
In fact, small-caps deserve more attention, because there isn’t as much research available. And at iREIT on Alpha, we take pride in our research, which is why we invest considerable time and money in our resources. That includes FactSet, Sharesight, FAST Graphs, Alpha Value, and Morningstar.
Today, we’re focusing on the healthcare REIT sector in which we will examine three smaller-cap REITs. As you can see below, healthcare REITs are trading at an average dividend yield of 5.9%, with an average P/FFO of 16.7x.
iREIT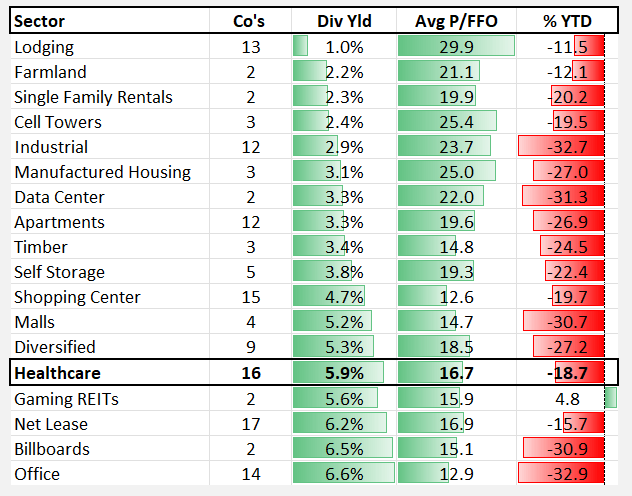
Do you Trust CareTrust?
CareTrust REIT, Inc. (CTRE) has a market cap of $1.9 billion and owns healthcare related properties such as skilled-nursing, senior housing, and multi-service campus.
As of Q2 2022, the company had the following:
- 198 properties
- 21,537 beds
- 18 different operators
- Properties within 21 states.
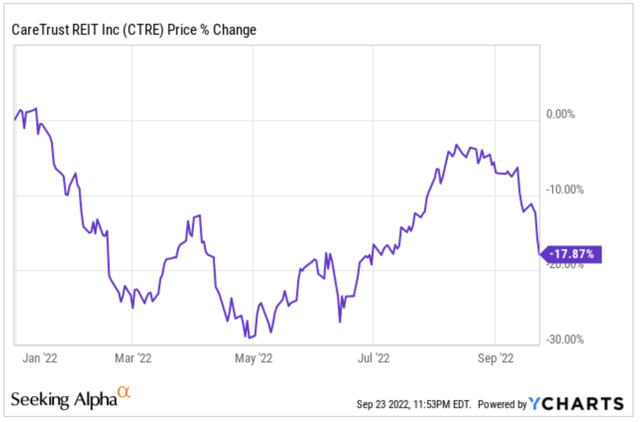
Year-to-date, shares of CTRE are down 18%, in what has been a bit of a rollercoaster on the year.
CareTrust focuses primarily on skilled nursing facilities, or SNFs, which make up ~75% of total rent. The next largest asset types are multi-service campus and Senior Housing, which make up 18% and 7% of total rent, respectively.
Over the past quarter, the rent earned from Senior Housing has been cut in half, while Skilled Nursing has increased. During the quarter, the REIT sold off a portion of their Senior Housing portfolio, which had been a weaker area due to continued labor issues.
Altogether, the company owns 198 properties across 21 states that are leased out to 18 different operators. The company’s largest tenant is The Ensign Group, which is the company from which CareTrust REIT spun off back in 2014.
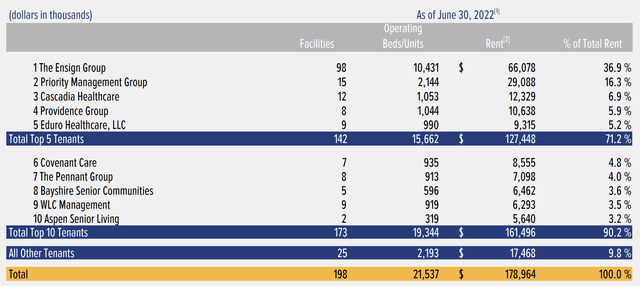
Here is a look at the company’s top 10 tenants:
As you can see, The Ensign Group makes up 36.9% of the company’s total rent, which makes sense given how the company was formed. As I mentioned a second ago, CTRE came public by spinning off the real estate assets of The Ensign Group, but since the IPO, the company has done a nice job diversifying their tenant base.
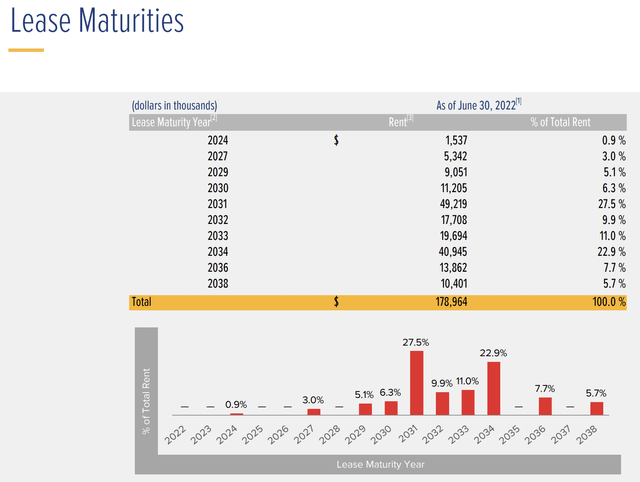
Lease maturities are also far out, with less than 1% of rent having a maturity by 2024. The largest impact does not happen until 2031.
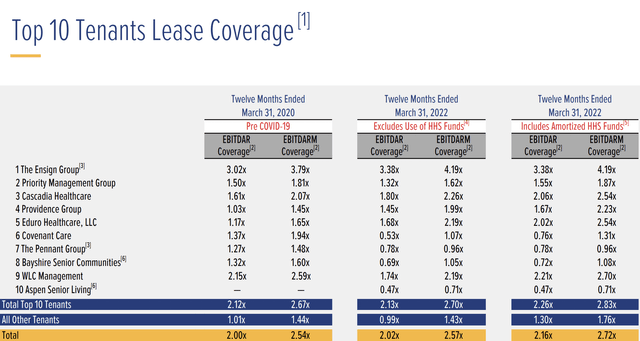
Tenant health is also in good shape for the company’s largest tenant. Looking at the chart below, you can see the solid EBITDAR rent coverage for The Ensign Group standing at 3.38x and EBITDARM of 4.19x.
CTRE reported iQ2 ‘22 earnings last month that saw the company generate FFO of $0.37.per share which was a 0.7% decrease from the prior year. During the quarter, the company collected 93.9% of total rent due.
CareTrust pays an annual dividend of $1.10, which equates to a dividend yield of 5.9%. The dividend is well covered with an FFO (funds from operations) payout ratio of 71%. If history is any indication, December is when we expect to see another dividend hike. CTRE has increased the dividend every year since becoming a public company.
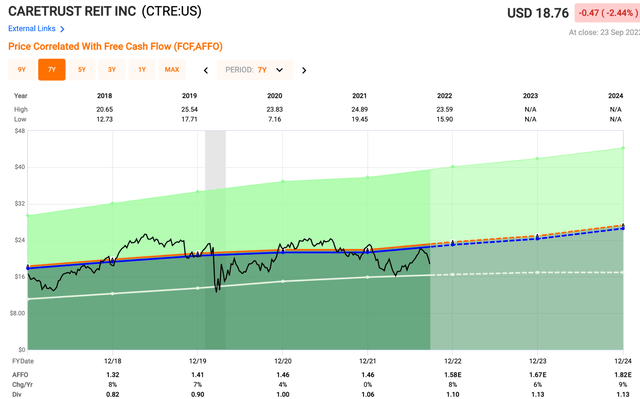
Looking at the FAST Graphs chart above, you can see that shares of CTRE are trading at a discount to their 5yr adjusted FFO (“AFFO”) average. Shares currently trade at a forward P/AFFO multiple of 12.2x compared to a five-year average P/AFFO of 14.6x.
Analysts are expecting AFFO growth of 6% and 9% each of the next two years, giving investors plenty to be excited about in the coming years. Given the drop in the shares, there is plenty of upside and limited risk based on the current valuation for long-term investors.
A Monthly Dividend Payer
LTC Properties, Inc. (LTC) is another small-cap real estate investment trust with a market cap of $1.6 billion. The REIT is headquartered in California, United States. According to the LTC website:
LTC Properties focuses on investing in seniors housing and health care primarily through sale-leasebacks, mortgage financing, joint-ventures, construction financing and structured finance solutions including preferred equity, bridge, mezzanine & unitranche lending.
The company’s real estate portfolio consists of 50% skilled nursing properties and 50% senior housing properties. So, in comparison to CTRE, which we just looked at, they were lessening their focus on senior housing and boosting their focus on skilled nursing.
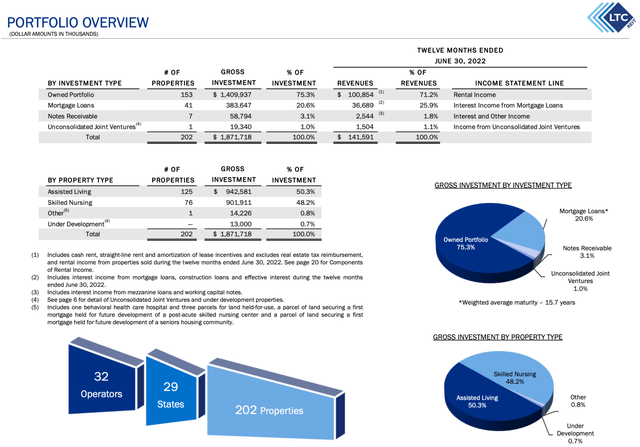
Looking at the portfolio overview below, you can see that 71% of their revenue comes from rental revenues derived from their real estate portfolio. Nearly 28% came from mortgage loans and notes receivables, with the remaining revenue derived from joint venture deals.
In total, the REIT has 202 properties that are leased out to 32 different operators within 29 states in the U.S. Of those properties, 153 are owned outright by LTC.
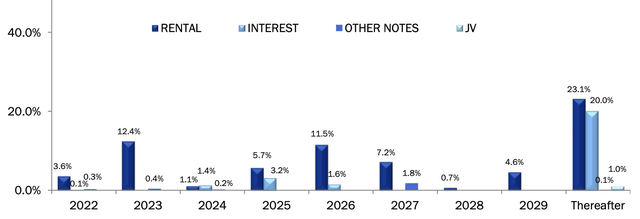
In terms of portfolio maturity, LTC does have some things to figure out, as they have 12.4% of their rental income maturing next year in 2023.
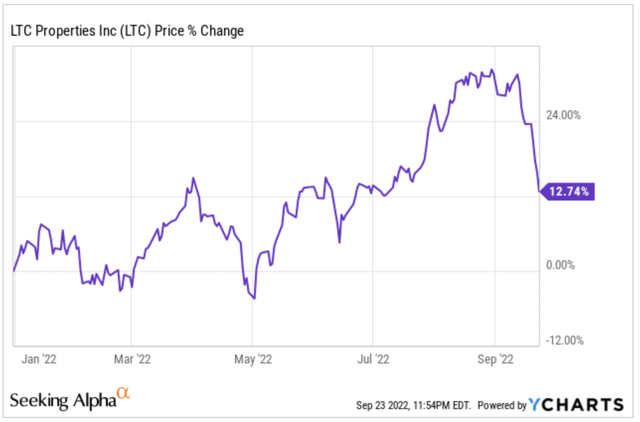
On the year, shares of LTC have been performing very well, with the stock up 12.7%. Going back a few weeks, prior to the market-wide sell-off we have seen, shares of LTC were up over 25% on the year.
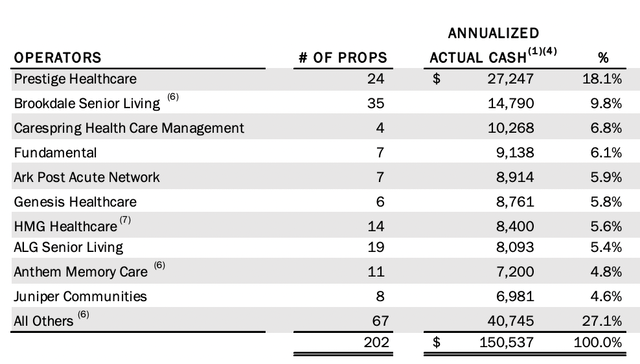
As mentioned, the company has 32 operators, and the top 10 make up roughly 73% of total rental income. The company’s largest operator, Prestige Healthcare, accounts for 18.1% of annual rental income.
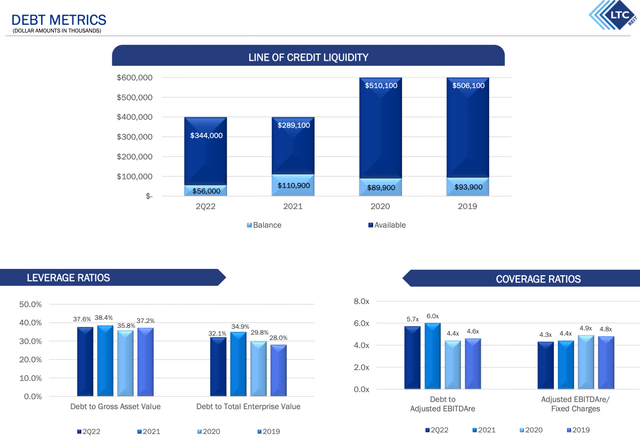
LTC does not have a credit rating, so let’s take a closer look at their balance sheet. Looking at the chart below, you can see that the company has lowered not only their outstanding debt, but also their entire line of credit from the highs of 2020.
Debt to adjusted EBITDA was 5.7x and Adjusted EBITDAre/Fixed Charges was 4.3x. The company has $737 million in total debt as of Q2 ‘22, with 21% of that due in 2025.
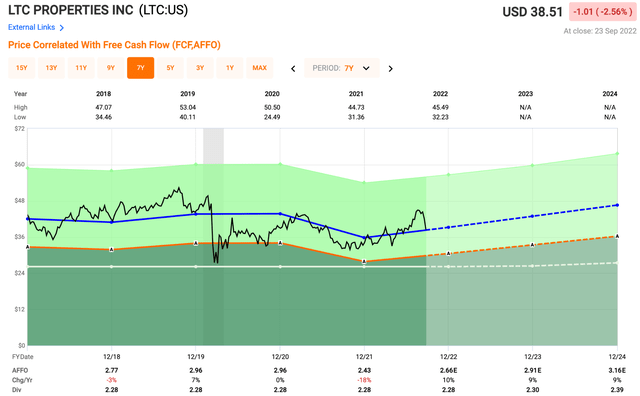
Looking at the dividend, LTC is like Realty Income (O) in the fact that they pay a monthly dividend. However, unlike O, since the end of 2016, the dividend has largely remained unchanged.
Currently, LTC pays a monthly dividend of $0.19, which equates to an annual dividend of $2.28. The current dividend yield is 5.9%.
In terms of valuation, LTC currently trades at an AFFO multiple of 14.8x, which is right in line with their 5-year average of 14.8x.
LTC appears to be trading at fair value, but I would like to see further growth from the company both in operations and the dividend before choosing to deploy any money in this REIT.
Now A High-Yielder
The final small-cap REIT we will look at today is Global Medical REIT Inc. (GMRE), which also happens to be the smallest among the three with a market cap of just $635 million.
Unlike LTC and CTRE, which both focus on skilled nursing and senior housing type properties, GMRE focuses more on medical office buildings. A similar REIT you may have heard of would be Physicians Realty Trust (DOC), a larger competitor with a market cap of $3.7 billion.
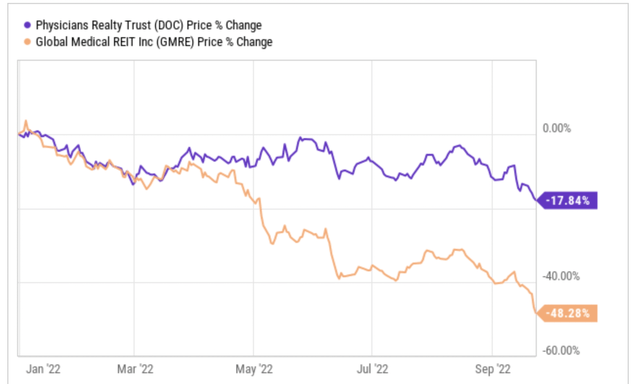
The office building sector in general has been punished hard over the past year, and it is no different for medical office landlords either. On the year, shares of GMRE are down nearly 50%, with DOC shares down 18%.
So, is this a company that no longer warrants a valuation in line with others in its industry, or are we looking at a bargain with plenty of upside?
Regular office buildings, yes, I can see where there could be some softness, as many businesses around the world are becoming more comfortable with a work-from-home environment. However, seeing a medical professional, getting an X-Ray, or CT scan, all of those things are still and will most likely require in-person appointments for the foreseeable future.
Let’s take a look at the company’s latest earnings result to get a better idea. Global Medical reported adjusted funds from operations of $17.6 million, which was a 17.3% increase from Q2 the prior year.
Revenues continue to climb each and every year as well.
During the quarter, the company completed five new acquisitions totaling $74.1 million, with a weighted average cap rate of 6.9%. This brings the annual number of property acquisitions up to nine on the year, as management continues to look for ways to strengthen and grow the portfolio.
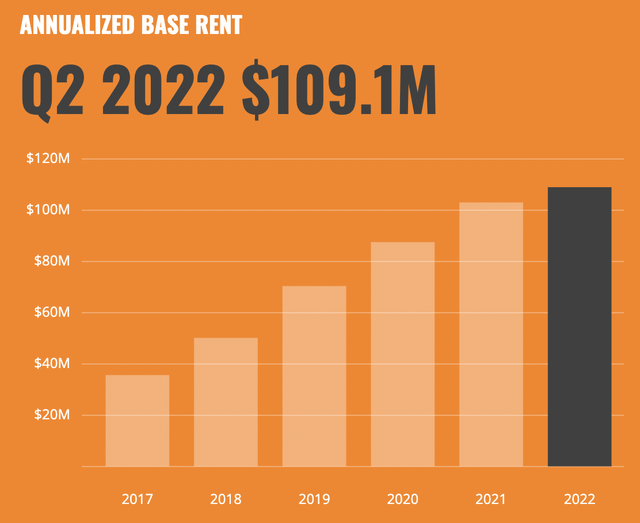
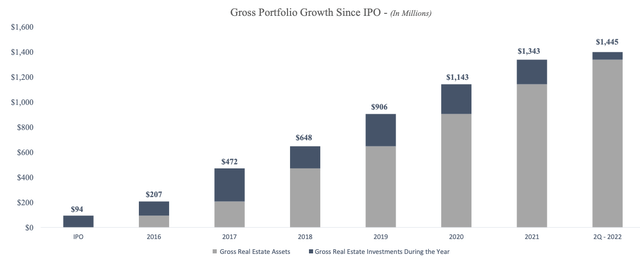
Being a company that has been around for less than 10 years, GMRE is still in expansion mode. Looking at the chart below, you can see the aggressive expansion the portfolio has gone under over the years as the company continues to grow.
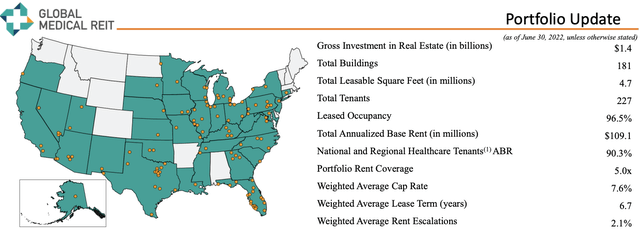
Speaking of the portfolio, the company ended the quarter with an occupancy rate of 96.5%, which is higher than its competitors Physicians Realty Trust and Healthcare Realty Trust, who had occupancy levels of 95.0% and 89%, respectively, during the most recent quarter.
During the quarter, GMRE generated $25.0 million in adjusted EBITDAre for the quarter, an increase of 11.6%, over prior year.
Global Medical has 181 properties valued at $1.4 billion that are leased out to 227 tenants.
The portfolio is leased out to 90% National and Regional Healthcare tenants, with LifePoint Health being the largest tenant. LifePoint accounts for 6.9% of total annualized base rent. This is encouraging given the fact that the other two REITs we looked at today had large exposure to its top tenant, whereas here things are more diversified.
The second largest tenant, Encompass Health, has a BB- credit rating and is the largest owner and operator of rehabilitation hospitals in the U.S.
The aging population will continue to be a tailwind for the sector as many are expecting what they refer to as “the Silver Tsunami.” This is simply an aging population, that is living longer but will also need healthcare providers like those that lease properties from all three of the REITs we have covered today.
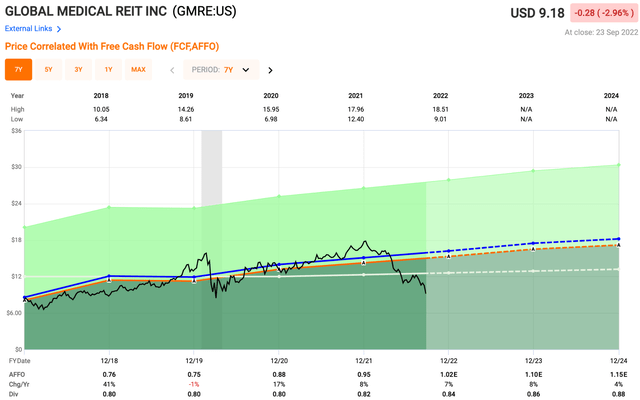
Looking at valuation, analysts expect adjusted 2023 AFFO of $1.10, which would equate to a forward P/AFFO multiple of 8.3x. Over the past five years, shares of GMRE have traded closer to a multiple of 15.9x, suggesting GMRE shares are very undervalued.
For comparison purposes, DOC shares trade over 15x, which could suggest multiple expansion could be down the road for GMRE.
Looking at the dividend, given the fact that shares have fallen so much the past 12 months, GMRE currently yields a very high dividend of 9.2% with an AFFO payout ratio of roughly 88%, which is something to watch in its early years.
In Closing…
I hope you enjoyed this article, the first in our “Flying Under The Radar” series. Let me know your thoughts below.
As always, thank you for the opportunity to be of service.





Be the first to comment