SDI Productions
Flowers Foods (NYSE:FLO) is the second largest U.S. producer of packaged bakery goods such as breads, tortillas, rolls, buns, and snack cakes. They produce and distribute recognizable brands such as Nature’s Own, Dave’s Killer Bread, and Wonder bread.
Flowers has been able to pass along inflationary costs as their core business is related to bread which isn’t something too many people are willing to give up. In Q2 they saw sales increase 11.0% compared to Q2 FY 2021 with price/mix being +14.4% with volume down 3.4%. The first half of FY 2022 shows similar results as well with total sales up 10.6% with a +13.9% pricing/mix contribution but a 3.3% volume decline.
Walmart/Sam’s Club (WMT) does represent over 20% of sales introducing some customer concentration risk; however, given the products that Flowers provides, namely bread, it’s not that concerning.
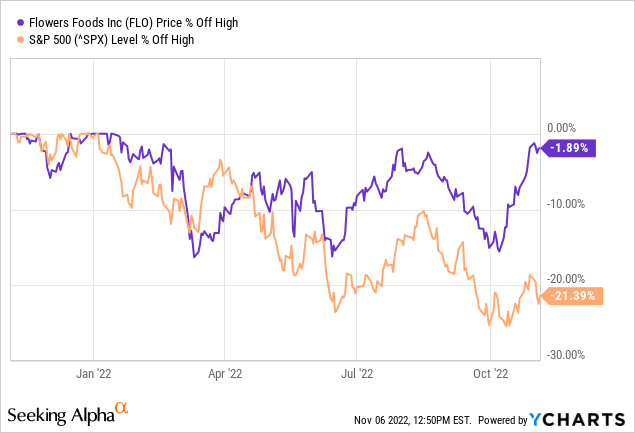
Flowers’ share price is surprisingly only around 2.0% off its high reached earlier this year compared to the S&P 500’s 21%+ drawdown. As investors sought out stable businesses such as the consumer staples, Flowers has thus far been a safe haven for investors.
Dividend History
As a dividend growth investor, one of the filters that I use to narrow down potential investment candidates is a company’s dividend history. Companies that have a record of both paying and growing their dividends over time are more likely to have a strong and defensible position around the business.
Flowers Foods Dividend History (FLO Investor Relations)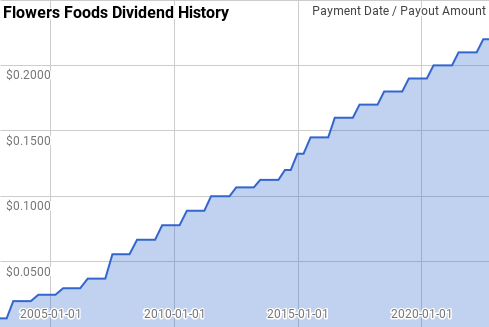
Flowers Foods has amassed a solid streak of dividend growth that is up to 20 years long and soon to reach 21. That gives them the title of Dividend Contender and has them well on their way to reaching Champion status.
Flowers’ dividend growth has been strong over that time; although it has been trending lower. The year over year dividend growth has ranged from 5.1% to 45.0% with an average of 15.7% and a median of 12.9%.
Over that time there’s been 15 rolling 5-year periods with annualized dividend growth coming between 5.8% to 31.1% with an average of 14.6% and a median of 10.3%.
There’s also been 10 rolling 10-year periods with Flowers’ annualized dividend growth spanning from 7.9% to 31.9% with an average of 15.4% and a median of 14.4%.
*The range, average, and median dividend growth rates exclude FY 2002 which had just one payment and thus abnormally high dividend growth when referenced to that year in future periods.
The rolling 1-, 3-, 5-, and 10-year annualized dividend growth rates from Flowers’ since 2002 can be found in the following table.
| Year | Annual Dividend | 1 Year | 3 Year | 5 Year | 10 Year |
| 2002 | $0.026 | ||||
| 2003 | $0.066 | 150.00% | |||
| 2004 | $0.094 | 42.27% | |||
| 2005 | $0.114 | 20.87% | 62.60% | ||
| 2006 | $0.141 | 23.88% | 28.67% | ||
| 2007 | $0.204 | 44.95% | 29.47% | 50.49% | |
| 2008 | $0.256 | 25.47% | 31.09% | 31.11% | |
| 2009 | $0.300 | 17.36% | 28.75% | 26.16% | |
| 2010 | $0.345 | 14.80% | 19.12% | 24.86% | |
| 2011 | $0.389 | 12.89% | 15.00% | 22.57% | |
| 2012 | $0.420 | 8.02% | 11.87% | 15.57% | 31.88% |
| 2013 | $0.444 | 5.74% | 8.84% | 11.68% | 21.01% |
| 2014 | $0.485 | 9.19% | 7.64% | 10.08% | 17.84% |
| 2015 | $0.568 | 17.01% | 10.54% | 10.50% | 17.46% |
| 2016 | $0.625 | 10.13% | 12.06% | 9.95% | 16.09% |
| 2017 | $0.670 | 7.20% | 11.37% | 9.79% | 12.64% |
| 2018 | $0.710 | 5.97% | 7.75% | 9.83% | 10.75% |
| 2019 | $0.750 | 5.63% | 6.27% | 9.11% | 9.59% |
| 2020 | $0.790 | 5.33% | 5.65% | 6.84% | 8.65% |
| 2021 | $0.830 | 5.06% | 5.34% | 5.84% | 7.88% |
Source: Author; Data Source: Flowers Foods Investor Relations
The dividend payout ratio lets you know how much buffer there is between the earnings or free cash flow and the amount of dividends being paid out. All else being equal, the lower the payout ratio the better as there’s also potential for the dividend to be increased faster than the growth of the underlying business.
FLO Dividend Payout Ratios (FLO SEC filings)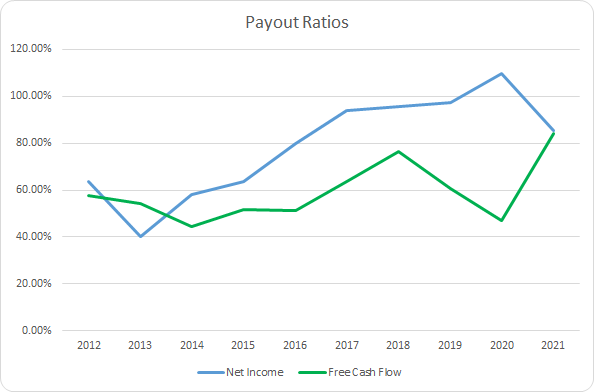
Over the last 10 years Flowers’ net income payout ratio has averaged 78.8% with a 96.4% average over the last 5 years. The free cash flow payout ratios look more sustainable at 59.1% and 66.4% averages respectively.
Quantitative Quality
I seek to invest in businesses that I believe are stable and should continue to show solid results over time. As such I want to examine the business through a historical lens to see how the business has performed across a variety of financial metrics.
FLO Revenue Profits and Cash Flow (FLO SEC filings)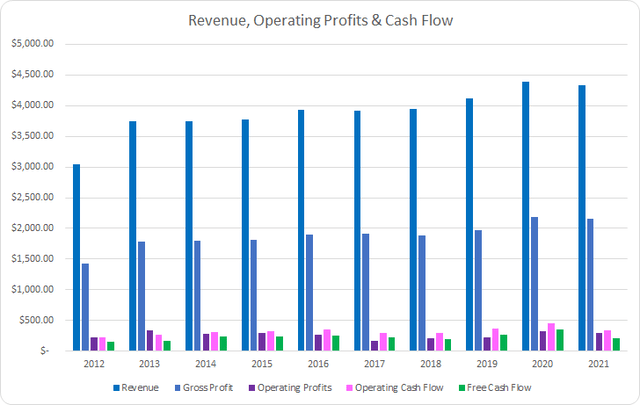
Flowers has shown steady growth in revenues due in part to acquisitions. Between FY 2012 and FY 2021 revenues rose by 42.2% in total or ~4.0% annualized. Gross profit rose by 50.9% or 4.7% annualized over that same time.
Meanwhile, operating profits lagged behind revenue growth improving by just 35.0% in total or 3.4% annualized. Operating cash flow fared better rising by 58.9% or 5.3% annualized with free cash flow lagging revenue growth increasing by just 39.4% or 3.8% annualized.
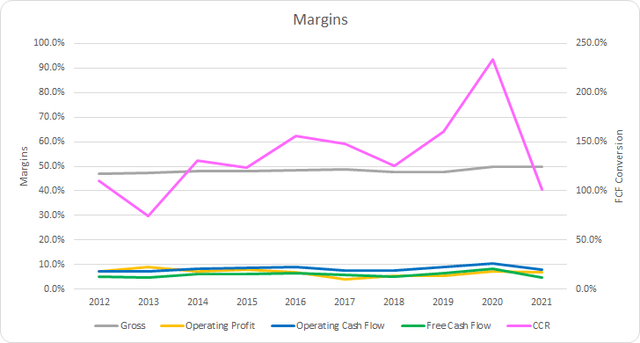
My expectation is that good businesses will be able to defend their competitive positioning as evidenced by stable or improving margins over time. I typically want to see free cash flow margins greater than 10%, although I weigh the trend in margins more heavily than the absolute level.
Flowers hasn’t been able to reach the 10% free cash flow margin level even once between FY 2012 and FY 2021. The average over that time is 5.8% with the 5-year average at 6.0%.
Flowers has typically shown more free cash flow than net income with a 10-year average cash conversion ratio of 136% and a 5-year average of 153%.
Additionally, I want to see strong cash flow generation compared to a measure of assets or invested capital. The trend should also generally be higher over time.
FLO Free Cash Flow Returns (FLO SEC filings)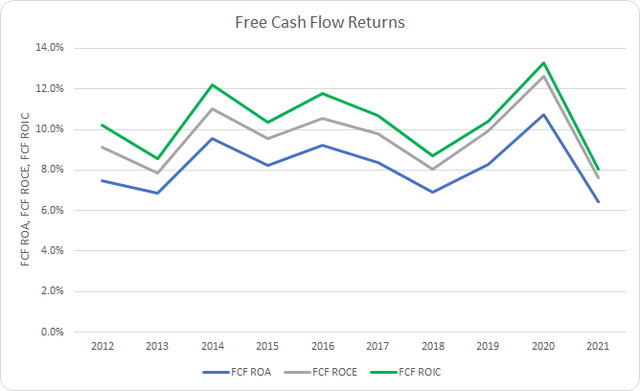
Flowers’ FCF ROIC has fluctuated a bit over the last decade; however, it’s generally hovered around the 10% level. The 10-year average FCF ROIC is 10.4% with the 5-year average at 10.2%.
To understand how Flowers uses its free cash flow I calculate three variations of the metric, defined below:
- Free Cash Flow, FCF: Operating cash flow less capital expenditures
- Free Cash Flow after Dividend, FCFaD: FCF less total cash dividend payments
- Free Cash Flow after Dividend and Buybacks, FCFaDB: FCFaD less net cash spent on share repurchases
FLO Free Cash Flows (FLO SEC filings)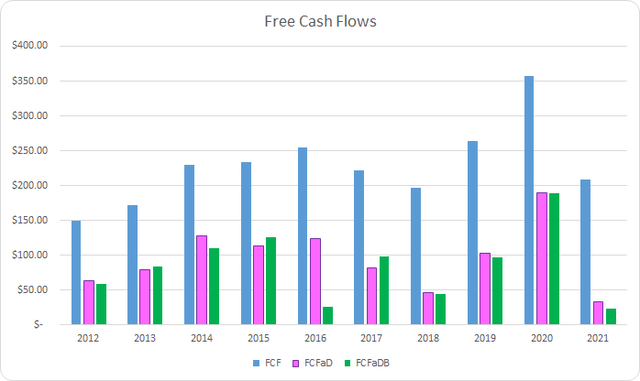
Between FY 2012 and FY 2021, Flowers generated a cumulative total of $2.29 B in FCF. With that FCF they returned a total of $1.33 B to shareholders through dividend payments which brings the cumulative FCFaD to $0.96 B.
Flowers has spent a net total of just $0.11 B on share buybacks over that same time. That puts the cumulative FCFaDB for the period at $0.85 B.
Flowers has not typically utilized share repurchases to return excess cash to shareholders opting instead for dividends. From FY 2012 through FY 2021 there’s only two years, FY 2016 and FY 2021, with significant differences between FCFaD and FCFaDB. Additionally, comparing the cumulative totals of dividends versus net repurchase spend shows that Flowers has used $12.50 on dividends for every $1.00 on net buybacks.
FLO Shares Outstanding (FLO SEC filings)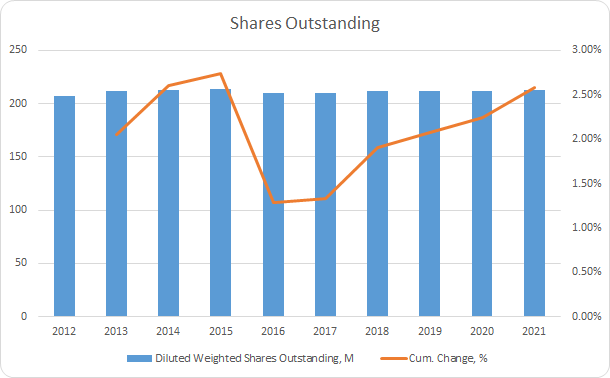
With fairly limited buyback spend, Flowers’ share count hasn’t really budged. In fact the share count has actually increased by 2.6% or 0.3% annualized between FY 2012 and FY 2021 due to both stock based compensation as well as acquisitions.
With the rise in interest rates throughout the year, balance sheet strength has risen in importance. Companies that are heavily levered or have large amounts of debt that comes due with elevated interest rates could be in for stark decrease in profits or cash flow should interest rates remain elevated compared to the recent past.
FLO Debt to Capitalization (FLO SEC filings)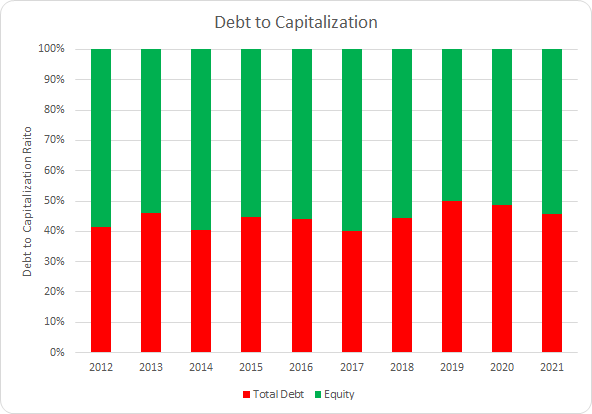
In terms of capital structure, Flowers has maintained fairly stable debt levels. The 10-year average debt-to-capitalization ratio for Flowers is 45% with the 5-year average at 46%.
Additionally I track the net debt ratios which looks at the total debt and obligations less cash compared to some measure of profits or cash flow. In reality most companies could not use all of their cash to reduce their debt load due to the need for short-term liquidity.
FLO Debt Ratios (FLO SEC filings)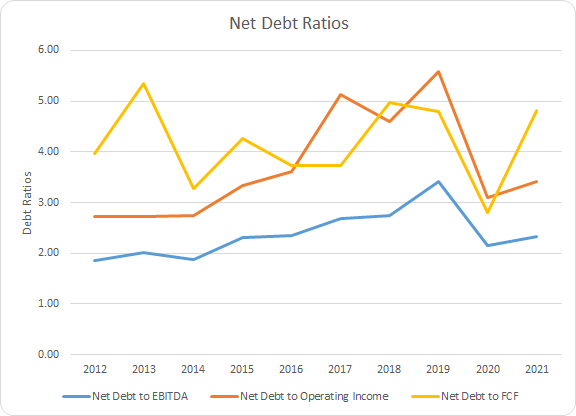
Flowers’ net debt ratios haven’t risen much over the last decade suggesting some prudence by management with expanding their leverage. The 10-year average net debt-to-EBITDA, net debt-operating income, and net debt-to-FCF levels are 2.4x, 3.7x, and 4.2x, respectively. Accordingly, the 5-year averages come to 2.7x, 4.2x, and 4.3x.
How Did We Get Here?
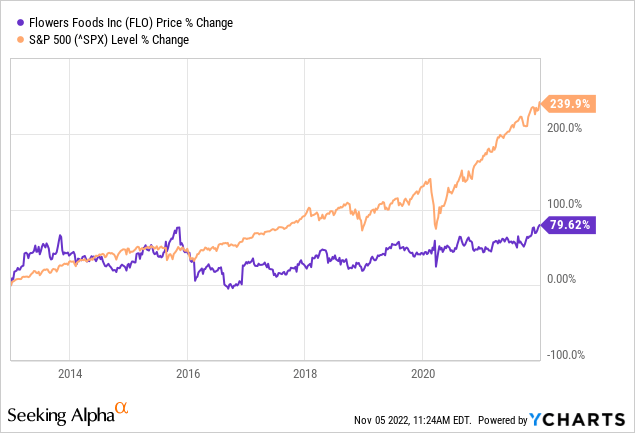
From the end of FY 2012 through the end of FY 2021 Flowers’ share price rose just 79.6% or around 6.0% annualized. Add in the dividend yield of 2.7% at the end of FY 2012 and the CAGR over that time is roughly 8.8% annualized. Meanwhile, the S&P 500 saw its share price rise by 239.9% over the same time frame or 14.6% annualized excluding dividends.
To try and distill down what the source of returns has been I attempt to breakdown the returns over that time into different categories. The categories I use are business returns, capital allocation returns, and sentiment change.
- Business Returns: Measured as annualized revenue growth rate plus annualized change in net profit margin
- Capital Allocation Returns: Measured as dividend yield plus annualized change in shares outstanding
- Sentiment Change: Measured as annualized change between starting and ending P/E multiple
During that period Flowers grew revenues by 42.2% in total which accounted for a +3.8% return contribution. Their net profit margin rose slightly from 4.5% to 4.8% or 6.6% in total which was an additional +0.7% annualized contribution to returns. In total the business returns over that time were just +4.4% annualized.
Meanwhile the share count rose by 2.6% which acted as a -0.3% headwind to the annualized returns. Combined with the 2.7% initial dividend yield puts the capital allocation return contribution at +2.5%.
For a company that showed relatively modest growth over that time Flowers’ multiple actually showed an increase from 23.3x to 28.4x. That’s a 21.6% total increase and contributed +1.9% to the return over that time.
| Annualized Returns | % of Returns | |
| Business Returns | 4.4% | 50% |
| Capital Allocation Returns | 2.5% | 28% |
| Sentiment Change | 1.9% | 21% |
| Total Annualized Returns | 8.8% |
Source: Author
Flowers’ modest returns were more than justified by business performance. The business returns accounted for right around 50% of the annualized returns with capital allocation making up an additional 28% for a combined justified return of 6.9%. Surprisingly enough given the modest growth from Flowers’ sentiment change accounted for roughly 21% of the annualized returns.
Looking forward returns don’t appear to be significantly better for the ensuing decade unless you expect significant improvement in revenue growth or margins. The initial dividend yield is higher and buybacks could very well be a tailwind going forward; however, I wouldn’t expect sentiment change to provide much if any return moving forward and more than likely will be a headwind on returns. Arguably, if interest rates remain around current levels Flowers should trade much cheaper than it currently does.
Valuation
When investing valuation also plays an important role in determining your returns. It’s not just about finding the best businesses because if they are valued at lofty levels the risk/reward just doesn’t make sense. Likewise on the other end of the growth spectrum where the lower the expected growth can’t bail you out of paying too much for an asset.
Dividend yield theory is a simple valuation method that is best suited for stable businesses that have a history of paying dividends to their owners. It’s a reversion to the mean based methodology that assumes over time investors will value a business such that it will offer roughly a normal dividend yield.
Flowers Foods Dividend Yield Theory (FLO Investor Relations and Google Finance)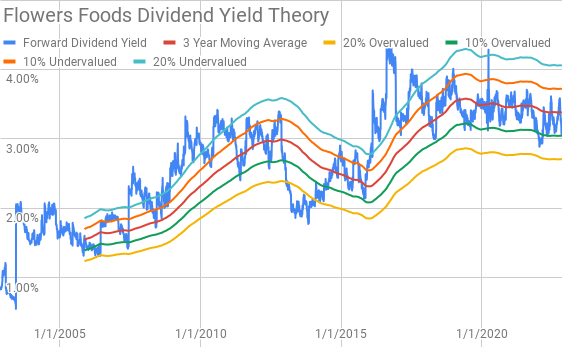
Since around early 2016, Flowers’ has typically offered a forward dividend yield between 3% and 4% with the yield bands representing fairly good indicators of either under- or over-valuation. The 3-year average forward dividend yield for Flowers is 3.38% while shares currently offer a dividend yield of 3.09% based on the current $0.22 per share per quarter payout.
A reverse discounted cash flow analysis can be used figure out what you need to believe the business is capable of generating in terms of growth and margins in order to produce the returns that justify purchasing at the current levels.
I use a simplified DCF model built on revenue growth, an initial free cash flow margin of 4.5% that improves to 6.0% across the forecast period and a terminal growth rate of 2.5%. For the discount rate I’ve used an estimated after-tax cost of debt of 2.6% with both a 10% and 8% cost of equity which yields a 8.8% and 7.1% discount rate, respectively.
Based on those assumptions Flowers needs to grow revenues at a 9.9% annualized rate through the forecast period in order to generate the cash flows that would support the current market valuation with a 10% cost of equity / 8.8% discount rate. In the 8% cost of equity scenario that still requires a 5.0% annual revenue growth rate to have the necessary free cash flows.
The MARR analysis entails estimating the future earnings and dividends that a company will generate. You then apply a reasonable expected terminal multiple at some future point in time and determine what the expected return would be. If the expected return is greater than your minimum threshold for investment then you can feel free to invest in the business.
Analysts expect Flowers to report FY 2022 EPS of $1.28 per share and FY 2023 EPS of $1.35 per share. They also expect Flowers to hit 3.2% annual EPS growth over the next 5 years. I then assumed that EPS growth would slow to 3.0% annually for the following 5 years. Dividends are assumed to target a 70% payout ratio.
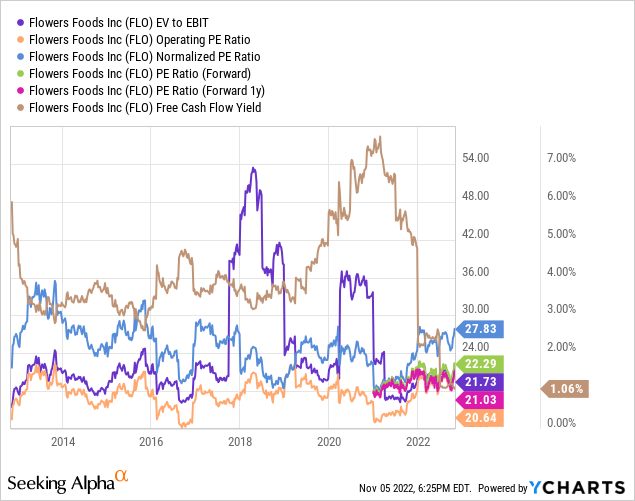
Over the last 10 years, Flowers has usually been valued between ~18x and ~30x TTM EPS. For the MARR analysis I’ll examine terminal multiples spanning that range.
The following table shows the potential internal rates of return that an investment in Flowers Foods could generate for investors provided the assumptions laid out above play out. Returns assume that Flowers continues to pay and raise dividends along the timeline they have normally followed and that dividends are taken cash. Returns also assume that shares are purchased at $28.52, Friday’s closing price.
| IRR | ||
| P/E Level | 5 Year | 10 Year |
| 30 | 12.8% | 9.4% |
| 25 | 9.1% | 7.7% |
| 22.5 | 7.1% | 6.8% |
| 20 | 4.9% | 5.7% |
| 17.5 | 2.4% | 4.6% |
| 15 | -0.3% | 3.3% |
Source: Author
Alternatively, I use the MARR analysis framework to reverse engineer the problem to determine what price I could pay for shares in order to generate the returns that I desire from my investments. My standard hurdle rate is a 10% IRR and for Flowers Foods I’ll also examine 12% and 8% return thresholds.
| Purchase Price Targets | ||||||
| 10% Return Target | 12% Return Target | 8% Return Target | ||||
| P/E Level | 5 Year | 10 Year | 5 Year | 10 Year | 5 Year | 10 Year |
| 30 | $32 | $27 | $30 | $23 | $35 | $32 |
| 25 | $28 | $24 | $25 | $21 | $30 | $28 |
| 22.5 | $25 | $22 | $23 | $19 | $28 | $26 |
| 20 | $23 | $21 | $21 | $18 | $25 | $24 |
| 17.5 | $21 | $19 | $19 | $16 | $22 | $22 |
| 15 | $18 | $17 | $17 | $15 | $20 | $20 |
Source: Author
Conclusion
Flowers is a good business, but one that I’d be quite hesitant to purchase at the current levels.
Dividend yield theory suggests a fair value range for Flowers between $23 and $29. At a current price of $28.52 shares are on the upper end of the fair value range.
The reverse DCF analysis also suggests that 10% returns are very unlikely unless you expect significant margin expansion which they’ve yet to show an ability to do. However, 8% returns do appear achievable with more modest growth expectations.
Although, the reverse DCF models don’t account for share repurchases which would lower the growth hurdle while improving per share returns for investors. Based on the 3-year average FCFaD that Flowers has shown and the current market capitalization around $6.0 B they could reduce the share count around 1.8%.
Meanwhile, the MARR analysis suggests that Flowers is quite expensive. With a 10% return target 5 years out and a 17.5x to 22.5x exit multiple, Flowers’ fair value range is $21 to $25. Lowering the return threshold to 8% only pushes the fair value range to $22 to $28 which still offers no margin of safety to even the upper end of fair value.
A rough estimate of the compounding rate of a company can be found using the change in invested capital over a period of time to find the reinvestment rate and ROIIC. Flowers’ estimated compounding rate is somewhere between 3-5% depending on whether you use net income or free cash flow.
Flowers is a stable business that should continue to do okay; however, the ROIIC estimate for Flowers over the last decade is just around 7-8%. That jives with the lack of expansion in their ROIC over that time as well especially given the pretty sizable reinvestment rate estimates between 40-50%.
Flowers has usually traded at a premium valuation compared to the market as a whole which is a bit surprising considering the low growth, albeit stable business. Unless or until Flowers is able to demonstrate better ROIIC’s, growth, or margins, Flowers’ should trade at lower multiples that the prior 10 years given the rise in interest rates.
A rough guide using the Graham Number for a fair multiple for Flowers says it should trade somewhere between 9x to 12x given the low growth expectations and competition from interest rates as an alternative.
Flowers offers a solid dividend yield greater than 3% which is supported by a solid business and should continue to inch higher over time; however, the valuation just makes very little sense to me at these levels. At best Flowers looks to be on the expensive side of fair value and at worse it’s significantly overvalued.



Be the first to comment