

Media Trading Ltd/iStock via Getty Images
It has been a busy earnings season, but so far, companies are beating analysts’ estimates by a bigger than expected percentage. According to FactSet’s Senior Earnings Analyst John Butters, Q2 2022’s reporting season has featured 73% of S&P 500 companies issuing better than expected quarterly earnings. Data-provider Wall Street Horizon notes that this week and next is the peak period for non-U.S. quarterly results.
The Heart of Worldwide Earnings Season
Wall Street Horizon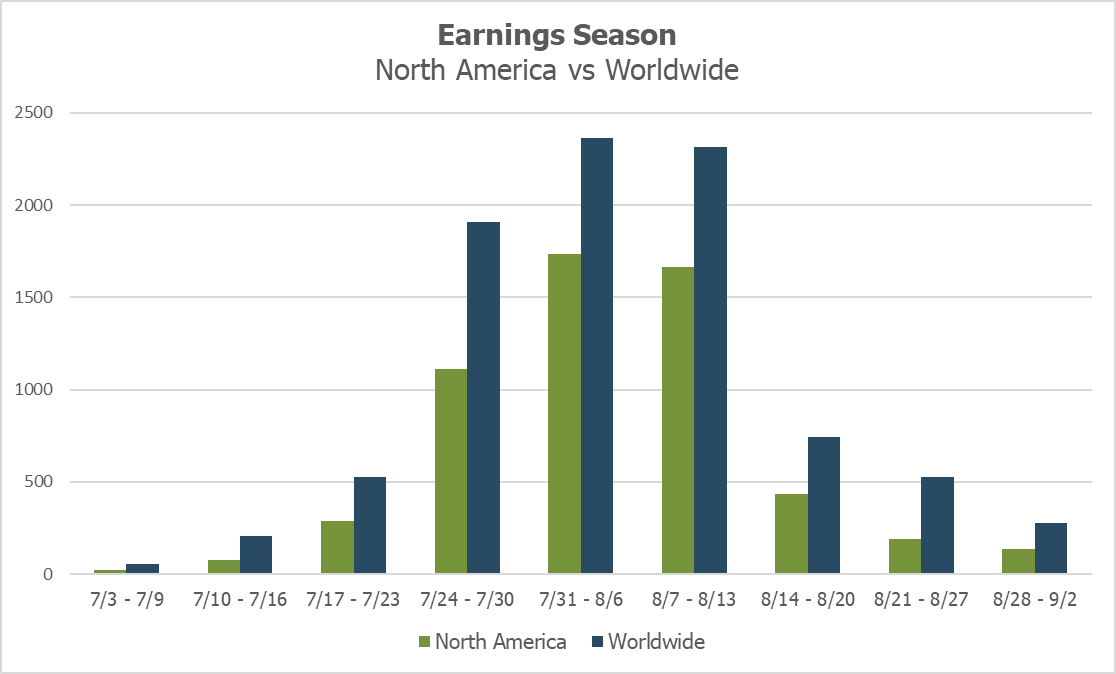
One foreign tech firm reported a strong quarter, but with some end markets seeing demand softness. It is a trend that many companies have commented on. After beating EPS results for Q1, and raising revenue guidance, Flex Ltd. (NASDAQ:FLEX) delivered a strong Q1 profit report. The company had sales above the high-end of its guidance range despite some challenging conditions with respect to sourcing electronic components. Still, its free cash flow was in the red.
According to Bank of America Global Research, FLEX is a global provider of vertically integrated supply chain services starting from PCB fabrication, design, engineering, and manufacturing services through after-sales support. The core business includes the Reliability Solutions and Agility Solutions segments.
The Singapore-based $8 billion market cap electronic equipment company within the Information Technology sector features an attractive P/E ratio of under 9 times last year’s earnings, according to The Wall Street Journal. The company beat earnings estimates last week, keeping up a positive earnings beat trend.
Analysts at BofA see EPS climbing at an impressive rate through 2025 – that high growth rate makes FLEX’s single-digit P/E ratio even more compelling. The company also trades at a very modest EV/EBITDA ratio, and its free cash flow yield is forecast to move higher in the coming quarters.
FLEX: Earnings, Valuation, Free Cash Flow Forecasts
BofA Global Research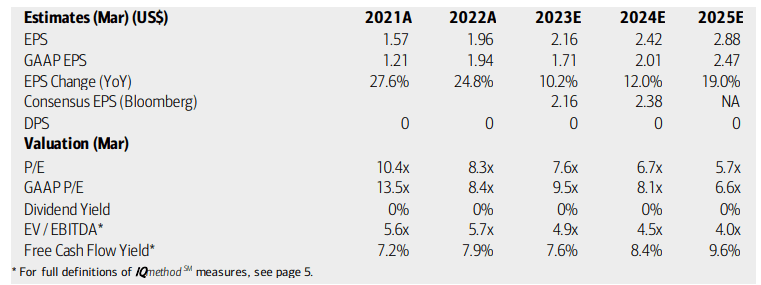
After reporting strong Q1 results, the stock rallied. Looking ahead, there’s a key shareholder meeting on the corporate event calendar (August 25), according to Wall Street Horizon. Its Q2 unconfirmed earnings date is October 26.
FLEX Corporate Event Calendar: Shareholder Meeting Aug 25
Wall Street Horizon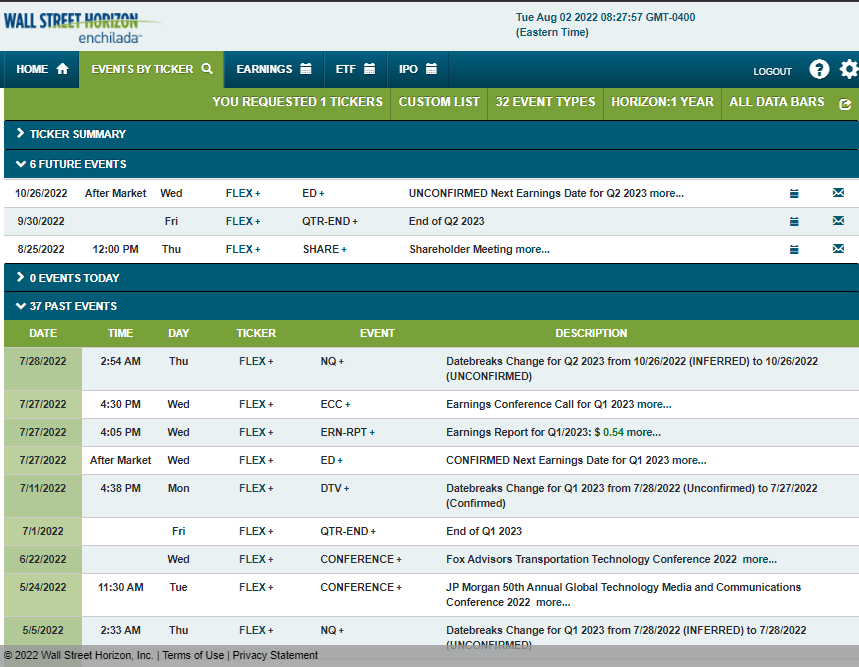
The Technical Take
I went long-term with this view. FLEX’s 20-year weekly chart shows clear resistance at $20, but recent price action suggests a breakout could be in the works. A bullish cup and handle pattern is unfolding. Shares peaked in the $19 to $20 range from early 2018 (when many foreign stocks climaxed) and in 2021. A pullback to under $14 – support from early 2020 – brought about buyers. Last week’s Q1 report helped continue the rebound. I would be a buyer of this stock on a close above $20. Investors can be long here with a stop under the July 5th low, too.
FLEX: Bullish Cup and Handle Pattern, $20 Resistance, $14 Support
StockCharts.com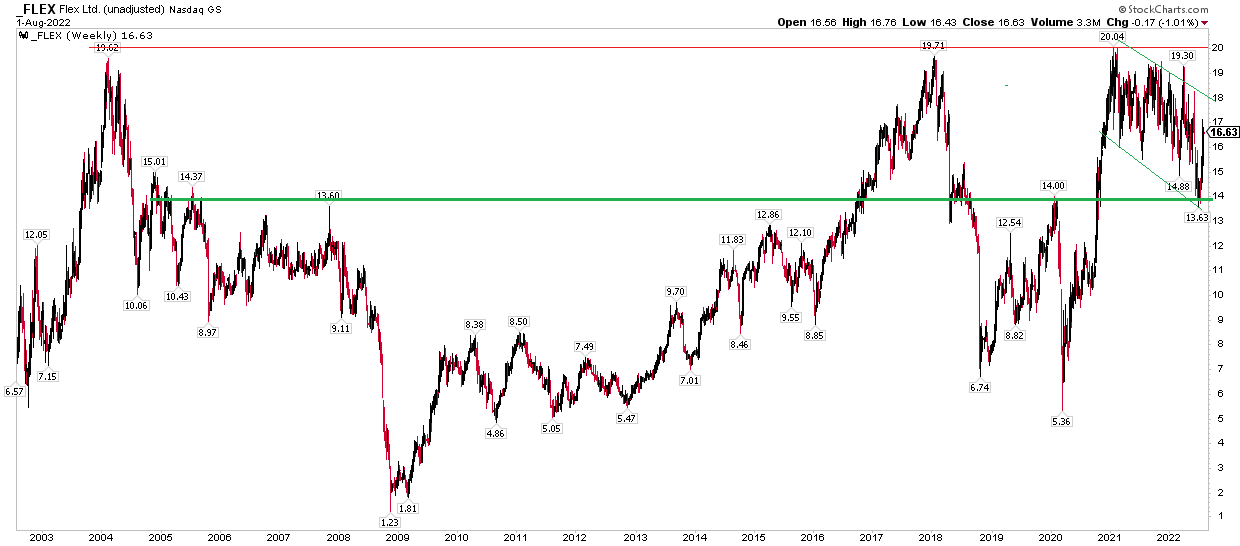
The Bottom Line
FLEX looks like a good value for long-term investors given its low earnings multiple and improving free cash flow yield. The firm has a robust earnings beat history. Its chart looks great above $20, but even at current levels, being long shares here with a stop under the July low makes sense.
Be the first to comment