

hapabapa
In this analysis of Fiserv, Inc. (NASDAQ:FISV), we examine the company as its YoY and YTD revenue growth for Q2 FY2022 was 12% and 11% respectively. Furthermore, management raised its 2022 organic revenue growth outlook from 9% to 11%, higher than our previous projection of 8.1%. We analyzed the top 10 Fintech companies based on revenue (‘TTM’) and compared it with Fiserv to examine how it performed relative to the top Fintech companies. Furthermore, we analyzed its segment breakdown to identify which segments drove its growth and projected its revenue growth.
Fiserv Outperformed Fintech Industry Growth
To analyze and compare how Fiserv performed compared to its competitors, we compiled the revenue growth of the top 10 largest Fintech companies based on their TTM revenues in Q2 2022. We also compared the difference between their actual revenue growth and analyst revenue consensus as well as the stock price change of each company in Q2 2022.
|
Company |
Revenue Growth YoY % (Q2 2022) |
Revenue Growth QoQ % (Q2 2022) |
% Analyst Revenue Difference (Q2 2022) |
Stock Price Change |
TTM Revenue ($ mln) |
Type |
|
American Express (AXP) |
30.8% |
14.1% |
6.4% |
-25.4% |
47,964 |
Card Network |
|
Visa (V) |
18.7% |
1.2% |
2.9% |
-10.0% |
28,082 |
Card Network |
|
PayPal Holdings (PYPL) |
9.1% |
5.0% |
0.4% |
-38.2% |
26,389 |
Payment Facilitators |
|
Mastercard (MA) |
21.4% |
6.4% |
4.4% |
-9.7% |
20,865 |
Card Network |
|
Fiserv |
9.8% |
7.5% |
8.8% |
-10.4% |
17,008 |
Merchant Acquiring |
|
Block Inc (SQ) |
-5.9% |
11.2% |
1.6% |
-52.9% |
16,288 |
Payment Processor |
|
FIS (FIS) |
7.0% |
6.5% |
1.3% |
-5.8% |
14,388 |
Merchant Acquiring |
|
Intuit Inc (INTU) |
-5.7% |
-57.1% |
3.3% |
-19.0% |
12,726 |
Financial & Accounting Software |
|
Lufax Holding (LU) |
-0.6% |
-16.5% |
-3.5% |
10.1% |
10,847 |
Online Lending |
|
Global Payments (GPN) |
6.7% |
5.8% |
8.4% |
-17.6% |
8,834 |
Merchant Acquiring |
|
Average |
9.1% |
-1.6% |
3.4% |
-17.9% |
Source: Seeking Alpha, Company Data, Khaveen Investments
As seen above, the majority of Fintech companies have better than expected revenues for Q2 2022, beating estimates by an average of 3.4%. The merchant acquiring companies have beaten analysts’ estimates by the greatest margin of 6.2%. Merchant-acquiring businesses experienced the second-highest QoQ growth out of all other Fintech businesses, with an average of 6.6%. According to McKinsey & Company, the long-term trends of merchant acquiring include the…
…proliferation of payment methods, including real-time payments; omnichannel (online and offline) customer journeys; a tendency for companies to grow internationally; and a flourishing SME (small and medium-size enterprise) ecosystem.
For card issuers, according to eMarketer…
…record inflation may have augmented Q2’s volume growth – higher prices mean more spending on a dollar-for-dollar basis
Thus, we believe this is the reason card network companies experienced the highest YoY revenue growth with an average of 23.6%. American Express had the greatest revenue growth both YoY and QoQ due to “record card member spending driven by robust travel and entertainment rebound”. Visa cited “growth in payments volume, cross-border volume and processed transactions” whereas Mastercard attributed it to “robust overall consumer spending and cross-border volume growing 58% versus a year ago”, as card network companies continue to have strong growth.
Intuit had the largest QoQ drop due to the seasonality of its revenues. Their Consumer segment and ProConnect segment, which make up 31% and 4% respectively, provide services to enable customers to prepare and file their tax returns which are due in April. Since its Q3 FY2022 ended on 30 April, this resulted in a sharp decline in QoQ revenue compared to Q4 FY2022.
Furthermore, the QoQ revenue decline for Lufax can be attributed to a “decrease in new loans facilitated by 15.2%” and “a COVID-19 resurgence severely impacting its core client base of small business owners”.
For the overall Fintech industry, we believe the stock price decline does not justify its positive growth over the past year (9.1%) and QoQ growth of 4.6% (excluding Intuit). We believe the top Fintech companies which surpassed analyst revenue consensus by an average of 3.4% indicate a positive surprise in the industry. Moreover, we believe Fiserv’s 10.4% stock decline does not reflect its positive YoY and QoQ growth, as well as its 8.8% beat in revenue estimates.
Core Banking and Card Services Segments Underperforming
Nilson Report, Khaveen Investments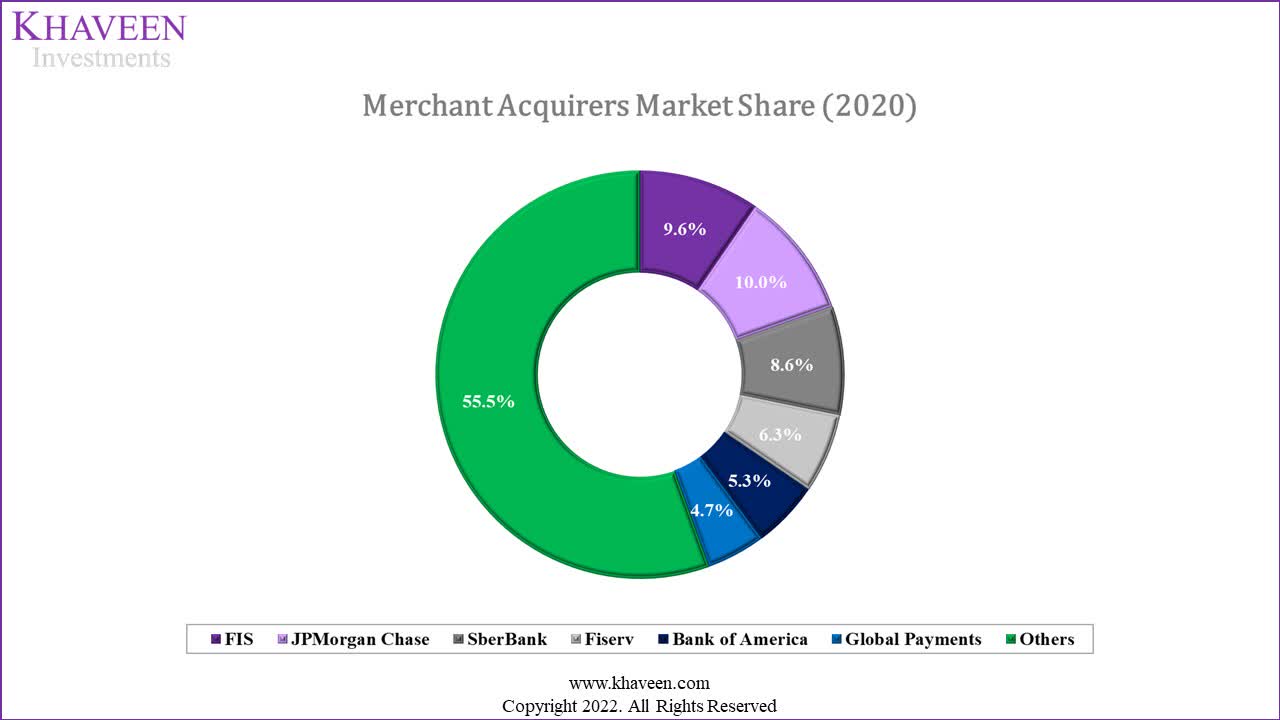
Based on the market share above, Fiserv is the 4th after JPMorgan Chase (JPM), FIS and Sberbank (OTC:AKSJF) according to Nilson Report. We investigated the company’s segment breakdown (Acceptance, Fintech, Payments) to identify which segment was its key growth driver.
|
Revenue Breakdown by Business Segment ($ mln) |
Q3 2020 |
Q4 2020 |
Q1 2021 |
Q2 2021 |
Q3 2021 |
Q4 2021 |
Q1 2022 |
Q2 2022 |
10-quarter Average |
|
Acceptance (Merchant acquiring) |
1,454 |
1,444 |
1,397 |
1,666 |
1,716 |
1,700 |
1,653 |
1,901 |
|
|
Growth % |
18.9% |
-0.7% |
-3.3% |
19.3% |
3.0% |
-0.9% |
-2.8% |
15.0% |
2.6% |
|
Fintech (Core banking software) |
727 |
742 |
736 |
754 |
761 |
771 |
778 |
803 |
|
|
Growth % |
1.8% |
2.1% |
-0.8% |
2.4% |
0.9% |
1.3% |
0.9% |
3.2% |
0.7% |
|
Payments (Card services) |
1,387 |
1,411 |
1,405 |
1,421 |
1,471 |
1,536 |
1,462 |
1,518 |
|
|
Growth % |
5.1% |
1.7% |
-0.4% |
1.1% |
3.5% |
4.4% |
-4.8% |
3.8% |
0.6% |
|
Corporate and Other |
218 |
235 |
217 |
210 |
215 |
250 |
245 |
228 |
|
|
Growth % |
4.8% |
7.8% |
-7.7% |
-3.2% |
2.4% |
16.3% |
-2.0% |
-6.9% |
-1.9% |
|
Total Revenue |
3,786 |
3,832 |
3,755 |
4,051 |
4,163 |
4,257 |
4,138 |
4,450 |
|
|
Growth % |
9.3% |
1.2% |
-2.0% |
7.9% |
2.8% |
2.3% |
-2.8% |
7.5% |
1.1% |
Source: Fiserv, Khaveen Investments
From the table above, the Acceptance segment has the highest QoQ growth of 2.6%, followed by Fintech (0.7%) and Payments (0.6%). The Acceptance segment has grown to make up almost 40% of Fiserv’s revenue while other segments have a decreasing share of total revenue, further highlighting the significance of the segment.
Management did not give a total revenue CAGR for the medium term but has highlighted that it is on track to achieve its 9% to 11% revenue growth for 2022, due to a strong QoQ organic revenue growth of 12%.
Based on the investor presentation on the Acceptance segment. Management projected it to grow at a CAGR of 11.5% till 2025, with its revenues reaching approximately $10 bln. On a YoY basis, however, Fintech and Payments growth are roughly in line with the medium-term management estimates of 4% to 6% and 5% to 8% respectively.
|
Fiserv Segments |
2021 (Actual) |
2022 (Our Previous Forecast) |
2022 Management Guidance |
|
Fintech |
4.2% |
7.5% |
4% to 6% |
|
Payments |
6.0% |
7.5% |
5% to 8% |
|
Acceptance |
7.0% |
7.8% |
11.5% |
Source: Fiserv, Khaveen Investments
In our previous research on Fiserv, the market CAGR estimates that we used (7.5% and 7.8%) for the Fintech and Payments segments were higher than the actual 2021 growth of 4.2% and 6.0% respectively. Its Fintech segment has underperformed while Payments were in line with management guidance. Also, management guidance for the Acceptance segment is higher than our previous forecast of 7.8% due to growth in Clover and Carat.
In addition, as covered previously, we expected revenue synergies of $600 mln to be realized only in 2024. However, in the latest earnings briefing, management highlighted that…
…it attained $180 mln of actioned revenue synergies in the quarter, reaching $700 mln since the merger, exceeding the increased commitment of $600 mln 2 years ahead of its original commitment.
|
Revenue Breakdown by Business Segment ($ mln) |
2018 |
2019 |
2020 |
2021 |
2022F |
2023F |
2024F |
2025F |
|
Fintech (Core Banking Software) |
2,917 |
2,942 |
2,901 |
3,022 |
3,207 |
3,371 |
3,545 |
3,727 |
|
Growth % |
0.9% |
-1.4% |
4.2% |
6.1% |
5.1% |
5.1% |
5.1% |
|
|
Payments (Card Services) |
2,408 |
3,909 |
5,504 |
5,833 |
6,216 |
6,606 |
7,021 |
7,461 |
|
Growth % |
62.3% |
40.8% |
6.0% |
6.6% |
6.3% |
6.3% |
6.3% |
Source: Fiserv, Khaveen Investments
Subsequently, we forecasted 2022 revenues for Fintech and Payments based on the average increase in revenues between 1H and 2H for 2020 and 2021. We projected 2022 to have a 6.1% and 6.6% growth over 2021 revenues for Fintech and Payments segments. The slight increase in our 2022 Fintech segment growth of 6.1% is due to its recent acquisition of Finxact which contributed about $20 to $25 mln in revenue. Excluding the acquisition, its YoY growth would be 5.3%.
For our medium-term projection, we used 2021 to 2022 average segment CAGRs of 5.1% and 6.3% of the Fintech and Payment segments, and project total revenues of Fintech and Payments to be $3.7 bln and $7.5 bln respectively. Despite the revenue growth of Fintech and Payments being in line with management’s medium-term estimates, these segments are slightly underperforming compared to its Acceptance segment.
SMBs are the Main Driver of Merchant Acquiring Growth
For the Merchant Acceptance segment, Fiserv has two main operating systems: Clover and Carat. Both are integrated commerce operating systems serving 2 types of customers which are SMBs and Enterprises respectively. Clover is a
leading point-of-sale (‘POS’) and business management system.
Whereas Carat is an
omnichannel commerce operating system that securely delivers payment opportunities for large enterprises across most popular channels and devices.
Clover had a 27.0% YoY growth from 2019 to 2021, bringing in a total of $1.33 bln in revenues for Fiserv, which is about 20.5% of the Acceptance segment revenue. From Fiserv’s Acceptance segment presentation, Clover is projected to reach $3.5 bln in revenue by 2025.
|
Clover Revenue Projections |
2019 |
2020 |
2021 |
2022F |
2023F |
2024F |
2025F |
|
Merchants (‘000s) (‘a’) |
419 |
467 |
560 |
648 |
749 |
867 |
1,003 |
|
Growth % |
11.5% |
19.9% |
15.7% |
15.7% |
15.7% |
15.7% |
|
|
Revenue/Merchant (‘b’) |
1,964 |
2,176 |
2,371 |
2,606 |
2,863 |
3,146 |
3,457 |
|
Growth % |
10.8% |
9.0% |
9.9% |
9.9% |
9.9% |
9.9% |
|
|
Revenue ($ mln) (‘c’) |
823 |
1,016 |
1,328 |
1,688 |
2,146 |
2,728 |
3,467 |
|
Growth % |
27.0% |
27.0% |
27.1% |
27.1% |
27.1% |
27.1% |
* c = a × b
Source: Fiserv, Khaveen Investments
We projected the total revenues Clover would contribute to Fiserv by calculating the revenue per merchant from 2019 to 2021 and based our projection on its average growth of 9.9%. Also, we forecasted the increase in merchants at an average growth of 15.7%. With the number of merchants forecasted to reach 1 mln and revenue per merchant of $3,457, this would lead us to our estimate of $3.47 bln in revenues for Clover by 2025.
|
Carat Revenue Projections ($ mln) |
2019 |
2020 |
2021 |
2022F |
2023F |
2024F |
2025F |
|
Omni / eCommerce |
304 |
369 |
448 |
544 |
660 |
801 |
973 |
|
Growth % |
21.4% |
21.4% |
21.4% |
21.4% |
21.4% |
21.4% |
|
|
Physical point-of-sale |
587 |
626 |
667 |
711 |
758 |
808 |
861 |
|
Growth % |
6.6% |
6.6% |
6.6% |
6.6% |
6.6% |
6.6% |
|
|
Revenue |
891 |
995 |
1,115 |
1,255 |
1,418 |
1,609 |
1,834 |
|
Growth % |
12.0% |
12.0% |
12.5% |
13.0% |
13.5% |
14.0% |
Source: Fiserv, Khaveen Investments
For Carat, we projected its growth based on the past CAGRs of both its Omni / eCommerce and physical point-of-sale segments, which is 21.4% and 6.6% respectively. From there, we then projected Carat’s total revenue to be $1.83 bln by 2025.
|
Merchant Acquiring Segment ($ mln) |
2019 |
2020 |
2021 |
2022F |
2023F |
2024F |
2025F |
|
Clover |
823 |
1,016 |
1,328 |
1,688 |
2,146 |
2,728 |
3,467 |
|
Growth % |
23.5% |
30.7% |
27.1% |
27.1% |
27.1% |
27.1% |
|
|
Carat |
891 |
995 |
1,115 |
1,255 |
1,418 |
1,609 |
1,834 |
|
Growth % |
11.6% |
12.1% |
12.5% |
13.0% |
13.5% |
14.0% |
|
|
Other Merchant Acceptance |
3,988 |
4,044 |
4,036 |
4,371 |
4,734 |
5,127 |
5,552 |
|
Growth % |
1.4% |
-0.2% |
8.3% |
8.3% |
8.3% |
8.3% |
|
|
Total Revenue |
5,702 |
6,055 |
6,479 |
7,314 |
8,298 |
9,464 |
10,854 |
|
Growth % |
6.2% |
7.0% |
12.9% |
13.5% |
14.1% |
14.7% |
Source: Fiserv, Research and Markets, Khaveen Investments
With reference to our revenue projections for Clover and Carat, along with using a market CAGR of 8.3% for other merchant acceptance revenue, we estimate that the total revenue of the Merchant Acceptance segment of Fiserv would reach $10.9 bln by 2025. This is slightly above management estimates of $10 bln.
All in all, we expect its Merchant Acceptance segment to continue being a huge revenue driver for Fiserv as we project it to grow at an average of 13.8% and bring in around $10.9 bln of revenues by 2025. This is because of Clover and Carat, where we have projected average revenue growth of 27.1% and 13.3% respectively.
Risk: High Net Debt
|
Net Debt ($ mln) |
2015 |
2016 |
2017 |
2018 |
2019 |
2020 |
2021 |
TTM |
|
Debt |
6,606 |
7,092 |
7,478 |
8,842 |
42,290 |
40,853 |
43,706 |
44,697 |
|
Cash & Cash Equivalents |
275 |
300 |
325 |
415 |
893 |
906 |
835 |
3,055 |
|
Net Debt |
6,331 |
6,792 |
7,153 |
8,427 |
41,397 |
39,947 |
42,871 |
41,642 |
|
Cash to Debt Ratio |
0.04x |
0.04x |
0.04x |
0.05x |
0.02x |
0.02x |
0.02x |
0.07x |
Source: Fiserv, Khaveen Investments
Since the acquisition of First Data in 2019, Fiserv’s net debt has been around $40 bln. Net debt as a % of market cap has also increased to an average of 68.3% in the past 3 years. We believe this could impact its opportunity to carry out more acquisitions in the future to sustain its growth.
Fiserv, Khaveen Investments
Besides its high net debt, we believe another risk to the company is macroeconomic headwinds. According to McKinsey, global trade flows are expected to slow following the recovery in 2021 due to “muted global economic forecasts” and cited geopolitical risks affecting trade flows in Eastern Europe in 2022 with a 4% decline projection. Fiserv’s management has also acknowledged the market growth headwinds on the potential impact on the company’s revenue in 2022 as explained in the quote below from its latest earnings briefing.
The low end of this revised growth outlook assumes a macro slowdown in the second half versus the first half of the year. – Frank Bisignano, Chairman, President and Chief Executive Officer
Furthermore, Fiserv’s management stated that its merchant-acquiring business segment could be impacted more compared to its core banking software and card services segments. Thus, as we believe its merchant-acquiring business segment to be its key growth driver, global macroeconomic headwinds could have an impact on the company’s growth outlook.
I think if you look at the three segments kind of in order of what might see impact in a meaningful downturn, merchant first, followed by payments followed by fintech overall. – Bob Hau, Chief Financial Officer
Verdict
|
Revenue Breakdown by Business Segment ($ mln) |
2018 |
2019 |
2020 |
2021 |
2022F |
2023F |
2024F |
2025F |
|
Acceptance (Merchant Acquiring) |
– |
2,571 |
5,522 |
6,479 |
7,314 |
8,298 |
9,464 |
10,854 |
|
Growth % |
115% |
17.3% |
12.9% |
13.5% |
14.1% |
14.7% |
||
|
Fintech (Core Banking Software) |
2,917 |
2,942 |
2,901 |
3,022 |
3,207 |
3,371 |
3,545 |
3,727 |
|
Growth % |
0.9% |
-1.4% |
4.2% |
6.1% |
5.1% |
5.1% |
5.1% |
|
|
Payments (Card Services) |
2,408 |
3,909 |
5,504 |
5,833 |
6,216 |
6,606 |
7,021 |
7,461 |
|
Growth % |
62.3% |
40.8% |
6.0% |
6.6% |
6.3% |
6.3% |
6.3% |
|
|
Corporate and Other |
498 |
765 |
925 |
892 |
914 |
909 |
904 |
899 |
|
Growth % |
53.6% |
20.9% |
-3.6% |
2.5% |
-0.5% |
-0.5% |
-0.5% |
|
|
Total Revenue |
5,823 |
10,187 |
14,852 |
16,226 |
17,651 |
19,185 |
20,934 |
22,941 |
|
Growth % |
74.9% |
45.8% |
9.3% |
8.8% |
8.7% |
9.1% |
9.6% |
Source: Fiserv, Khaveen Investments
From our projections, we projected its total revenue has an average growth of 9.0% and is expected to reach $22.9 bln by 2025.
Seeking Alpha, Khaveen Investments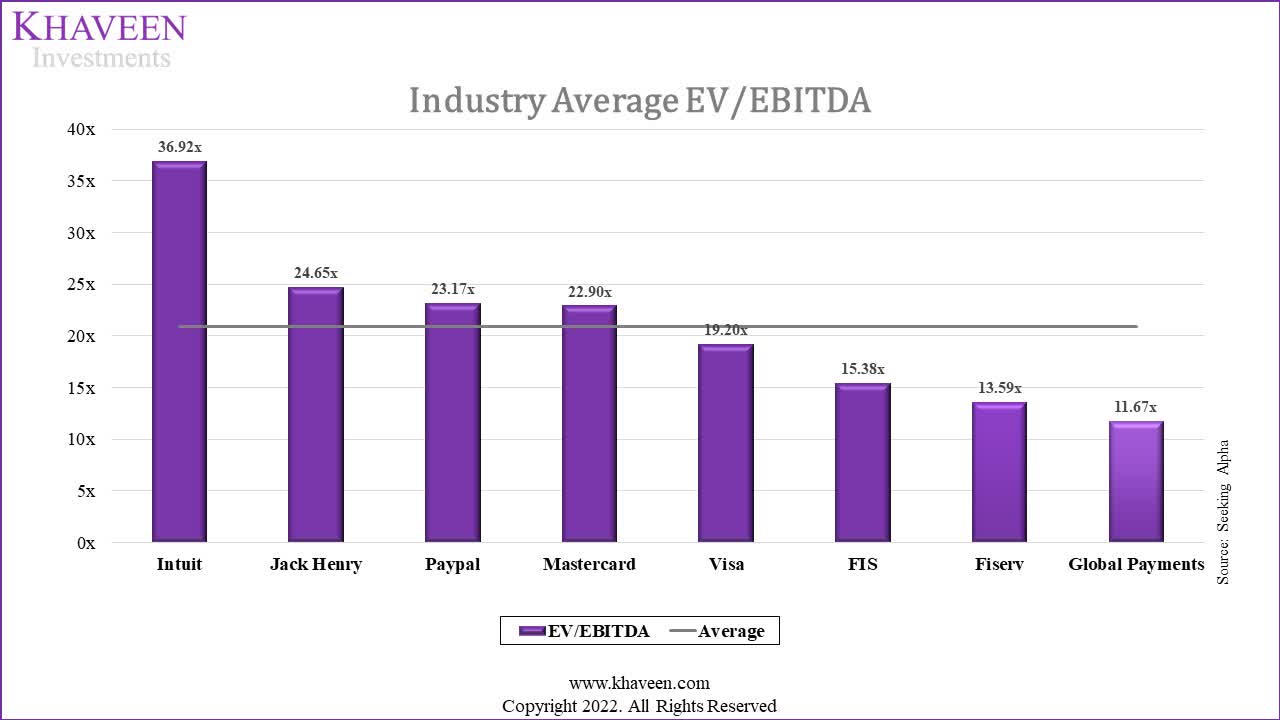
We have analyzed the EV/EBITDA of the Fintech industry based on the top Fintech companies (excluding Lufax) by revenue with an average EV/EBITDA of 20.94x.
Khaveen Investments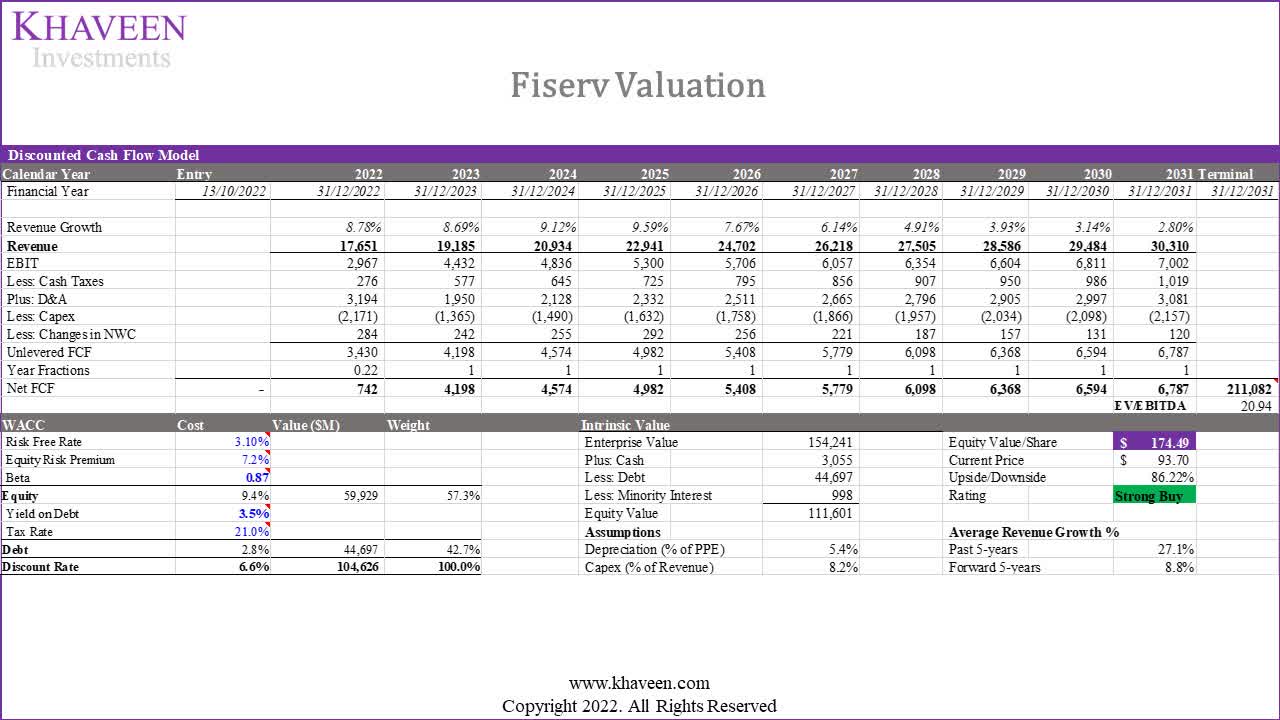
Based on a lower discount rate of 6.6% (company’s WACC) compared to 8.3% previously and an EV/EBITDA of 20.94x, our model shows an upside of 86.22%.
All in all, as the Fintech industry’s top companies, had positive growth over the past year (9.1%) and QoQ growth of 4.6% (excluding Intuit), we believe Fiserv’s stock decline of 10.4% does not reflect its positive YoY and QoQ growth, as well as its 8.8% beat in analyst revenue estimates. For its core banking software and card services segments, we forecasted it to have a 5.1% and 6.3% average growth through 2025. Though, we projected Fiserv’s total revenue to reach $22.9 bln by 2025, driven mainly by its acceptance segment growing at a CAGR of around 13%.
Thus, as we projected Fiserv’s total revenue growth at a 5-year average of 8.8%, which is higher compared to our previous projection at a 5-year average of 8.3%, as well as a lower discount rate of 6.6% compared to 8.3% previously, we obtained a higher price target of $174.49, with an upside of 86.22% and thus maintain our Strong Buy rating for the company.
Be the first to comment