

enviromantic/E+ via Getty Images
This monthly article series shows a dashboard with aggregate industry metrics in materials. It is also a review of sector ETFs like the Materials Select Sector SPDR ETF (XLB) and the First Trust Materials AlphaDEX Fund (NYSEARCA:FXZ), whose largest holdings are used to calculate these metrics.
Shortcut
The next two paragraphs in italic describe the dashboard methodology. They are necessary for new readers to understand the metrics. If you are used to this series or if you are short of time, you can skip them and go to the charts.
Base Metrics
I calculate the median value of five fundamental ratios for each industry: Earnings Yield (“EY”), Sales Yield (“SY”), Free Cash Flow Yield (“FY”), Return on Equity (“ROE”), Gross Margin (“GM”). The reference universe includes large companies in the U.S. stock market. The five base metrics are calculated on trailing 12 months. For all of them, higher is better. EY, SY and FY are medians of the inverse of Price/Earnings, Price/Sales and Price/Free Cash Flow. They are better for statistical studies than price-to-something ratios, which are unusable or non available when the “something” is close to zero or negative (for example, companies with negative earnings). I also look at two momentum metrics for each group: the median monthly return (RetM) and the median annual return (RetY).
I prefer medians to averages because a median splits a set in a good half and a bad half. A capital-weighted average is skewed by extreme values and the largest companies. My metrics are designed for stock-picking rather than index investing.
Value and Quality Scores
I calculate historical baselines for all metrics. They are noted respectively EYh, SYh, FYh, ROEh, GMh, and they are calculated as the averages on a look-back period of 11 years. For example, the value of EYh for packaging in the table below is the 11-year average of the median Earnings Yield in packaging companies.
The Value Score (“VS”) is defined as the average difference in % between the three valuation ratios (EY, SY, FY) and their baselines (EYh, SYh, FYh). The same way, the Quality Score (“QS”) is the average difference between the two quality ratios (ROE, GM) and their baselines (ROEh, GMh).
The scores are in percentage points. VS may be interpreted as the percentage of undervaluation or overvaluation relative to the baseline (positive is good, negative is bad). This interpretation must be taken with caution: the baseline is an arbitrary reference, not a supposed fair value. The formula assumes that the three valuation metrics are of equal importance.
Current data
The next table shows the metrics and scores as of last week’s closing. Columns stand for all the data named and defined above.
|
VS |
QS |
EY |
SY |
FY |
ROE |
GM |
EYh |
SYh |
FYh |
ROEh |
GMh |
RetM |
RetY |
|
|
Chemicals |
4.83 |
-5.62 |
0.0485 |
0.4657 |
0.0230 |
17.08 |
39.96 |
0.0438 |
0.4607 |
0.0224 |
17.94 |
42.70 |
-10.68% |
-11.35% |
|
Constr. Materials |
39.35 |
49.74 |
0.0568 |
1.0479 |
0.0320 |
19.13 |
29.51 |
0.0275 |
0.9034 |
0.0335 |
9.76 |
28.53 |
-12.30% |
-18.67% |
|
Packaging |
-4.30 |
12.78 |
0.0597 |
1.1045 |
0.0214 |
23.18 |
23.68 |
0.0476 |
1.0606 |
0.0372 |
17.60 |
25.23 |
-7.40% |
-15.27% |
|
Mining/Metals |
8.89 |
98.43 |
0.0907 |
1.4336 |
-0.0056 |
23.30 |
24.28 |
0.0397 |
1.1625 |
0.0223 |
8.37 |
20.48 |
-7.42% |
-6.43% |
Value and Quality chart
The next chart plots the Value and Quality Scores by industry (higher is better).
Value and quality in materials (Chart: author; data: Portfolio123)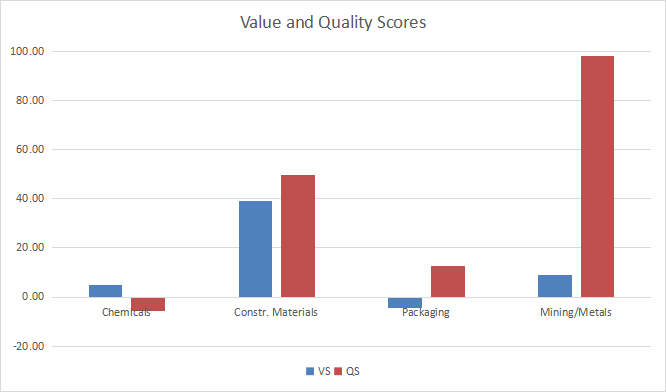
Evolution since last month
The value score has significantly improved across the sector except in mining/metals.
Score variations (Chart: author; data: Portfolio123)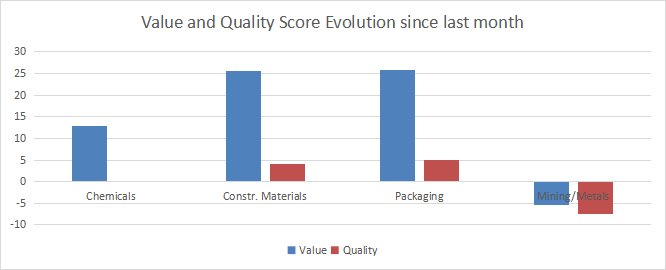
Momentum
The next chart plots momentum data.
Momentum in Materials (Chart: author; data: Portfolio123)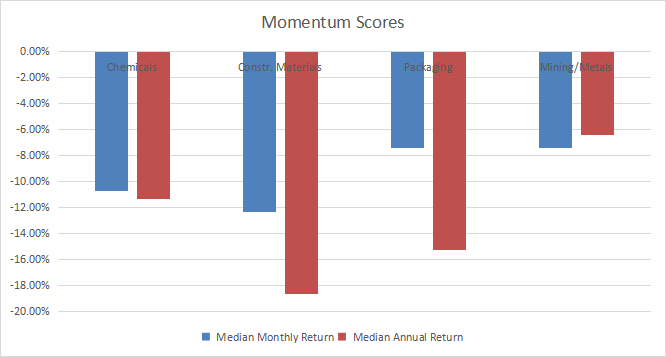
Interpretation
The most attractive materials industries are construction materials and mining/metals. Both subsectors have excellent quality scores. Construction materials are undervalued by 39% relative to 11-year averages. Chemicals and packaging are close to the historical baseline in value and quality.
Fast facts on FXZ
The First Trust Materials AlphaDEX Fund has been tracking the StrataQuant® Materials Index since 5/8/2007. Its total expense ratio is higher than XLB (0.64% vs. 0.12%). The underlying index selects and weights stocks belonging to the materials sector and the Russell 1000 index based on a proprietary ranking system oriented to growth and value (more details on FirstTrust website).
The fund has 37 holdings with weights between 0.55% and 5.40%. The next table shows the top 10 holdings, representing 45.6% of asset value. It is more balanced than XLB, where the top 10 names weigh about 62%. Exposure to the top holding is much lower than in XLB (5.40% vs 17%).
|
Ticker |
Name |
Weight |
EPS growth %TTM |
P/E TTM |
P/E fwd |
Yield% |
|
Sylvamo Corp. |
5.40% |
N/A |
N/A |
4.63 |
1.16 |
|
|
Reliance Steel & Aluminum Co. |
5.36% |
194.96 |
6.49 |
5.93 |
2.06 |
|
|
Steel Dynamics Inc. |
4.98% |
417.54 |
3.71 |
3.54 |
1.89 |
|
|
Westlake Corp. |
4.65% |
491.99 |
5.09 |
4.58 |
1.20 |
|
|
Nucor Corp. |
4.43% |
418.41 |
4.08 |
4.31 |
1.75 |
|
|
Huntsman Corp. |
4.36% |
183.43 |
5.24 |
6.46 |
3.00 |
|
|
Olin Corp. |
4.26% |
316.47 |
5.40 |
4.88 |
1.66 |
|
|
LyondellBasell Industries |
4.22% |
150.50 |
5.11 |
5.34 |
5.30 |
|
|
Dow Inc. |
3.97% |
249.44 |
5.97 |
6.79 |
5.11 |
|
|
Celanese Corp. |
3.96% |
4.24 |
6.54 |
6.86 |
2.22 |
Ratios from Portfolio123
FXZ has outperformed XLB since inception by 2.28 percentage points in annualized return (see next table). The risk is higher measured in volatility and drawdown, but FXZ also beats XLB in risk-adjusted performance (Sharpe ratio).
|
Total return |
Annualized return |
Max Drawdown |
Sharpe ratio |
Volatility |
|
|
FXZ |
261.33% |
8.88% |
-65.38% |
0.49 |
25.12% |
|
XLB |
162.38% |
6.60% |
-59.66% |
0.42 |
21.15% |
Data calculated with Portfolio123
In summary, FXZ is a good product for investors seeking an exposure in basic materials oriented to growth and value, with a better balance than XLB across holdings. It currently holds 37 stocks including large and mid-caps, whereas XLB invests in 30 large companies. FXZ is more expensive than XLB in management fees, which is justified by outperformance since 2007. XLB has much higher trading volumes, which makes it a better instrument for trading and tactical allocation.
Dashboard List
I use the first table to calculate value and quality scores. It may also be used in a stock-picking process to check how companies stand among their peers. For example, the EY column tells us that a chemical company with an Earnings Yield above 0.0485 (or price/earnings below 20.62) is in the better half of the industry regarding this metric. A Dashboard List is sent every month to Quantitative Risk & Value subscribers with the most profitable companies standing in the better half among their peers regarding the three valuation metrics at the same time. The list below was sent to subscribers several weeks ago based on data available at this time.
|
United States Steel Corp. |
|
|
Cleveland-Cliffs Inc. |
|
|
LyondellBasell Industries NV |
|
|
Dow Inc. |
|
|
Freeport-McMoRan Inc. |
|
|
Veritiv Corp. |
|
|
UFP Industries Inc. |
|
|
Chemours Co. |
|
|
O-I Glass Inc. |
It is a dynamic, monthly list with a statistical bias toward excess returns on the long-term, not the result of an analysis of each stock.
Be the first to comment