

William_Potter/iStock via Getty Images
(This article was co-produced with Hoya Capital Real Estate)
Introduction
MFS Investment Management, the managers of the MFS Special Value Trust (NYSE:MFV), have nearly a century of active management experience. Like other managers, they have made a commitment to both the Net Zero Initiative and Sustainable Investing and provide this statement about that:
At MFS, sustainable investing and creating value responsibly are one and the same: Seeing ESG issues as part of our investment process, not a separate outcome; driving sound businesses from within through engagement and proxy voting, not simply screening companies out; fully understanding what could materially impact a company’s sustainability today and in the future. We believe this is the only way to commit capital long term, responsibly and aligned with client outcomes.
As a signatory of the Net Zero Asset Managers initiative, we commit the majority of our AUM to be managed in line with net zero carbon emissions by the 2030 interim target.
Source: MFS Impact statement
So while not classified as an ESG fund (Environmental, Social, Corporate Governance), those criteria come into play in selecting and weighting MFV’s positions. Since ESG investing has some controversy around it, I thought it important to mention.
Under Portfolio strategy, I provided a three-way comparison against two other funds with similar asset allocation levels. Compared to the iShares and/or Fidelity Balanced fund, it becomes a choice between better returns or better risk/return results. MFV wins the first, the comparison funds, the second.
Understanding the MFS Special Value Trust
Seeking Alpha describes this CEF as:
MFS Special Value Trust is a closed-ended balanced fund launched and managed by Massachusetts Financial Services Company. The fund employs fundamental analysis and a bottom-up stock picking approach to create its portfolio. For the fixed income component of its portfolio, it seeks to invest in U.S. government securities, foreign government securities, mortgage backed and other asset-backed securities of U.S. and foreign issuers, corporate bonds of U.S. and foreign issuers, and debt instruments of issuers located in emerging market countries. MFV started in 1989. – Seeking Alpha
MFS provides this investment objective statement:
Seeks high current income, but may also consider capital appreciation.
Source: MFS Website
MFV has $37m in assets with a 12% yield over the past year. The fund carries a 138bps fee structure made up of 81bps for the managers and 57bps in other expenses. No leverage is used.
Holdings review
At the end of May, MFV held 344 assets, allocated across these sets of assets.
mfs.com MFV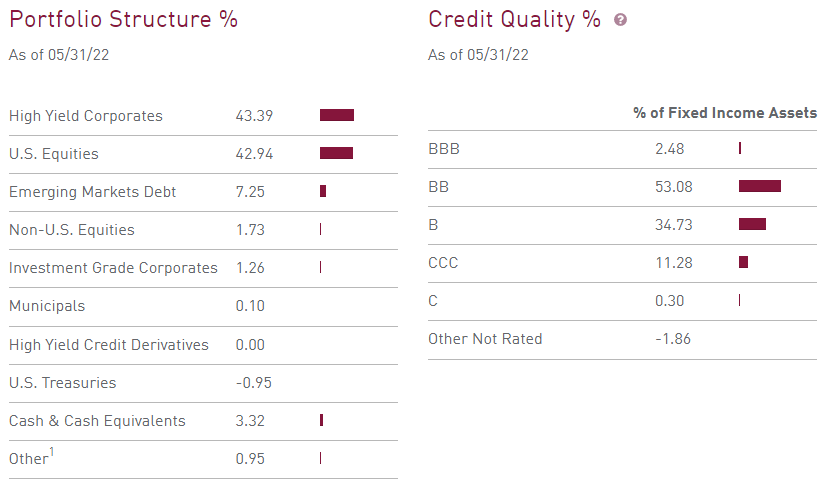
Combined, the split between Equities and Fixed Income is close to 45%/55% respectively. That makes it a moderate Balanced Fund based in a set of iShares ETFs (article link). This comes into play later when two fund comparisons are provided. As for its use of fixed-income assets, only the small allocation to BBB would be considered investment-grade debt. Once you go below B, the risk of defaults occurring climbs rapidly. MFV holds 12% of debt allocation in those higher-risk assets (about 22% of the FI ones). The debt portfolio carries a 4.01 year duration and a 5.95 year weighted maturity.
To get more details about the holdings, I downloaded the most recent available and that was April 30th data.
mfs.com; compiled by Author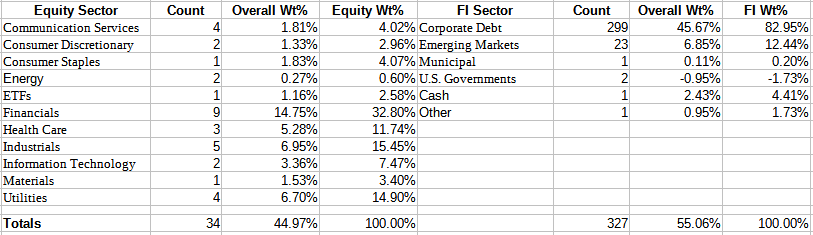
The classifications differ somewhat from those presented on the MFV homepage, but the weight between Equities/Fixed Income moved little in May.
Country allocation is mostly the United States but there are 25 countries represented in the portfolio. There was no indication of currency exposure nor MFV holding any currency futures to hedge any non-USD exposure they have.
mfs.com; compiled by Author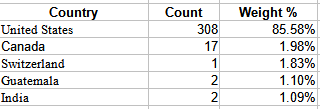
The above are the top 5 countries based on weight.
mfs.com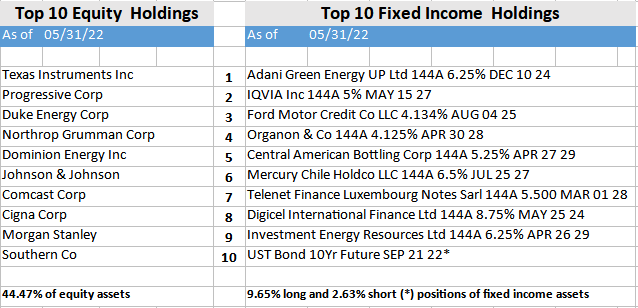
The site did not provide weights for May data, so I turned to April to get some idea. In April, Texas Instruments (TXN) was also the top equity holding at 2.2% of the portfolio. The Top 10 then were 20% of the total portfolio. On the Fixed Income side, the Digicel bond was the largest holding at .58%. The 10 largest FI holdings came to 5% of the total portfolio. Both are about the same with the May weights presented above.
Distribution review
MFV has adopted a Managed Distribution plan, currently set at 10%. MFS provided this description:
Under a managed distribution plan, to the extent that sufficient investment income is not available on a monthly basis, the fund will distribute long-term capital gains and/or return of capital in order to maintain its managed distribution level. You should not draw any conclusions about the fund’s investment performance from the amount of the fund’s distributions or from the terms of the fund’s managed distribution plan. The Board of the fund may amend the terms of the plan or terminate the plan at any time without prior notice to the fund’s shareholders. The amendment or termination of a plan could have an adverse effect on the market price of the fund’s common shares.
Source: MSF
mfs.com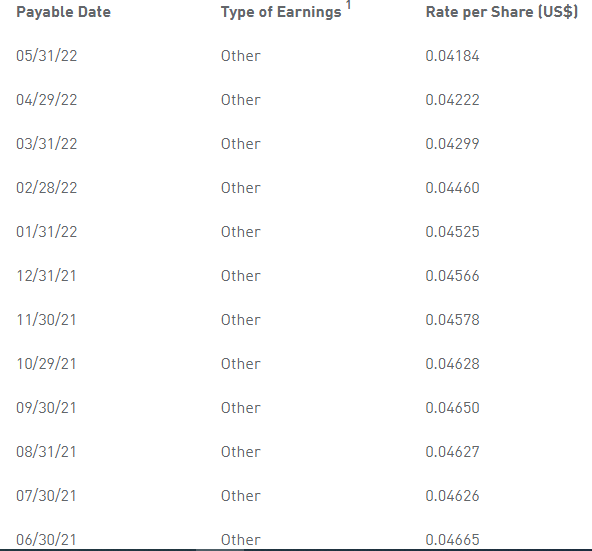
MFS lists the following sources considered Other: short term capital gains, long term capital gains, or return of capital. Apparently they label it as “Other” when any part is so classified. The estimated source for the latest payout and all payouts since 11/1/21 was provided:
mfs.com MFV payout PDF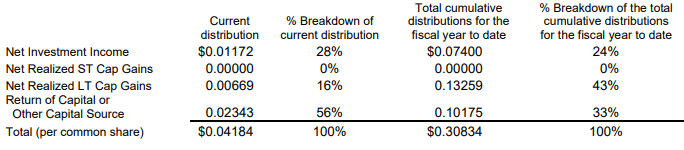
Price, NAV, and return review
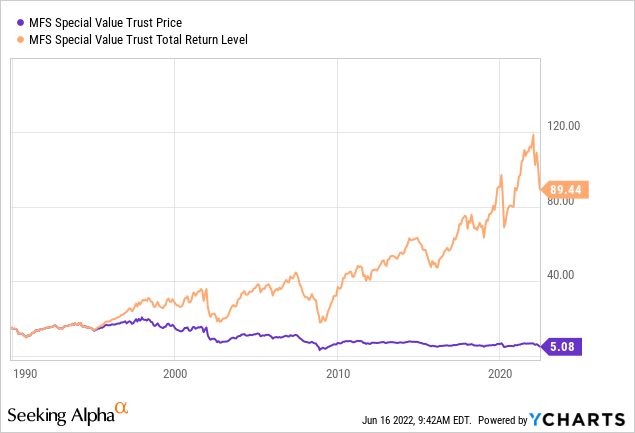
From its initial price, MFV is down 66%, though its high yield has investors ahead. To see what difference reinvesting made versus taking the payouts, I use the Dividend Channel website. With data back to 1995, the results were: Reinvesting provided a 6.3% CAGR; taking the payouts only 2.8%. No indication is given to what investors taking the payouts might have earned on that cash.
CEFConnct.com MFV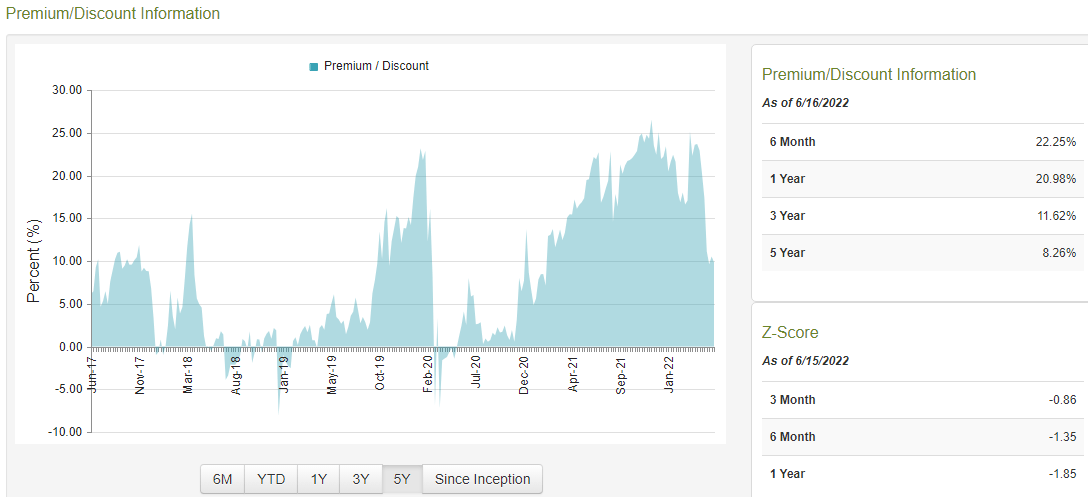
Most times MFV has sold at a premium; several times in 2022 topping 25%! The current premium is near 13% after getting as small as 8.2% at the end of May. While high to this investor, MFV’s Z-scores do indicate it is at a favorable level compared to its recent past.
Portfolio strategy
Since MFV invests like a Balanced fund, and MFS considers it as such, investors need to compare it to other similarly weighted Balanced funds to know if MFV is a good investment. Since the CEF doesn’t employ leverage, comparing to ETFs or MFs becomes possible. I chose these two for this step.
| Attribution | MFV | AOM | FASMX |
| AUM | $37m | $1.56b | $10b |
| Equity % | 45% | 40% | 50% |
| Fixed Income % | 55% | 60% | 50% |
| Fees | 138bps | 15bps | 62bps |
| Yield | 12% | 1.9% | 1.7% |
This has MFV’s allocation falling between the iShares ETF and the Fidelity Mutual Fund. There is a huge differences in both fees and yields. Glancing at the alternative funds indicates a much higher quality bond allocation versus what MFV holds, which would affect the yield generated. Unlike MFV, the other funds “earn” all their payout versus about 24% from NII for MFV.
PortfolioVisualizer.com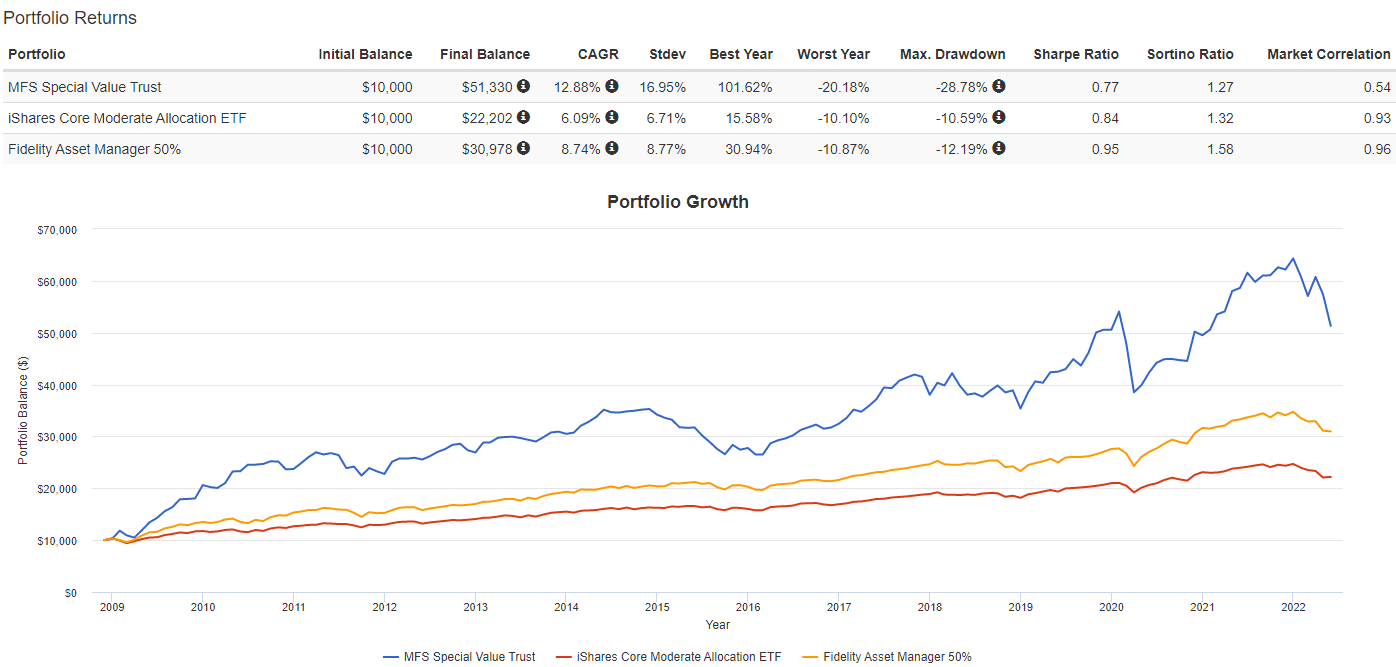
Looking only at CAGR, MFV clearly left the other two funds behind since 2008. For risk-adverse investors though, both of the other funds had much better StdDev, Worst Year, and Max Drawdown results to the point they also had the best Sharpe and Sortino ratios despite far lower returns.
Final thought
My (key word) interpretation of the above chart would be for long-term and investors willing to accept wider price swings to hold MFV. Investors with a shorter time horizon might prefer FMASX even though it’s not the safest, but its risk/returns are superior to AOM. With the large yield difference, the return gap between MFV and AOM (FMASX not available) shrank from 6% to 3.5% depending on whether payouts were reinvested or taken in cash. That tidbit might change some investors’ decision.
Be the first to comment