

necati bahadir bermek
By David Brady
Ahead of Powell’s big speech on monetary policy at Jackson Hole on Friday, where everyone and their dog expects Powell to reiterate the Fed’s hawkish stance on monetary policy, I want to look at where Gold stands.
The sentiment is as extreme bearish as it was at the 1,675 lows.
Funds went slightly long again as Gold rose to 1,824 but have been cutting those longs as Gold fell back. Banks added back some shorts but are now tapering them again. Both positions are, on balance, bullish.
Author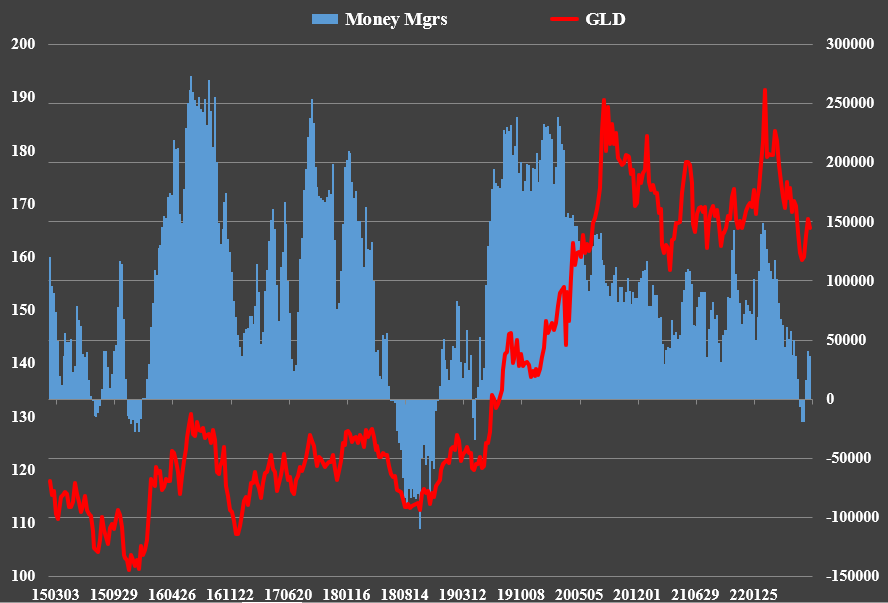
Open interest is at its lowest level since May 2019, when Gold was in the 1,300s. Again, bullish.
Author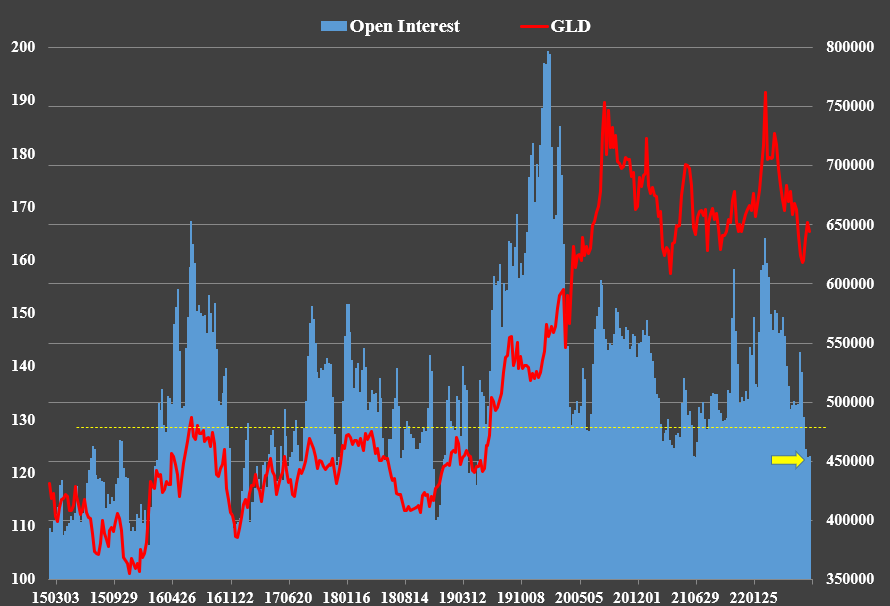
Bonds may have a little further to go on the downside, but they’re getting ready to take off, in my humble opinion, with yields heading much lower:
StockCharts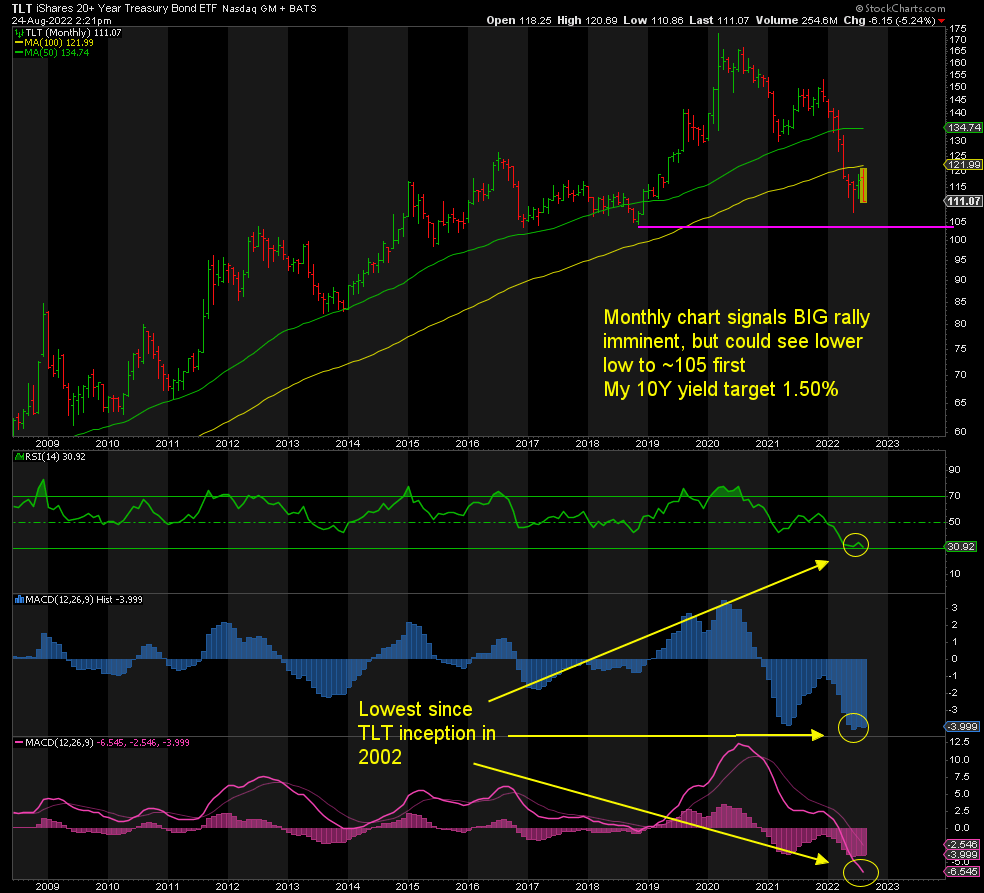
This is what I currently see in TIP, the inverse of real yields, a bullish channel/flag…
StockCharts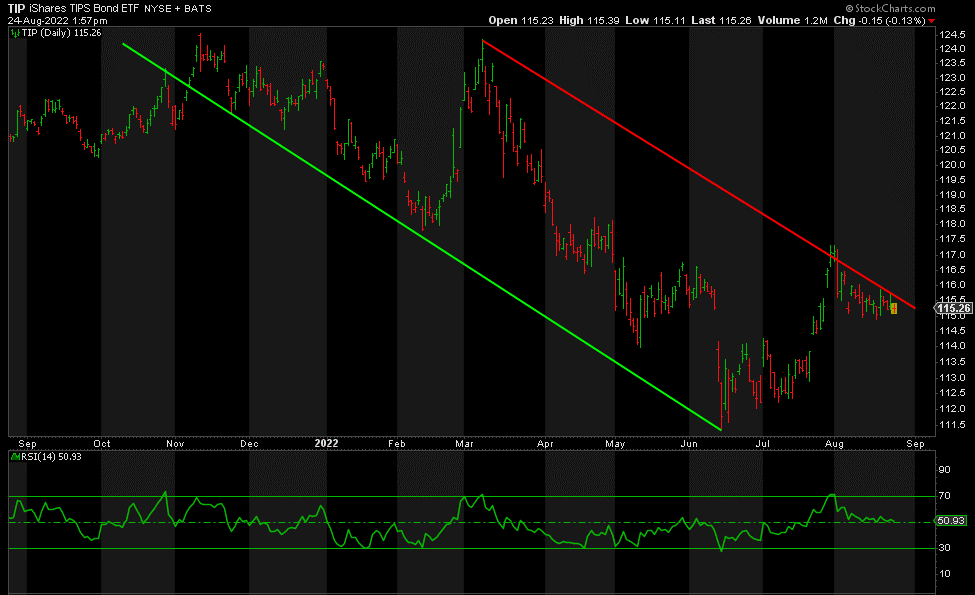
‘When’ we break that trendline resistance in red, TIP will rally in a big way, real yields will fall, and Gold follows TIP higher. Weekly and monthly charts are screaming to the upside.
The charts for Gold suggest two primary scenarios. First the weekly chart:
StockCharts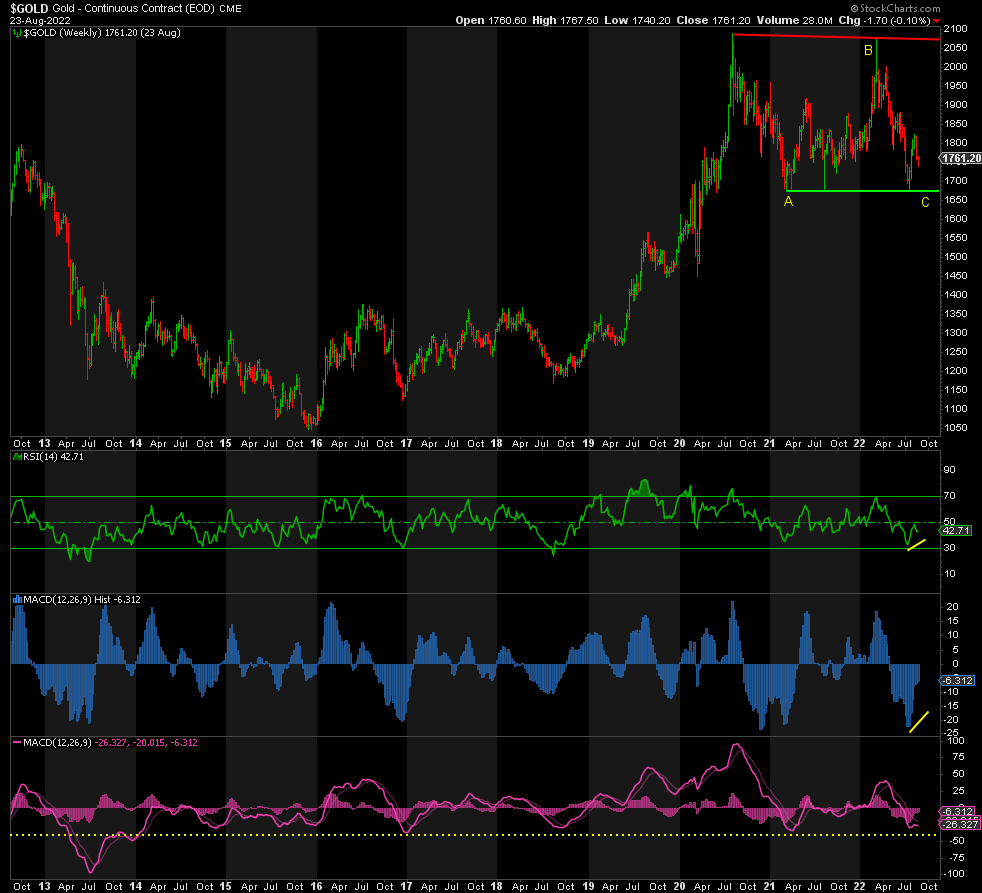
We bottom in wave C of this correction since August 2020 at ~1,663, where the size of wave C = A. There is a perfect set-up in both the RSI and MACD Histogram for such an outcome. The MACD Line would also register its lowest level since 2013, nine years ago. Talk about extreme oversold! More so than at 1,045 in 2015, 1,124 in 2016, and 1,167 in 2018.
Now for the daily chart:
StockCharts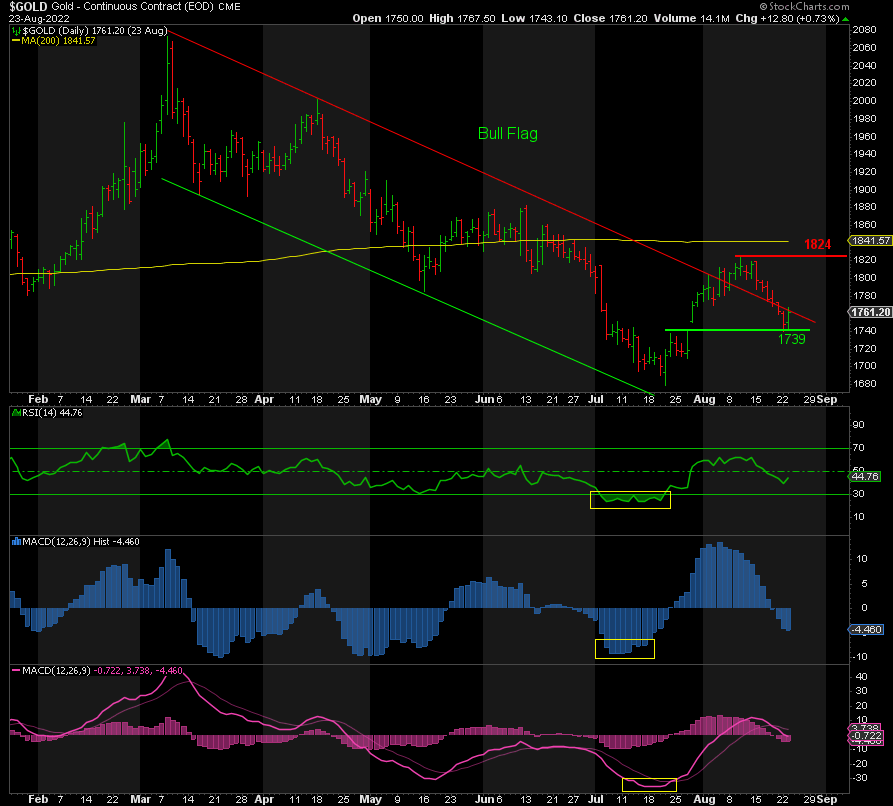
The alternative is that we have bottomed out in wave 2 at ~1,740, coming off the high of 1,824. This also just happens to be the 61.8% retracement of the rally from 1,678 to 1,824, standard for a wave 2. Next, we head upwards in wave 3, the money wave.
Either way, we’ve got a drop of a further ~$75 or the bottom is already in place. That’s a bullish risk/reward profile based on probabilities.
There is one more possibility of a far deeper dive in Gold in conjunction with stocks and higher real yields, but that is relatively small at this time. Only below 1,650 does that become a higher probability.
All in all, everything is pointing north, except perhaps the most important factor, Fundamentals, and that means the Fed. The Fed persists with further tightening of monetary policy. We need to see at least a pause in rate hikes or an abandonment of QT to confirm that the rally to new record highs in Gold has begun. If Powell is less hawkish and more dovish than anticipated on Friday, the bottom could be in place.
Editor’s Note: The summary bullets for this article were chosen by Seeking Alpha editors.
Be the first to comment