

Edwin Tan /E+ via Getty Images
In this analysis of FIGS, Inc. (NYSE:FIGS), we covered the company following its Q3 2022 earnings briefing with a revised growth outlook of 18% for the full year of 2022. However, this is significantly lower compared to its past growth, with a 3-year average of 99.5%. Thus, we analyzed the company’s revenue growth drivers by examining its past active customer, revenue per customer and AOV growth.
Furthermore, we analyzed the company’s target customer base and market opportunity of medical professionals in the U.S. and forecasted its customer growth. Finally, we examined the company’s market position and compared its pricing with competitors to determine whether it has an advantage and forecasted its revenue growth based on revenue per customer and active customers.
Customer Growth is its Key Growth Driver
|
FIGS |
Q4 2019 |
Q4 2020 |
Q4 2021 |
Q3 2022* |
Average |
|
Active Customers (‘000s) |
596 |
1,300 |
1,872 |
2,271 |
|
|
Growth % |
118.1% |
44.0% |
21.3% |
61.1% |
|
|
Revenue Per Customer TTM ($) |
185 |
202 |
224 |
227 |
|
|
Growth % |
9.2% |
10.9% |
1.3% |
7.1% |
|
|
AOV ($) |
95 |
94 |
105 |
112 |
|
|
Growth % |
-1.1% |
11.7% |
6.7% |
5.8% |
|
|
Total Revenue ($ mln) |
110 |
263 |
419 |
516 |
|
|
Growth % |
138.2% |
59.7% |
23.0% |
73.6% |
*Active Customers Prorated
Source: FIGS, Khaveen Investments.
We prorated the company’s active customer growth on its Q3 2022 to estimate the full year 2022 active customers. Based on the table above, the company’s customer growth has a 3-year average of 61.1% until 2021. However, the prorated number of customers for 2022 represents a growth rate of only 21.3%, thus highlighting the decelerating growth trend for its customer base as the increase of its customer slows from 2019 to 2022.
Moreover, the company’s revenue per customer growth over the past year had slowed down to 1.3% in Q3 2022, which is lower than its 3-year average of 7.1%. This is in contrast with its increase in revenue per customer growth in 2021. Furthermore, the company’s AOV growth has also slowed down over the past year to 6.7% in Q3 2022, but is still higher than its 3-year average growth of 5.8%.
Overall, the company has a 3-year average growth rate of 73.6% and its growth has been driven by customer growth, as it appears to be correlated with revenue growth. Also, its active customers had an average growth of 61.1% which is higher compared to its revenue per customer and AOV growth. Though, the company’s revenue growth has continued to slow down since 2020 as the company’s customer growth had slowed down.
Still a Large Opportunity to Capture Healthcare Employee Customers
Based on the company’s annual report, FIGS, Inc. had a customer base of 1.87 mln in 2021. The company’s customers include medical professionals. According to SL Scrubs,
hospitals are not required to provide scrubs to employees.
Furthermore, based on the company,
healthcare apparel purchasing has shifted from institutions to the individual, with approximately 85% of all medical professionals now purchasing their own uniforms.
|
Healthcare Sector (‘000s) |
2021 |
2022 |
2023F |
2024F |
2025F |
2026F |
2027F |
|
Total Healthcare Employees in the US |
16,104 |
16,624 |
16,866 |
17,112 |
17,362 |
17,615 |
17,872 |
|
Growth % |
0.6% |
3.2% |
1.5% |
1.5% |
1.5% |
1.5% |
1.5% |
|
Customer Opportunity |
13,688 |
14,130 |
14,336 |
14,545 |
14,758 |
14,973 |
15,191 |
|
Growth % |
0.6% |
3.2% |
0.0% |
0.0% |
0.0% |
0.0% |
0.0% |
|
FIGS Customers |
1,872 |
2,271 |
2,757 |
3,242 |
3,728 |
4,214 |
4,699 |
|
Growth % |
44.0% |
21.3% |
21.4% |
17.6% |
15.0% |
13.0% |
11.5% |
|
Customer Increase |
572 |
399 |
486 |
486 |
486 |
486 |
486 |
|
FIGS Customers as % of Total Healthcare Employees |
13.7% |
16.1% |
19.2% |
22.3% |
25.3% |
28.1% |
30.9% |
Source: US Bureau of Labor Statistics, FIGS, Khaveen Investments.
According to the Bureau of Labor Statistics, the number of healthcare employees has increased by an average of 1.5% in the past 10 years and was 16.6 mln in 2022. Thus, we believe this could provide a large growth opportunity for FIGS, as its customers are only 13.7% of the total number of healthcare employees.
Furthermore, we forecasted the company’s customers in 2022 based on prorated Q3 results and beyond 2022 based on its 2-year average customer increase of 486 mln. Additionally, we assumed the company’s customers as a % of total healthcare employees to increase to a limit of its market share of 34%. Based on our forecast, we see the company’s customers as a % of total U.S. healthcare employees reaching 30.9% by 2027.
Thus, while we believe there is still a large market opportunity for the company to capture, we expect the company’s customer growth to slow going forward compared to its past average growth of 61.1%.
Flattish Revenue per Customer Growth
Furthermore, we analyzed the company’s market position in the scrubs market by compiling its competitors and their revenue from ZoomInfo in the chart below.
Zoom Info, Khaveen Investments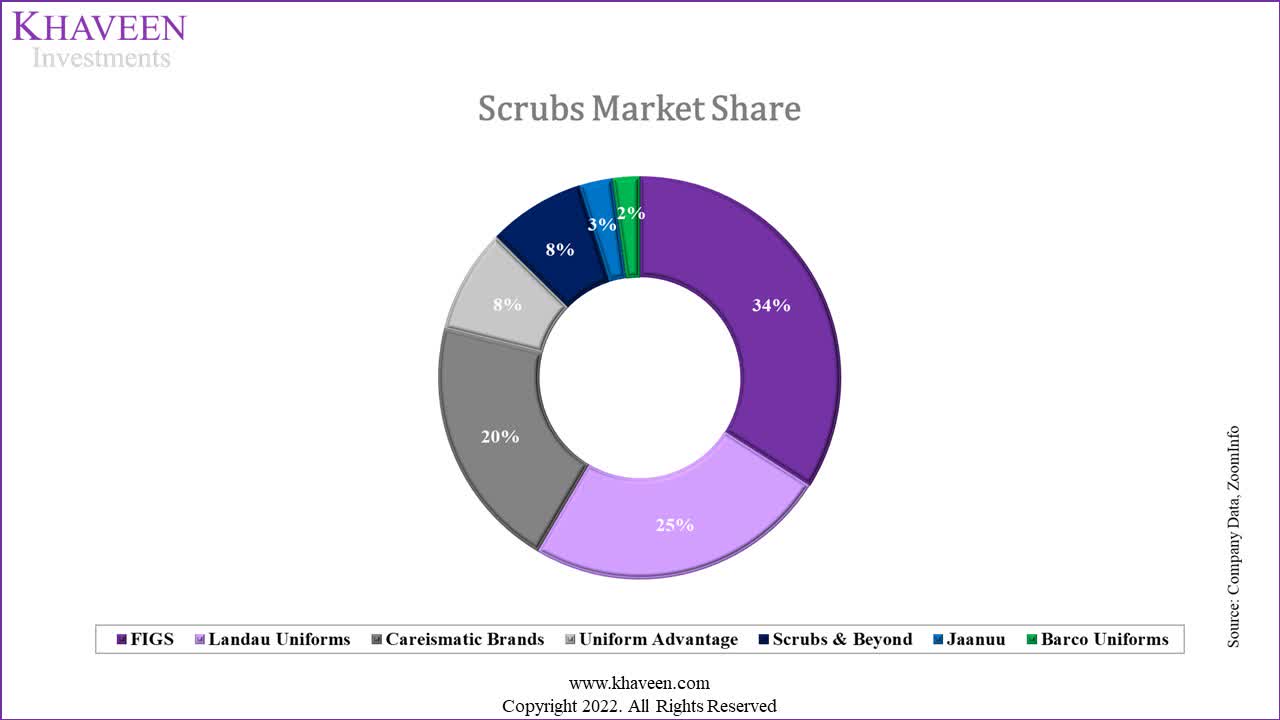
In terms of competition, the company competes against various competitors. As seen in the chart above, the company has the highest market share. Additionally, we compared the company’s average pricing for its scrub top and pants with its competitors to examine its pricing.
|
Average Scrub Prices ($) |
Tops |
Pants |
|
Careismatic Brands |
28 |
37 |
|
Barco Uniforms |
26 |
29 |
|
Landau Uniforms |
17.5 |
26 |
|
Scrubs & Beyond |
23.5 |
26 |
|
Uniform Advantage |
14 |
17 |
|
Jaanuu |
39 |
42 |
|
FIGS |
38 |
48 |
|
Walmart Scrubs |
10 |
14 |
Source: Company Data, Khaveen Investments.
As seen above, the company has the second-highest average pricing for scrub tops behind Jaanuu and has the highest pricing for scrub pants. Thus, we believe this indicates the company’s premium pricing strategy based on its high pricing in comparison to competitors and could benefit the company in terms of market share where it has a leading market position. Moreover, in terms of its products, the company highlighted in the call that it…
delivered an alternative with outstanding quality and functionality that meets their needs.
The company also launched its new FIGS PRO collection and lightweight Packable Puffer. Furthermore, the company has a positive NPS score of 27 which indicates its positive customer satisfaction. From its earnings briefing, the company highlighted that its customers reduced purchases due to budget constraints.
We believe the macro trends, including the sustained level of inflation, began to weigh more heavily on our healthcare professionals. Our own customer surveys tell us that FIGS remains their favorite brand, but they are pulling back on purchases due to their tighter budget. – Trina Spear, Co-Founder and CEO
Thus, we believe the company’s slowdown in the company’s revenue per active customer is impacted by the macroeconomic headwinds which provided a prorated growth of 1.3% for its revenue per customer in 2022.
Risk: High Product Pricing
We believe one of the risks of the company is the high pricing of its scrubs compared to competitors. As mentioned in the previous point, we believe the company’s higher pricing supports its market position in terms of market share. However, we believe that its high pricing may hinder its ability to further grow its share of customers. Thus, we assumed a limit of its customers as a % of total healthcare employees of its current market share of 34%.
Verdict
|
Revenues Forecast |
2019 |
2020 |
2021 |
2022F |
2023F |
2024F |
2025F |
2026F |
|
Active Customers (‘000) |
596 |
1,300 |
1,872 |
2,271 |
2,757 |
3,242 |
3,728 |
4,214 |
|
Growth % |
118.1% |
44.0% |
21.3% |
21.4% |
17.6% |
15.0% |
13.0% |
|
|
Net revenues per Active Customer ($) |
185 |
202 |
224 |
227 |
243.2 |
260.6 |
279.2 |
299.1 |
|
Growth % |
9.2% |
10.9% |
1.3% |
7.1% |
7.1% |
7.1% |
7.1% |
|
|
Total revenues ($ mln) |
110 |
263 |
419 |
516 |
670 |
845 |
1,041 |
1,260 |
|
Growth % |
138.2% |
59.7% |
23.0% |
30.0% |
26.0% |
23.2% |
21.1% |
Source: FIGS, Khaveen Investments.
We forecasted its revenue per customer growth based on a 3-year average of 7.1%, as we expect it to recover going forward with its leading market position and positive customer satisfaction.
All in all, we determined that the company’s growth was driven primarily by active customer growth, but that slowed down in 2022, which weighed on its revenue growth. Moreover, while we believe there is still a large market opportunity for FIGS, Inc. to capture, we expect the company’s customer growth to slow going forward compared to its past growth of 61.1%. That said, we expect its revenue per customer growth to recover going forward with its leading market position and positive customer satisfaction and forecasted its total growth at a 5-year average of 24.7%. Based on analyst consensus, FIGS, Inc. has a price target of $8.68 with an upside of 29%. Thus, we rate FIGS, Inc. as a Buy.
Be the first to comment