

jetcityimage/iStock Editorial via Getty Images
One of the most unique corporate names has a real story behind it. It begins in the middle part of the 19th century, sometimes known as the “Free Banking Era”. During this time, only state-chartered banks were allowed, and the banks could issue notes against gold or silver. Each state established the rules and regulations under which each bank operated. Nearly half of all state banks failed during this time.
In 1858, William W. Scarborough and eleven others contributed $25,000 to open The Bank of the Ohio Valley in Cincinnati, Ohio along the busy Ohio River. The Civil War broke out not long after, and the bank had to manage bank notes from three Union states and one Confederate state. In 1871, Third National Bank acquired The Bank of the Ohio Valley, and by 1882, Third National was considered to be the largest bank in Ohio.
Queen City National Bank changed its name to Fifth National Bank in 1888. Union Savings Bank and Trust Company was organized in 1890 by Jacob G. Schmidlapp, who later established the Charlotte R. Schmidlapp Fund, which was the first charitable fund in the U.S. dedicated to helping young women pursue their careers. In 1908, Third National Bank and Fifth National Bank merged to become the Fifth-Third National Bank of Cincinnati. In 1927, Fifth-Third National and The Union Trust Company combined to become The Fifth Third Union Trust Company. The name changed to Fifth Third Bank in 1969. Fifth Third Bancorp (NASDAQ:FITB) has had the 5/3 shield ever since.
Over the following decades through today, the company continued its expansion across the mid-West United States. Today, FITB has 20,000 employees, 1,100 banking centers across 11 states and over $200 billion in total assets. Despite the many challenges the country has faced since 1858 – war, depression, pandemics – it is evident that the company has been managed well to not only survive these challenges, but to actually thrive and grow to become the market leader of today.
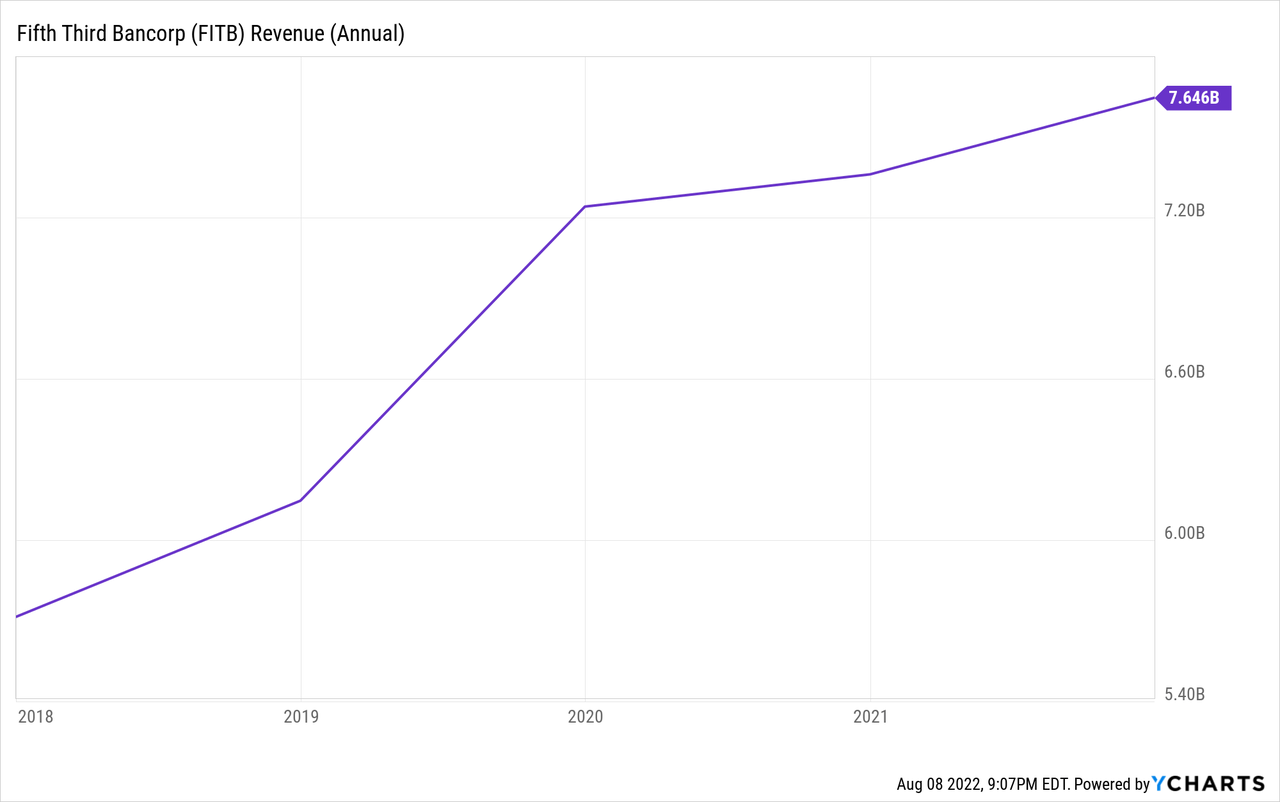
Income Statement
Turning to the financials, interest income increased 4.4% in 2021 while interest expense decreased over 5% from 2020. This resulted in an increase of 5.7% in net interest income, which is actually quite favorable given the challenging interest rate environment over the past several years. Furthermore, the company has exhibited continued growth in net interest income through the first half of 2022, with NII increasing 6.2% from the first half of 2021. The company cited increases in market interest rates, average taxable securities, and average loans, as well as a decrease in average long-term debt as the primary reason for the increase in NII.
The company’s noninterest revenues have also shown steady 3.0% annual growth over the past five years. Growth has been led by commercial banking revenues and the wealth and asset management business. However, the first half of 2022 resulted in lower noninterest revenues as a result of a fairly dramatic decline in the mortgage banking business. This has been a trend across the industry, and I have noted this in my other reports. Noninterest revenues declined 8.7% in the first six months of the year, with mortgage banking revenues down over 44%. Compared to Citizens Financial Group which I reviewed here, the revenue picture at FITB is a bit of a mixed bag, with higher NII, but lower noninterest revenue. It is also worth noting that mortgage banking revenues have averaged 3.5% of total net revenues over the past five years. For the first half of 2022, mortgage banking fees were 2.1% of total net revenues, well below the historic average. With the expectation that interest rates will continue to rise in the near term, FITB, like all banks, are going to face mortgage banking revenue headwinds for the foreseeable future.
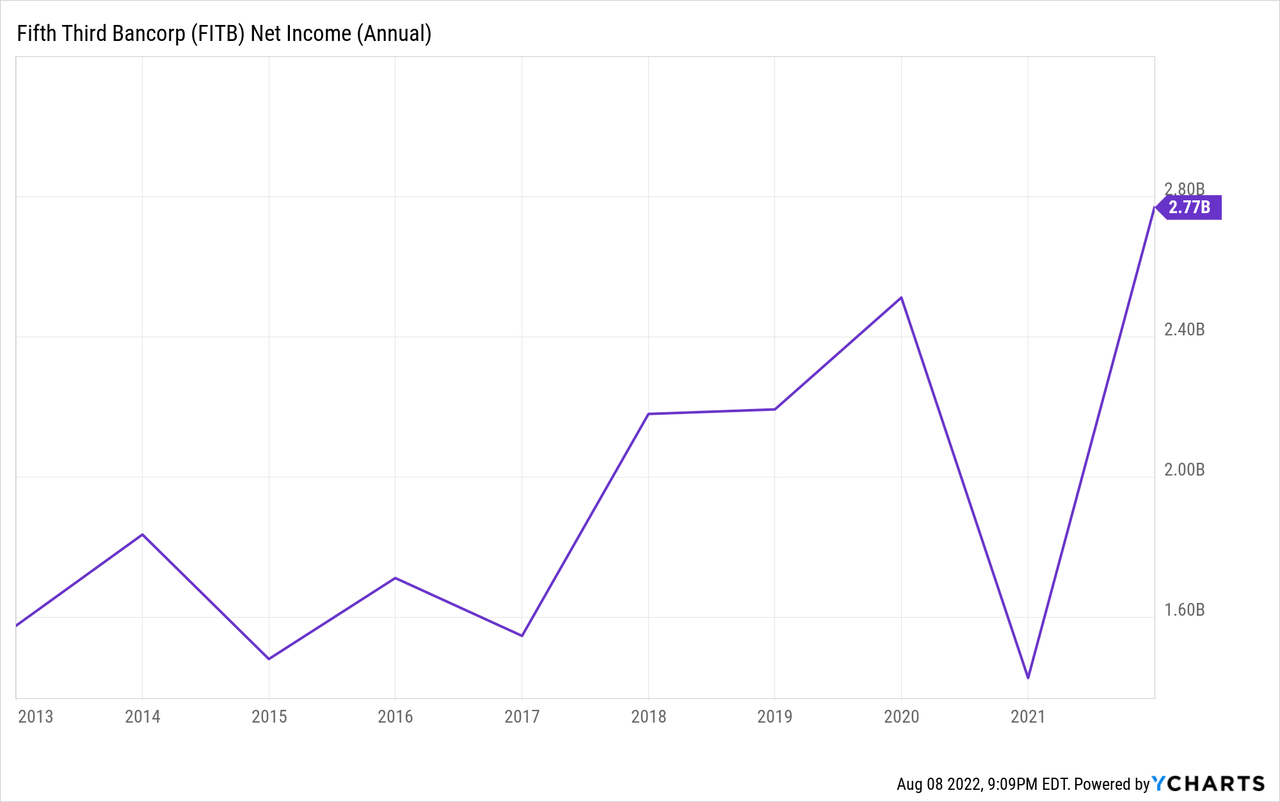
The activity surrounding the provision for credit losses is interesting. For the full year 2021, the company reported a benefit of $377 million, the first benefit from loan losses since at least 2014. At the time, the company said the benefit was due to “improved economic forecasts, improved credit quality and changes in product mix.” However, in the company’s Q2 10-Q, management reported a “deterioration in forecasted macroeconomic conditions”, resulting in a provision for loan losses of $224 million, the majority of which was reported in Q2. By comparison, the company reported a benefit of $288 million in the first half of 2021, a swing of $512 million. This is the second company in a row that I have analyzed that noted a change in the macroeconomic environment in just six months. This is one of the reasons why I enjoy analyzing financial companies – they are often the first to reveal changes in consumer or borrower activities, portending an economic contraction or expansion.
On the expense side, the company has historically done a decent job managing expenses. Compensation is the largest expense category for financial firms. At FITB, the compensation expense ratio has averaged 0.31 over the past five years, with 2021 coming in at 0.33, slightly higher than average. Through the first half of 2022, the ratio is also 0.33, in line with the latest full year results, but above the historical average. The efficiency ratio, a measure of overall expenses, has averaged 0.58 over the past five years, with 2021 finishing at 0.60. The company continues to invest in technology and communications, as the financial services industry has become increasingly digital based, requiring constant improvements and new initiatives to meet customer demands. Through the first six months of this year, the efficiency ratio was 0.60, also in line with the most recent full year results. Technology and communications expenses were 5.1% of total net revenues, which has been trending higher over the past few years.
Finally, the income results have been really strong for FITB. Operating margins have averaged 38% over the past five years, with 2021 coming in at 45%; if the provision was in line with pre-pandemic averages, the operating margin in 2021 would have been closer to 25%. Operating margin for the first half of this year was 34%, which is good, but still below the pre-pandemic level of 38% in 2019. Five-year net income for common stockholders has increased at 12.6% annually, with EPS increasing at a very strong 14.3% annually over the same period. In the first half of 2022, net income decreased 26% to $1 billion, while EPS decreased 23% to $1.44 per share.
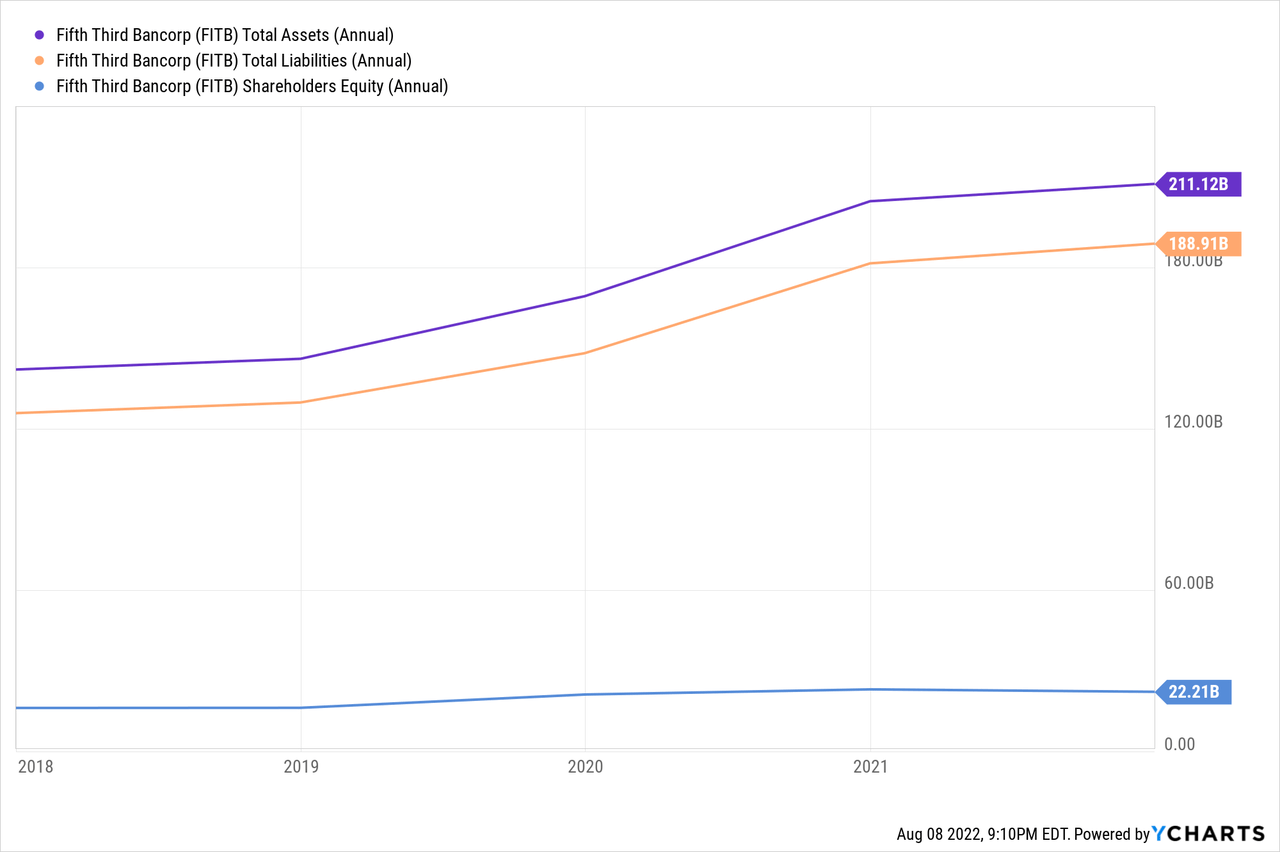
Balance Sheet
Looking at the balance sheet, total assets have increased 8.2% annually over the five-year period ending in 2021. Over this same period, loans have increased 4%, which is decent growth. Total liabilities have outpaced asset growth, though, with an 8.4% annual growth over the five-year period. Deposits have increased 10% over this period, which is really strong growth. Total assets and liabilities have decreased in the first half of 2022. Loans were up 6% from year end, while deposits were down 5%.
Notably, long-term debt has decreased over 4% annually over the past five years. Finally, total shareholders’ equity has increased 6.5% annually, primarily driven by an increased reliance on preferred stock as a source of capital, which is consistent with other companies in the peer group. Additionally, common equity and tangible common equity have both increased 6.2% and 3.3%, respectively, over the past five years.
Ratio Analysis
Return on equity averaged 12.5% in the years prior to the 2020 pandemic. After falling by half in 2020, ROE rebounded to 12.2% in 2021. At the end of Q2, ROE was 10.2%, which is slightly lower than last year’s results. Return on common equity has followed the same trend, declining from 14.2% in 2018 to 12.9% in 2021. At the end of Q2, ROCE was 11%, which is slightly below the historical average.
Debt to equity has steadily decreased, from a high of 1.17 in 2017 to just 0.58 at the end of 2021. Similarly, debt to total assets has decreased from 0.13 in 2017 to 0.06 in 2021. Interest coverage ratios are strong, with 2021 reporting a 9.0x interest figure. First half 2022 interest coverage was a very healthy 7.1x.
Loan Quality
In terms of loan quality, the company is currently well-positioned to navigate a challenging economic environment. Net charge offs in 2021 were just 0.16% of loans. But investors need to keep in mind the comment earlier about management noting a decline in the macroeconomic environment. The allowance for loan losses has averaged 1.5% of loans over the past five years. At the end of the second quarter, the allowance for loan losses was 1.7% of total loans. Obviously, as we move into the latter half of the year, investors need to keep an eye on this ratio to determine if there are any systemic issues with the company’s borrowers.
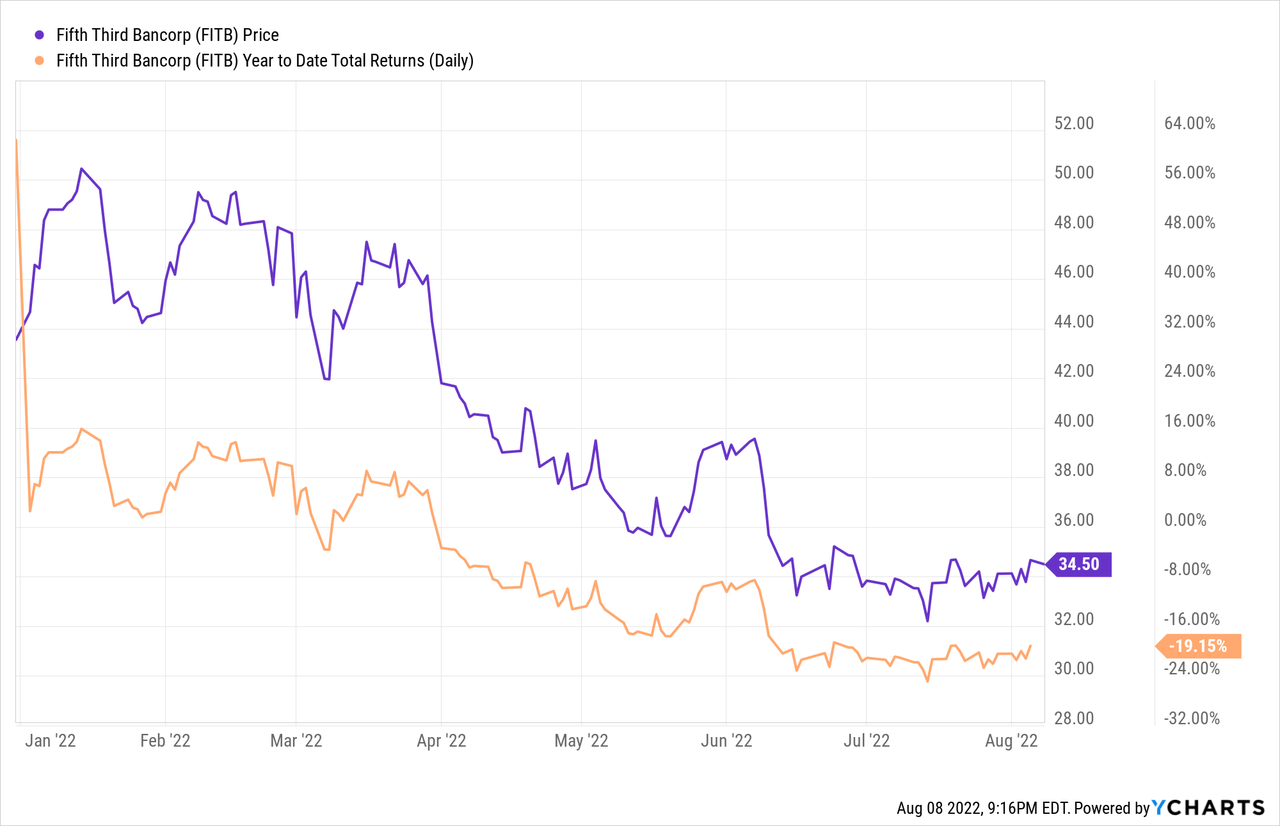
Stock Performance and Valuation
FITB is another good, quality regional bank. However, like many stocks this year, FITB is down.
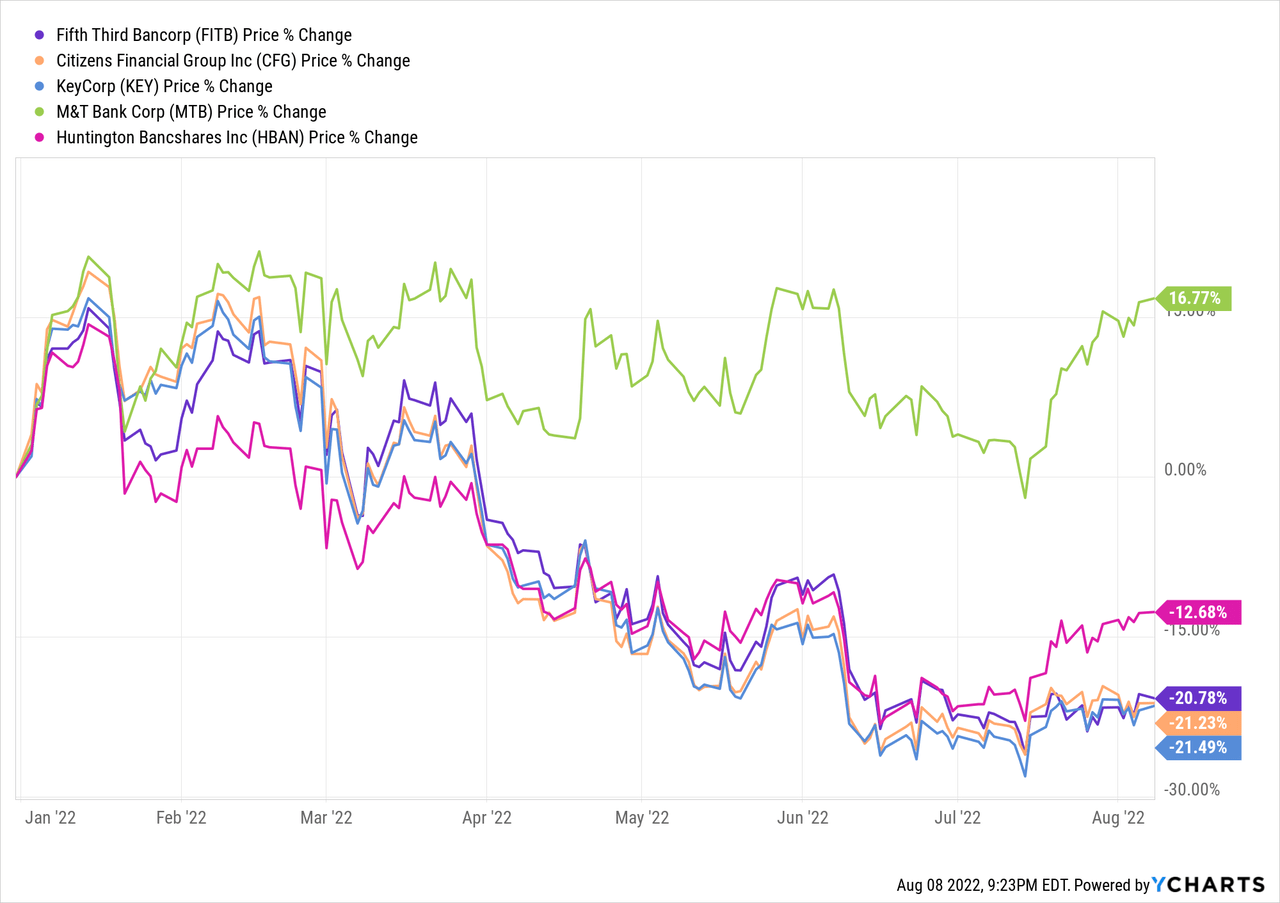
Compared to several of its peers, FITB is toward the bottom of the peer group in YTD performance.
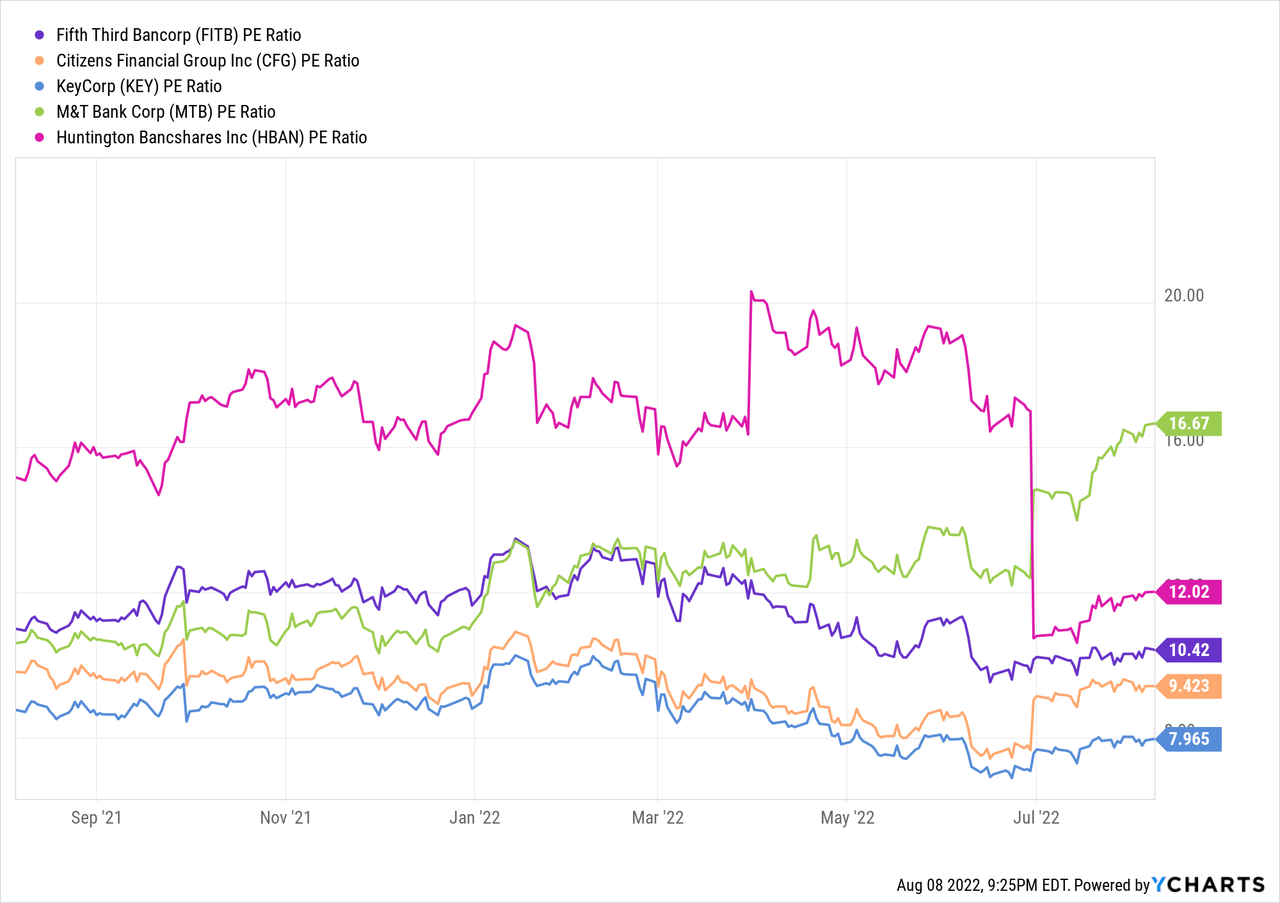
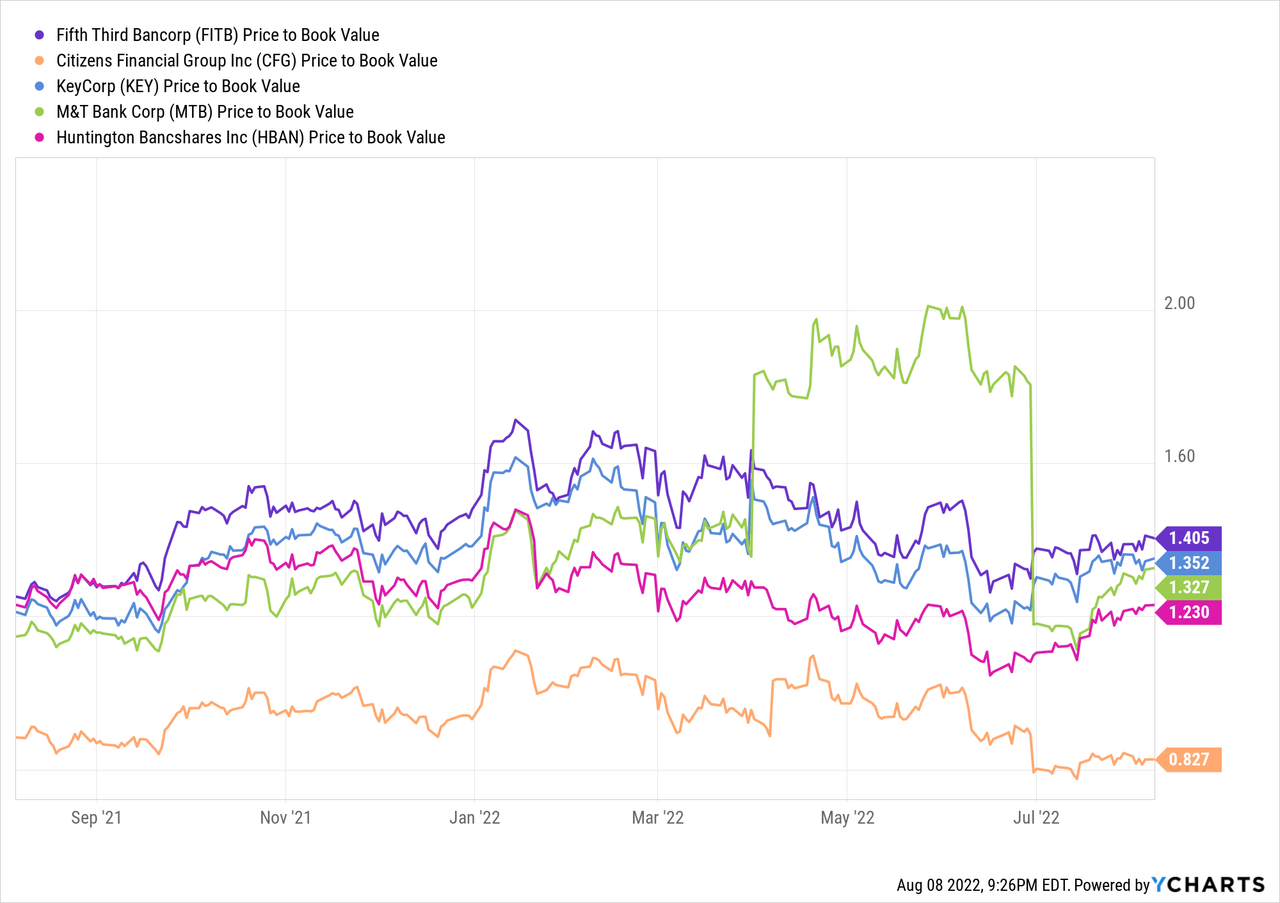
At a recent price of $34.49, the stock is trading at 10.5x last twelve months earnings with a 1.4x book value ratio. The P/E ratio is slightly below the five-year average, while the P/B is above the five-year average. Compared to several of its peers, FITB has a below average P/E ratio.
The P/B ratio is above the peer group average:
The current yield is slightly below the group average:
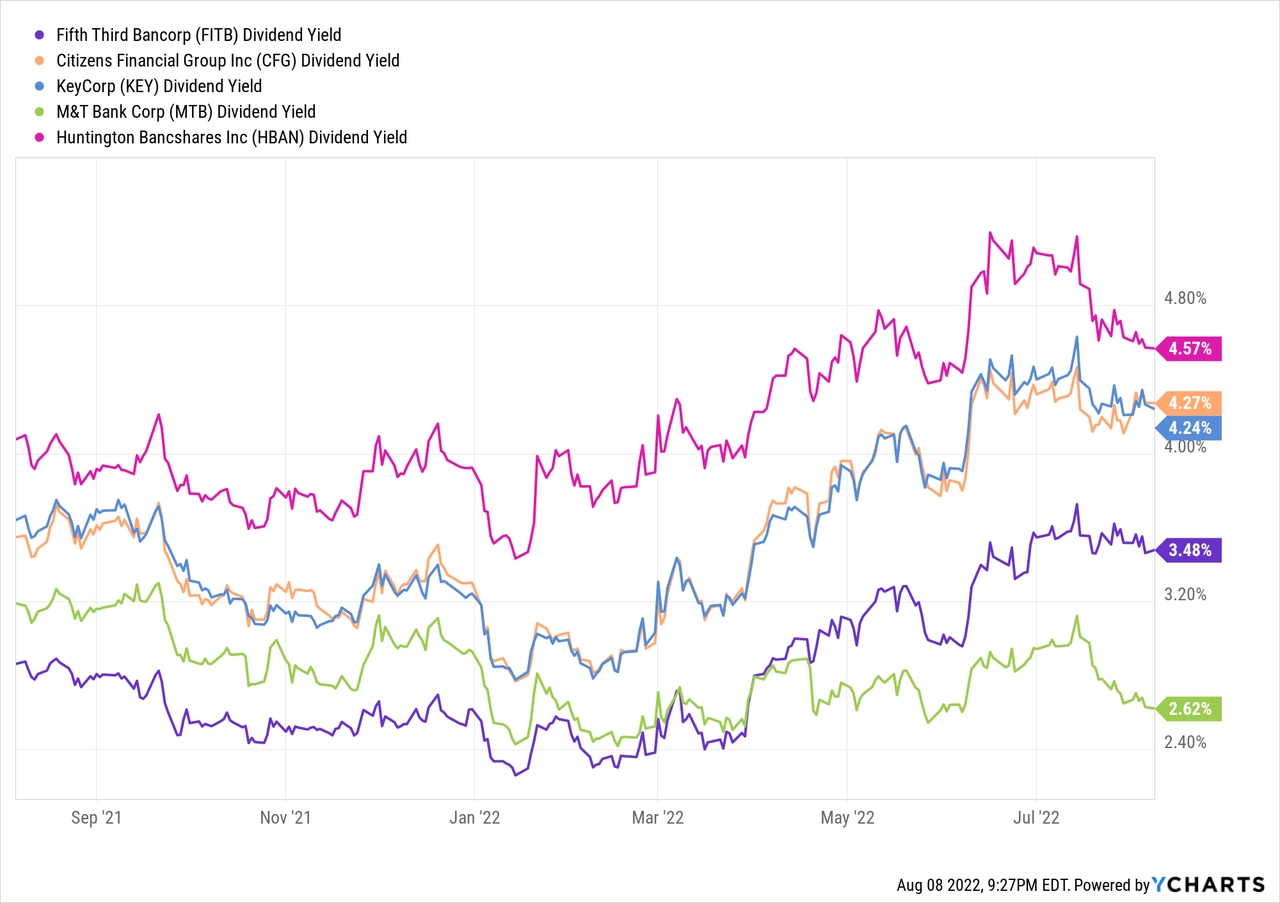
Using a variety of valuation methods, the fair value for this stock is about $31, so the stock is currently slightly overpriced. Despite a decent dividend yield of 3.48%, I think it is wise that investors wait on buying into FITB. It is a great company, and the next sell-off into the lower 30s would provide the investor with a bit more cushion. For investors that currently own the stock, I think the yield is safe and investors should be comfortable holding on to the stock, albeit with higher-than-normal volatility likely.
Fifth Third has been around for a long, long time. The company has proven its ability to grow earnings at a double-digit clip. But, with the economic backdrop, increases in certain expense items and the current valuation, there is some caution here. This is a great company, and investors who are looking for bank exposure should definitely put FITB on their short-list of investments to add during the next sell-off into the lower 30s. For current owners, it is a bit on the pricey side, but with great management and a secure dividend, it is probably worth keeping in the portfolio for now.
Be the first to comment