

Darren415
This article was first released to Systematic Income subscribers and free trials on Aug 8.
In this article, we catch up on Q2 results from the Business Development Company, Fidus Investment (NASDAQ:FDUS). FDUS is currently trading at a total dividend yield of 10.5% and a valuation of 101%.
The company continued its track record of strong and consistent performance. Despite an equity-overweight portfolio its NAV has held up much better than the sector average. Given its income tailwinds as well as a large spillover we wouldn’t be surprised by an additional dividend sometime later this year (whether through a base increase or a special). We continue to hold FDUS in our High Income Portfolio.
Quarter Update
The NAV fell about half a percent which is among the best of BDCs that have reported so far.
Systematic Income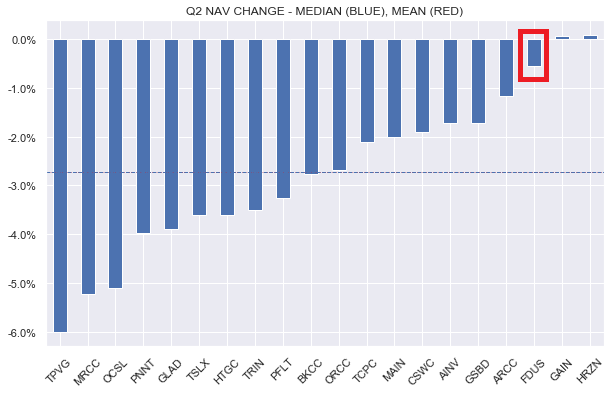
FDUS delivered a total return of around +1.5% over the quarter – on the higher end of BDCs that had reported up to its announcement.
Systematic Income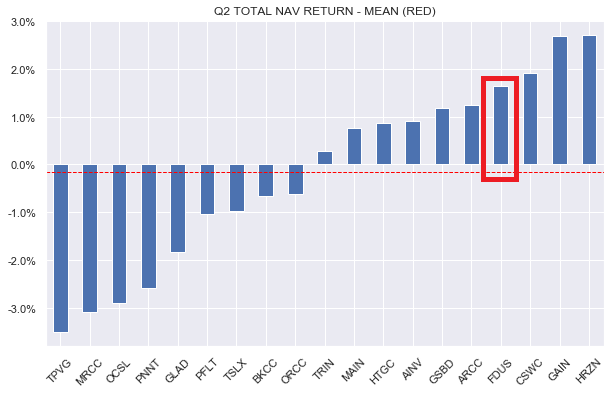
Adjusted net income which excludes capital gains incentive fees (red bars) was flat to Q1.
Systematic Income BDC Tool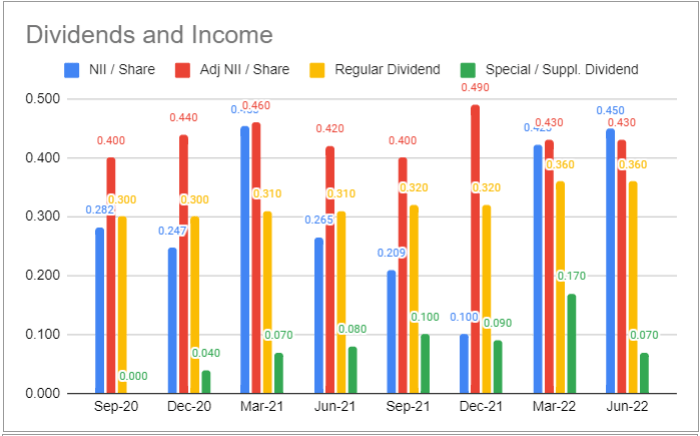
Overall investment income rose, partially offset by lower fees.
Systematic Income BDC Tool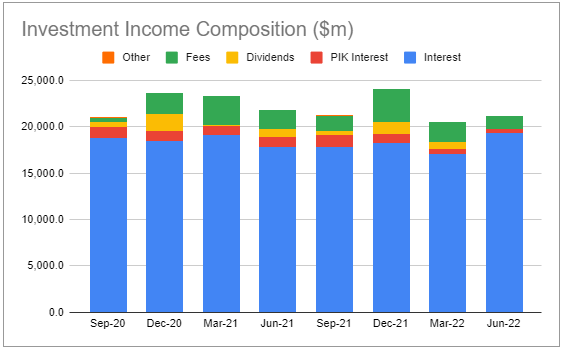
The company continued to realize gains in its equity portfolio with a $18.2m of net gains across 4 positions. It has also already booked significant realized gains in Q3 via a number of exits.
FDUS declared the same base dividend of $0.36 and supplemental $0.07 for Q3 that they paid out in Q2. However, there is upside potential to this number which the company will provide on the next earnings call in November. Specifically, the company’s very large spillover of $2.37 per share (the additional net gains realized so far in Q3 will increase this number further) could very well result in either an increase in the base dividend or a special dividend later this year.
Income Dynamics
The company continues to rotate its equity securities into secured loan / income-producing assets. The portfolio allocation chart below shows that the proportion of secured loans has been growing at the expense of equity.
Systematic Income BDC Tool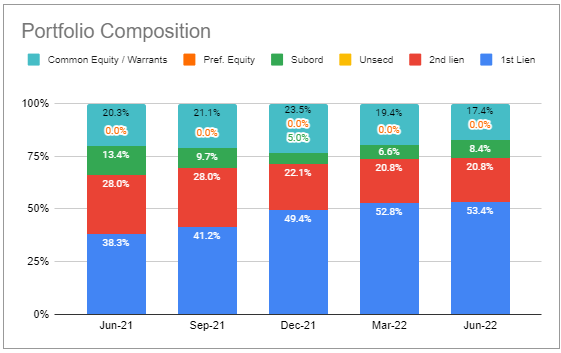
The company’s allocation to equity by cost is only 8%, however it has ballooned to 17.3% due to unrealized gains.
Fidus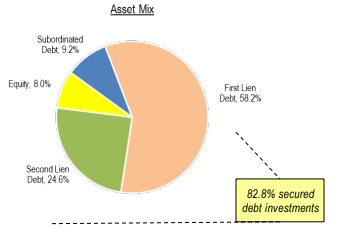
The company has been realizing those gains steadily and allocating the capital into income-generating securities.
Systematic Income BDC Tool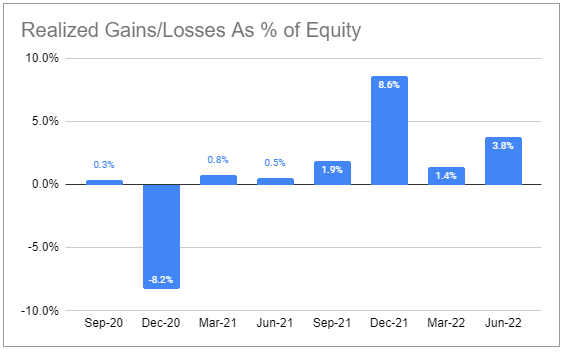
This dynamic explains in large part why the company’s interest income in Q2 stands at the highest level in two years.
Systematic Income BDC Tool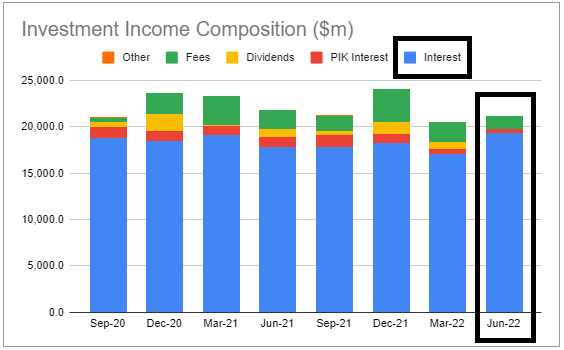
As FDUS continues this reallocation it will add a significant level of investment income over the medium term. Subsequent to the end of Q2 the company realized an additional $38 of net gains which speaks to this theme.
Net investments were pretty flat after a strong Q1 as new investments almost exactly offset prepayments and sales.
Systematic Income BDC Tool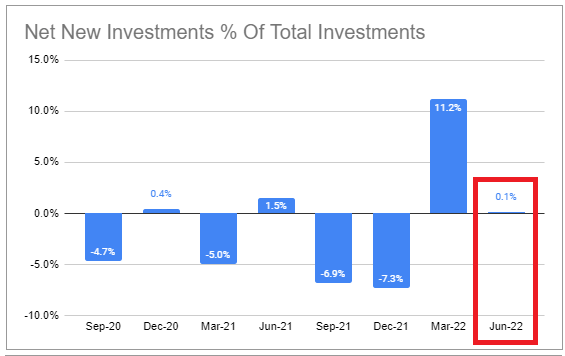
Although FDUS has a below-average level of floating-rate investments at 58% (vs. 91% sector average) it has no floating-rate liabilities (vs. 41% sector average). The result is a wash with its income beta to short-term rates in line with the sector average. Net income should continue to rise with rising short-term rates, all else equal. 3-month Libor is already 0.58% above its Q2-end level and will continue to rise further.
Systematic Income BDC Tool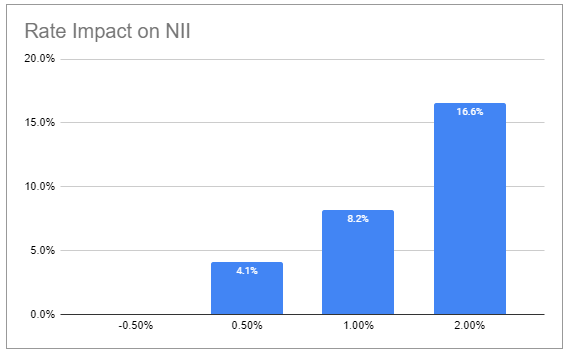
The company’s high proportion of fixed-rate debt means its cost of debt has not moved in recent quarters unlike the rest of the sector. Earlier, over 2021, its cost of debt moved lower from refinancings. Specifically, the company refinanced most of its debt in 2020 and 2021, taking advantage of a very low credit yield environment. Its earliest refinancing is a small SBA debenture in 2025 with the rest in 2026 and beyond. This fixed-rate and long-term financing profile gives FDUS a terrific advantage over the rest of the sector. Although FDUS would not normally be able to match the borrowing cost of the investment-grade BDCs like ARCC or GBDC it will soon match their debt interest expense (red bars below) for the simple fact that it was able to fully lock in cheap borrowing costs and has no floating-rate debt.
Systematic Income BDC Tool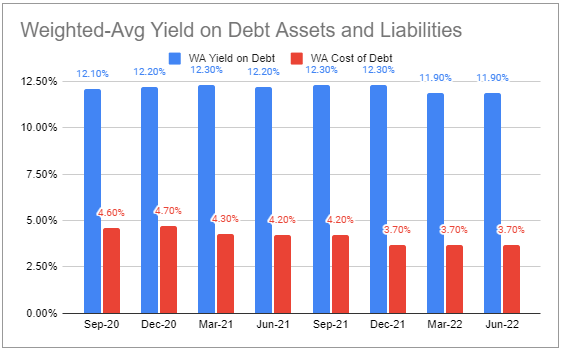
The company’s leverage of 0.8x is well below the sector average of 1.1x, giving it significant income upside potential.
Systematic Income BDC Tool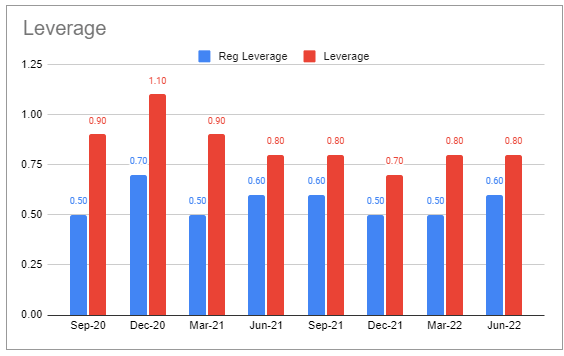
Portfolio Quality
This quarter FDUS placed two holdings on non-accrual with the fair-value of about 1% of its portfolio. This was the second quarterly rise and bears watching. The current level of non-accruals is in line with the sector median.
Systematic Income BDC Tool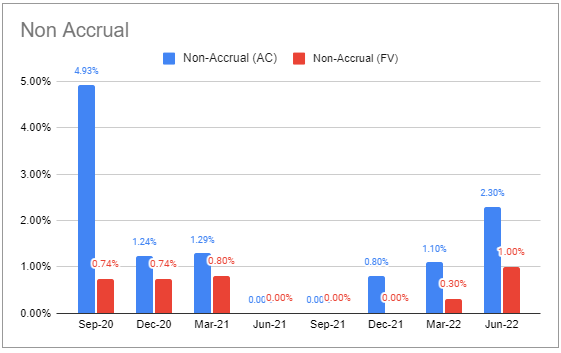
PIK income keeps moving lower and is now well below the sector average of 5.2%.
Systematic Income BDC Tool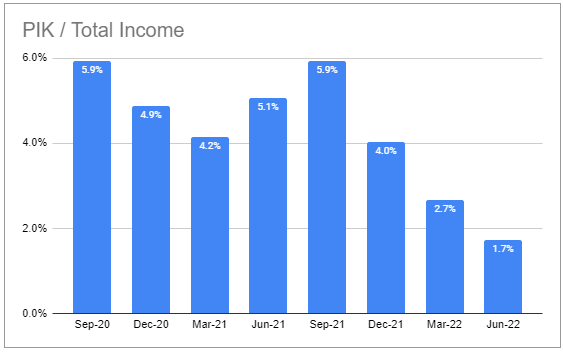
Internal portfolio quality ratings worsened slightly (i.e. blue bars in the right-hand chart rose). This is not out of line with the trend in the sector.
Systematic Income BDC Tool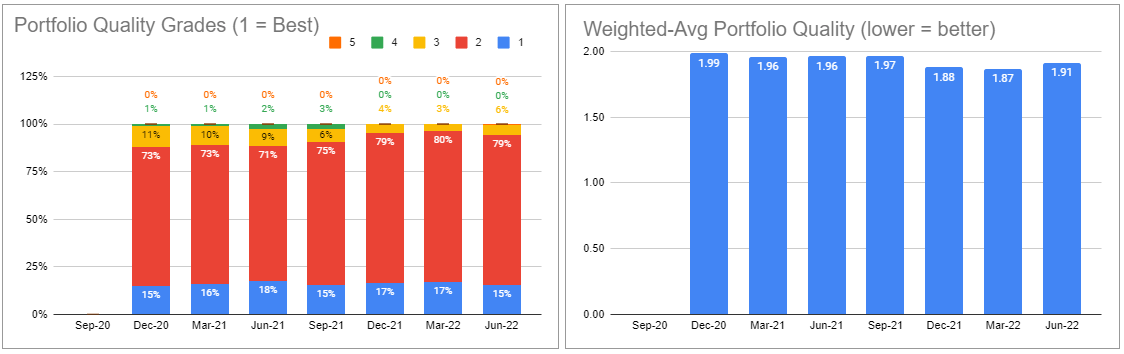
Return And Valuation Profile
There are a number of other BDCs that have the high returns of FDUS; however, in our view, what sets FDUS apart is the consistency of its performance. Over the last 8 quarters, FDUS has outperformed the sector in 7 of those quarters.
Systematic Income BDC Tool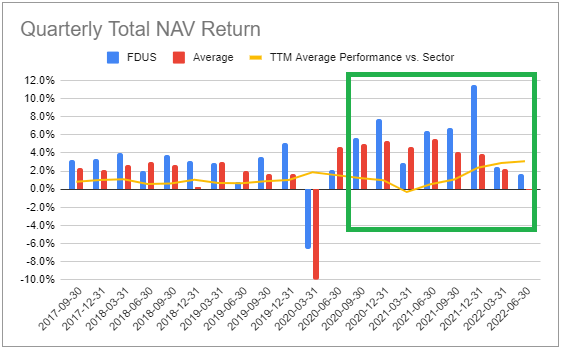
We like to compare returns and valuation together on the same chart as the two are obviously not independent. The chart below plots the 5Y total NAV return (y-axis) against the valuation i.e. price / NAV ratio (x-axis). The pattern is not exact but there is a clear relationship where BDCs with stronger historic returns tend to also boast a higher valuation.
Systematic Income BDC Tool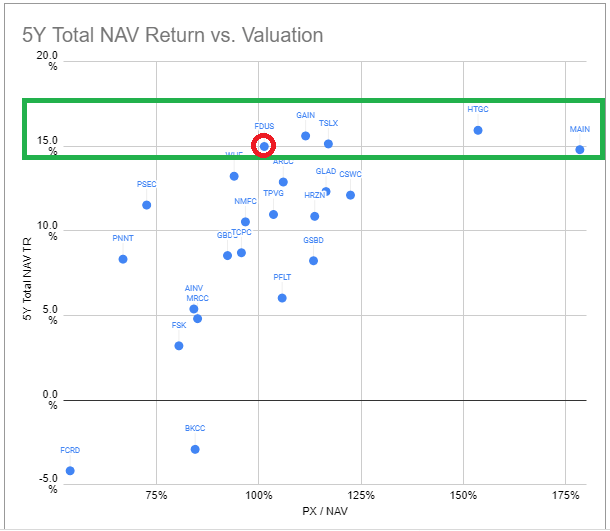
In the chart we highlight the set of BDCs that feature returns of around 15-17% per annum over the last 5 years in total NAV terms. What the chart clearly shows is that FDUS remains the lowest-valuation BDC in this group and by this metric it’s fairly cheap.
The chart above doesn’t make it clear at what point a given BDC is too expensive for its historic return. In other words, because investors earn their returns on the price rather than the NAV it is entirely possible to outperform higher-performing BDCs by allocating to BDCs with lower total NAV returns that also trade at a valuation cheaper than their lower historic performance implies. A way to combine valuation and total NAV returns is to simply divide the total NAV return by the valuation which we do in the following chart. What we see is that FDUS has the second best metric in our coverage universe.
Systematic Income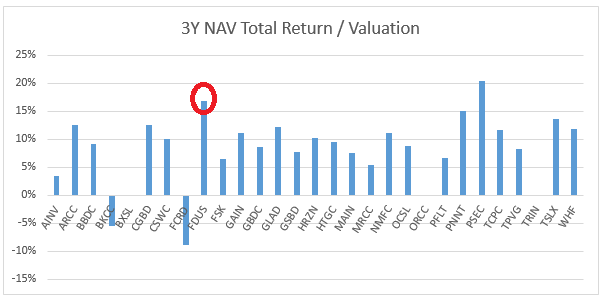
As far as the FDUS valuation over time, it is trading well above its historic average level.
Systematic Income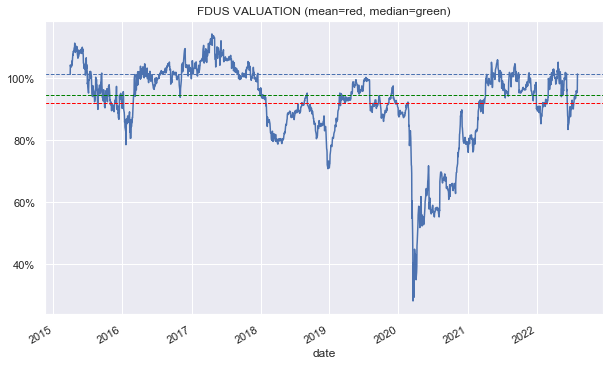
As the following chart shows FDUS used to trade at a lower valuation than the broader sector. Given its historic performance this didn’t make a lot of sense to us which is why we have held it since 2021. More recently this valuation gap has closed and FDUS has actually started trading above the sector average level.
Systematic Income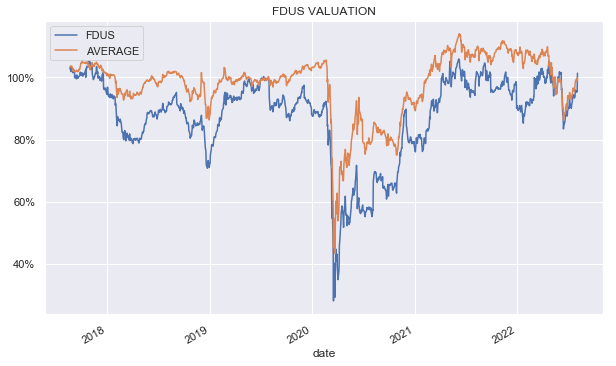
This chart which shows the valuation differential to the sector makes this clearer.
Systematic Income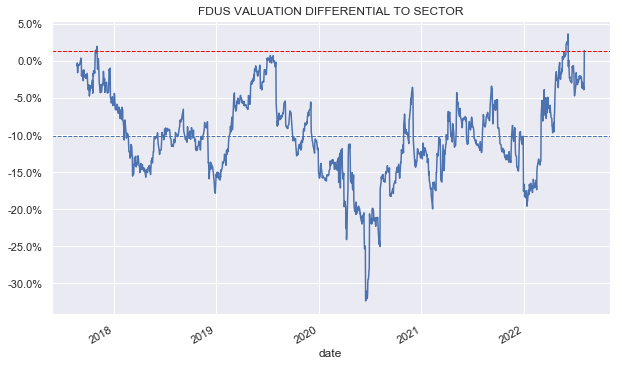
Whether its valuation is rich or cheap depends on whether you look at its historic pattern (by this metric FDUS is very expensive) or by its historic return (by this metric FDUS is still cheap).
Takeaways
In our view FDUS remains an attractive holding given its very strong and consistent historic performance as well as its diversification potential in a BDC portfolio. For instance, unlike BDCs like ARCC and OCSL which operate at the higher end of the middle-market sector, FDUS operates at its lower end. And unlike BDCs such as GBDC and OCSL which are focused primarily on debt holdings, FDUS retains a significant amount of equity in its deals – holding equity in about 80% of its investments. This can pose a risk if the market takes another swan dive but historically the company has maintained resilience over periods of market weakness. With its valuation rising sharply, we recently downgraded FDUS to a Hold from Buy but would look to add on weakness from current levels.
Be the first to comment