

caracterdesign/E+ via Getty Images
Introduction
One of my most important duties as a stock writer that specializes in cyclical stocks is warning investors about the downside potential that certain businesses and certain stocks have over the medium-term (which I define roughly as 2-5 years). Failing to understand both earnings and price cyclicality can lead to total disaster, especially for retail investors who are using traditional fundamental analysis for cyclical stocks and businesses. The reason for that is because using a basic fundamental metric like a P/E ratio, or a PEG ratio for a stock that has cyclical earnings can flash a ‘buy’ signal precisely at the wrong time, near the top of a cycle, or at the very beginning of a downcycle. Due to this fact, strategies and techniques for investing in cyclical stocks have to be different than those used for a less-cyclical business.
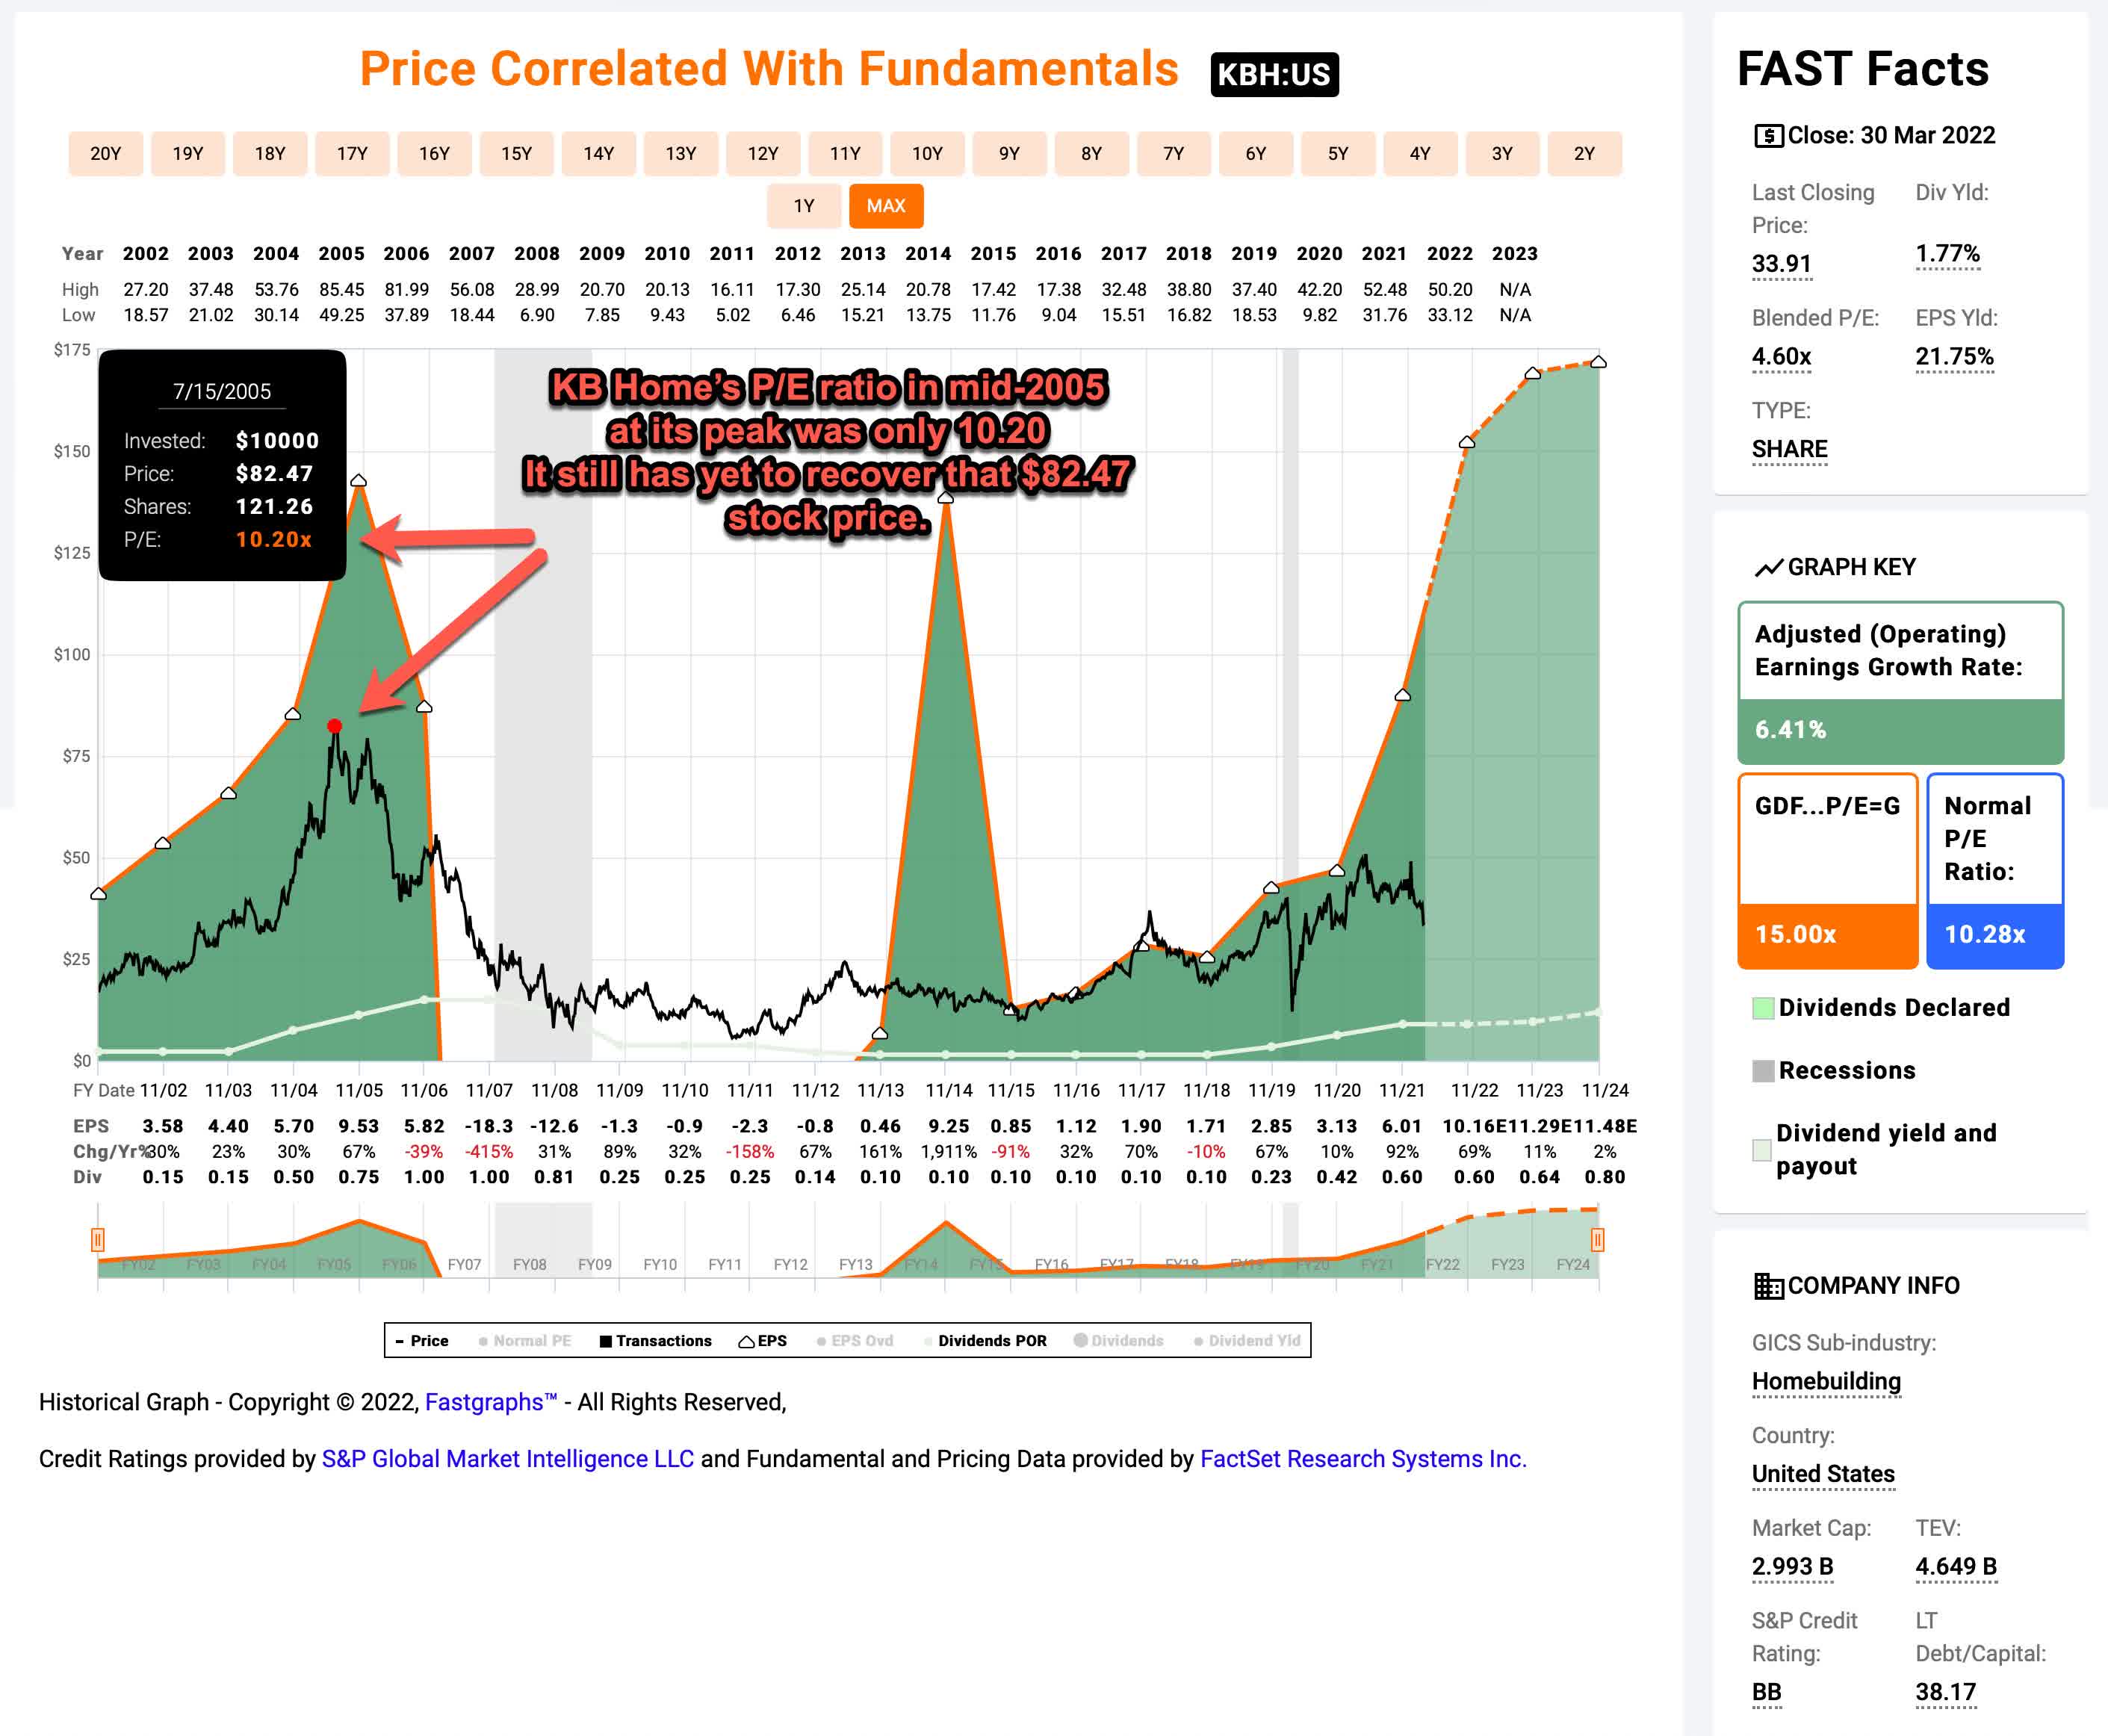
For example, home building is a cyclical industry, and starting in 2006 it went through one of its biggest downcycles in history. Let’s take a look at homebuilding stock KB Home’s (KBH) P/E near the peak of that cycle to see what sort of signal it was giving investors.
FAST Graphs
Leading into what was basically the biggest housing decline ever, one might have thought a homebuilder like KBH would have traded at a high P/E leading into the downcycle, but exactly the opposite was true. KBH was trading at P/E of about 10 near its peak with earnings growing well over 20% per year for several years in a row. Its stock price has yet to recover that peak 17 years later even though it looked like a good value in mid-2005. The reason for that is because the earnings or “E” part of the P/E ratio was inflated during the upcycle that occurred. One could not have known just by looking at traditional financial metrics KBH was at a generational high valuation. They needed to know whether earnings were likely to be deeply cyclical or not. And if they figured earnings were cyclical, then they either needed to avoid the stock or develop a different way to value it which didn’t rely on earnings trends.
How to identify a cyclical stock
My basic definition of a cyclical stock is one where earnings growth falls -50% or more during downcycles. So, for me, I need to have data from at least one full recession to have an idea of a business’s cyclicality. If I don’t have that data or it is not easily accessible, then I avoid any sort of earnings or fundamental-based analysis for the stock. While it’s true that often we can tell from what industry a business is in whether it is likely to be cyclical or not, my view is that real data from a real recession, specific to the individual stock, is the best way to know.
Obviously, there are gray areas around my -50% rule. Sometimes earnings fall in the -35% to -50% range, and in those cases, I know that earnings are moderately cyclical and I need to think about how I want to treat that stock. Other times, during one recession, earnings fall more than -50%, and during the next, they fall less than that. And in other cases, the businesses may have made an effort to reduce their cyclicality. In all of these edge cases, extra judgment must be used. But I almost always assume the stock price will behave similarly to how it has in the past, just to be cautious.
In the vast majority of cases, if we are dealing with high-quality businesses that generally keep earnings positive even in down years, the stock price tends to fall more than earnings do. If earnings look like they are cyclical, then the next thing I check is the stock price drawdowns. That will tell you the true downside you should expect in a good scenario where the business earnings and stock price eventually recover.
Fidelity National Financial’s Cyclicality
Whenever I run across a stock that has a lot of bullish coverage, but for which I see a lot of cyclical danger, I feel compelled to write about it and at least share that danger to holders of the stock so they have some idea of what is possible. During the past two years on Seeking Alpha, Fidelity National Financial (NYSE:FNF) has had two “Buy” articles, and 14 “Strong Buy” articles published on Seeking Alpha. In terms of articles with “Sell” ratings on SA, not a single one has ever been published on this platform. I am of the opinion that it’s always good for investors to know both the bull and bear case for a stock. Before I buy any stock, I always make an effort to find a good bear case so I know the dangers to look out for that I might not have thought about. That’s what I’m going to provide FNF shareholders, or potential shareholders, in this article.
What I’m going to share next is the process that I go through when I first consider whether a stock is something I might buy or not.
FAST Graphs
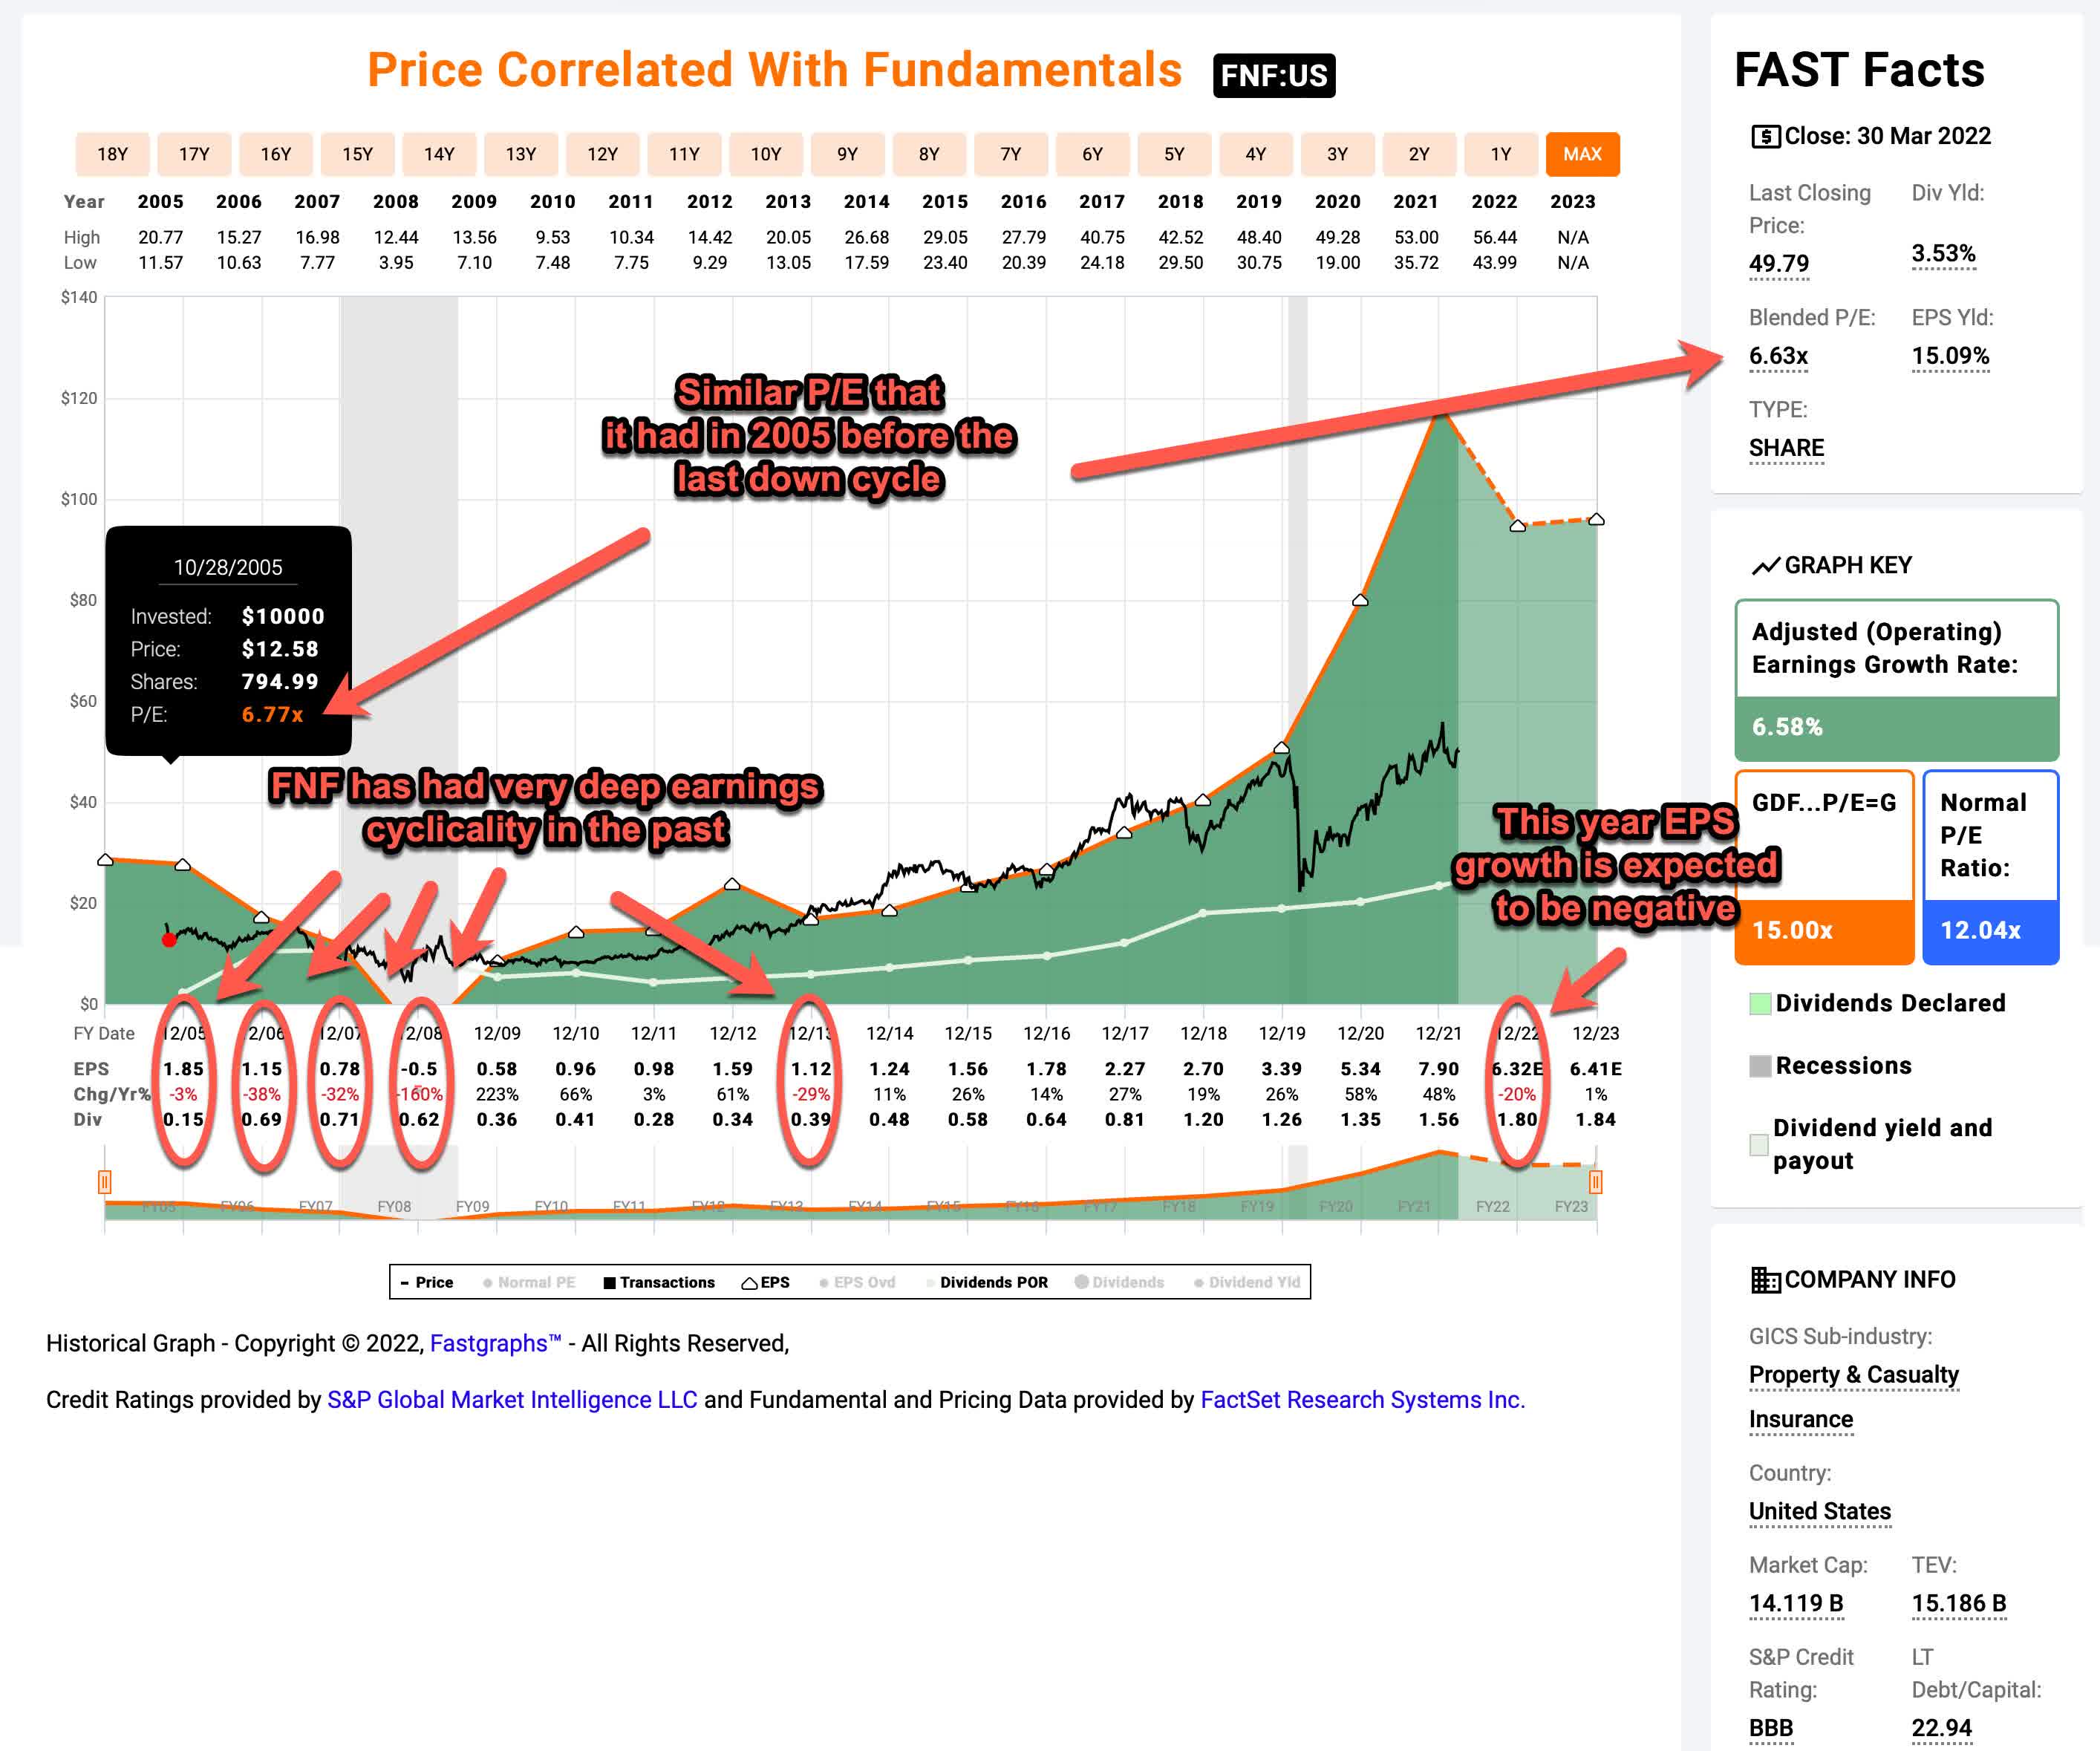
The first thing I always check is long-term earnings cyclicality, because, as I described earlier, that is the primary way I classify a business as cyclical or less-cyclical. In order to check this, we need an adequate time frame that includes at least one full recession (2020 was so unusual I don’t usually count it, but it can still sometimes be useful for extra color). It absolutely doesn’t matter what a business does at this point. All that matters are what earnings have done historically. FNF does have enough data, which goes back to 2005, in order to make some judgments about its earnings cyclicality. So that’s good. And what we see is a very deep, multi-year downcycle in which earnings ended with a fully negative earnings year in 2008. Based on this alone I would put FNF in the “cyclical business” category.
Next, because it is a financial company in the sub-industry of P&C Insurance, I want to see whether the earnings recovered in a timely manner, and also whether the stock price recovered in a timely manner. The thing with many financial companies like banks and insurance companies is, we really don’t truly have an idea of what their risks really are until there is a downcycle. So, when I see a bank or insurance company, for example, whose earnings fell deeply in 2008, and haven’t fully recovered, yet, then I avoid it because I know in the past they took on too much risk compared to the reward in premiums and/or interest they received. That tells me they do not have a good history of risk/reward management and I simply avoid the stock. Is that fair? Maybe not in some cases, but I don’t have the time it would take to truly understand the people running the companies and all the risks they might currently be taking that won’t be discovered until the next downturn. There are plenty of financial companies that have a good history I can focus on instead.
Fortunately for FNF, by 2012 or 2014 both the stock price and their earnings had mostly recovered from the downturn. This would be enough to get me interested in potentially investing in FNF as a cyclical stock. However, for deep cyclical stocks like this one, I require at least two downturns worth of data in order for me to take a chance buying it in the heart of a recession. While the rewards can be very big with cyclicals, they are also very dangerous to own and it takes a lot of courage to step in and buy near the bottom when it looks like the world is ending. Recessions all tend to be a little different. Sometimes a business can get through one type of recession okay but then succumb during a different type of recession. If I have observed that they made it through two recessions, however, the odds are usually pretty good they can make it through a third one. Since I only see data going back to 2005 for FNF, and because the business is cyclical, I simply avoided this one in 2020, and waited for more data to accrue over time.
But, since we technically have had a second recession 2020 and FNF’s earnings and price have recovered in a timely manner this time around as well, for the readers’ sake, I’ll explain what I would look at if I was thinking about buying or selling this stock right now.
Historical Price Drawdowns
Once I classify a stock as a deep cyclical, because earnings metrics are unreliable for valuation purposes, I turn to historical price drawdowns as my primary guide for what to expect in the future.
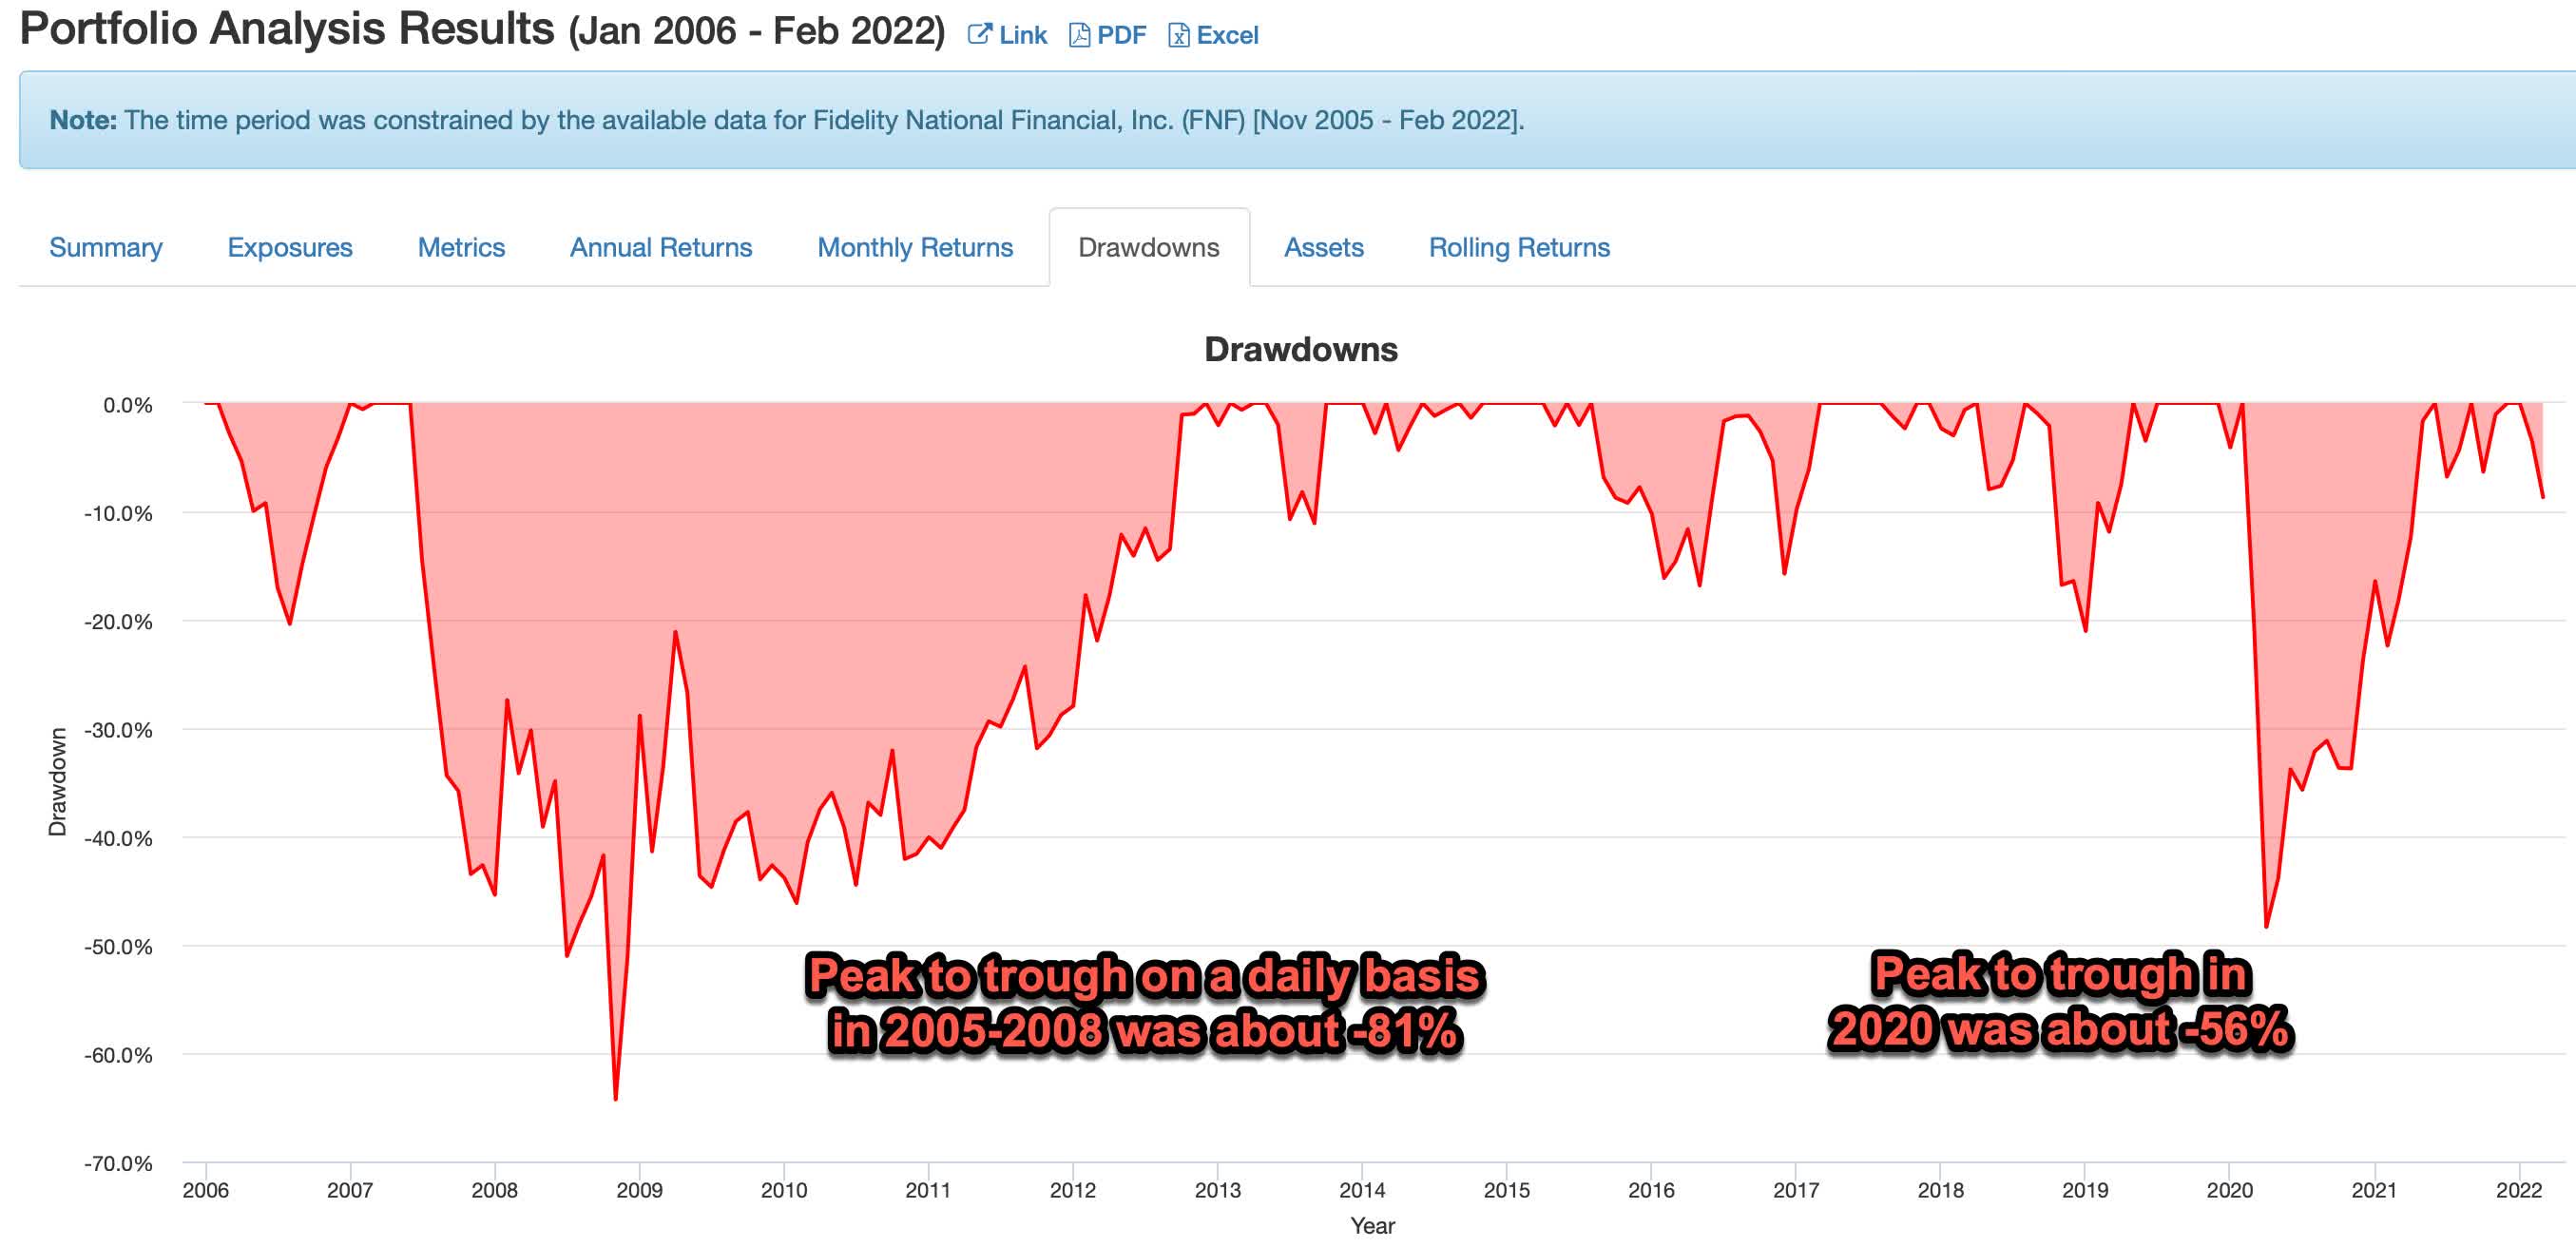
Porfoliovisiualizer.com
The historical price drawdowns in the above chart are monthly declines. I added annotations that include the daily peak to trough declines, which were deeper.
Below I included a more recent drawdown chart that compared FNF to the S&P 500 ETF (SPY) in order to get a relative comparison. (For some reason Y-charts wouldn’t pull older data.)
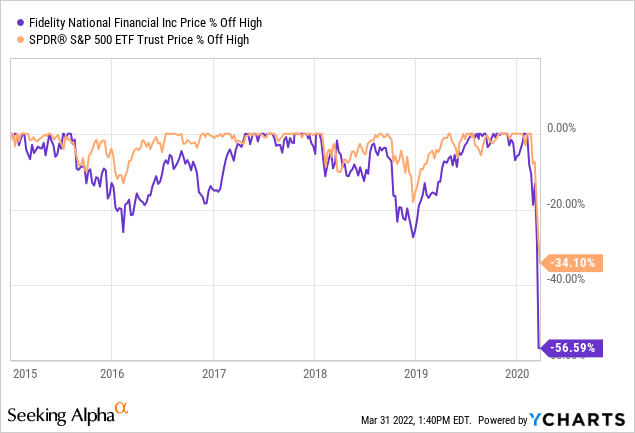
Whenever I share the drawdown data on a cyclical stock, I always have folks who think that this time is different and the past is not likely to repeat. And I think there is some truth to this, usually. If I was looking to buy FNF stock, for example, I would not wait for an -80% drawdown like the one that occurred in 2008, because a downcycle on the same scale of 2008 probably isn’t likely to happen. However, we can see from the two mild drawdowns in 2016 and 2018, that FNF’s stock price is significantly, and consistently, more cyclical than the S&P 500. And then in March of 2020, we get a real taste of the downside danger of this stock when it fell -56% in less than two months, almost twice as deep as SPY. If the market thought that things were really significantly different this time around, the stock would not have sold off that deeply.
Currently, FNF is trading at almost the exact P/E ratio that it peaked at in 2005, so it probably isn’t any more overvalued or undervalued than it was back then. So, my expectation is that the downside potential of this stock from here is somewhere between -60% and -80% off its highs if we have a recession in the next, say, two years. I probably wouldn’t be a buyer until the stock fell -65% off its high if everything else looked okay at the time other than the fact we were in a downcycle.
Conclusion
Understanding which businesses are cyclical and which are not is an essential skill that retail investors need to learn if they want to avoid deep drawdowns and value traps. I’ve found historical earnings patterns to be the most efficient and accurate way to determine business cyclicality. FNF has been deeply cyclical in the past and is therefore likely to be deeply cyclical in the future. With the Federal Reserve aggressively hiking rates, mortgage rates hitting highs not seen in years, and the 2-year/10-year yield curve recently inverting, investors should at least start getting cautious regarding the next bear market and/or recession. (In other words, we are likely closer to the top of the cycle than we are to the bottom.) This is a time to lighten up cyclical positions in most cases and if I was an owner of Fidelity National Financial, I would be taking profits around these levels and finding something more defensive to invest in.
Be the first to comment