

shaunl/E+ via Getty Images
FIDI strategy and portfolio
The Fidelity International High Dividend ETF (NYSEARCA:FIDI) has been tracking the Fidelity International High Dividend Index since 01/16/2018. It has 103 holdings, a 12-month distribution yield of 6.01% and a total expense ratio of 0.39%. It pays quarterly distributions.
As described by Fidelity, the index “is designed to reflect the performance of large and mid-capitalization developed international high dividend-paying stocks that are expected to continue to pay and grow their dividends.”
Over 87% of asset value is in large and mega-cap companies. The fund is currently invested about 18% in Canada and 18% in Japan. Other countries are below 13%. European countries have an aggregate weight of 54%. The next chart plots the top 10 countries, weighing about 90% of the portfolio. Hong Kong, which may represent a geopolitical and regulatory risk related to China, only has a 4% weight.
Country weights (Chart: author; data: Fidelity)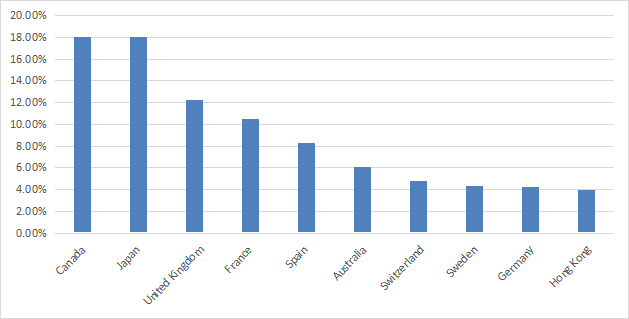
Financials are by far the heaviest sector in FIDI’s portfolio (25.4%), followed by energy (14.8%), materials (13.6%) and communication (11.5%). Other sectors are below 10% individually and 32% in aggregate.
Sector breakdown (Chart: author; data: Fidelity)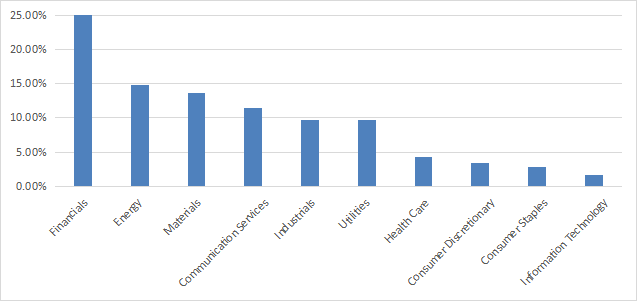
The next table compares FIDI’s aggregate valuation ratios with two of its closest competitors, both high-yield international equity ETFs: the Xtrackers MSCI EAFE High Dividend Yield Equity ETF (HDEF) and the iShares International Select Dividend ETF (IDV).
|
FIDI |
HDEF |
IDV |
|
|
Price/earnings TTM |
9.53 |
8.97 |
5.34 |
|
Price/book |
1.25 |
1.38 |
0.97 |
|
Price/sales |
0.83 |
0.9 |
0.89 |
|
Price/cash flow |
5.97 |
6.04 |
4.71 |
FIDI and HDEF look similar in valuation, while IDV is significantly cheaper regarding these metrics.
The top 10 holdings, listed below, represent 25.7% of asset value. The heaviest ones weigh about 3%, so risks related to individual companies are quite low.
|
Name |
Weight % |
Primary listing ticker |
|
BP PLC |
3.04 |
BP |
|
TotalEnergies SE |
3.02 |
TTE |
|
Endesa SA |
2.77 |
ELE |
|
Orange SA |
2.54 |
ORA |
|
Enbridge Inc |
2.48 |
ENB |
|
Repsol SA |
2.46 |
REP |
|
Nintendo Co Ltd |
2.39 |
7974 |
|
Power Assets Holdings Ltd |
2.38 |
6 |
|
Enel SpA |
2.32 |
ENEL |
|
Telefonica SA |
2.31 |
TEF |
Historical performance
Since February 2018, FIDI, HDEF and IDV are in loss by 6% to 20% in total return (dividends included and reinvested). FIDI is the worst performer by a significant margin, and it also has the deepest drawdown. In the same period, the S&P 500 (SPY) has returned 43%.
|
Total Return |
Annual Return |
Drawdown |
Sharpe ratio |
Volatility |
|
|
FIDI |
-19.68% |
-4.50% |
-43.95% |
-0.12 |
20.04% |
|
HDEF |
-6.20% |
-1.34% |
-36.87% |
-0.01 |
17.29% |
|
IDV |
-11.36% |
-2.50% |
-41.64% |
-0.02 |
20.47% |
|
SPY |
43.11% |
7.83% |
-32.05% |
0.52 |
18.12% |
FIDI vs. 2 competitors since inception (Portfolio123)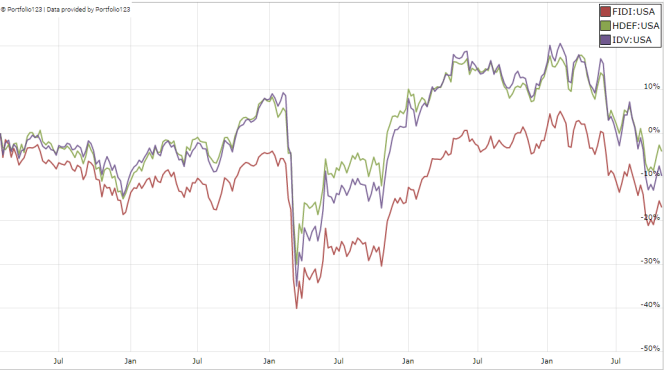
In 2022, FIDI is almost on par with HDEF and beats IDV by 5 percentage points.
FIDI vs. 2 competitors in 2022 (Portfolio123)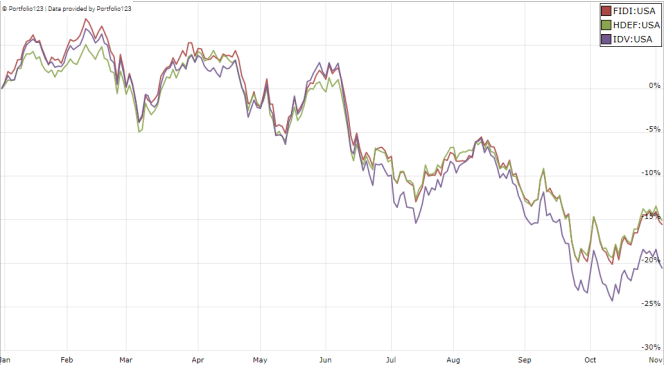
Takeaway
FIDI is an international high-yield equity ETF holding about 100 stocks of large companies, mostly in Europe, Canada and Japan. Financials are the heaviest sector with 25% of asset value. Since its inception in 2018, FDI has underperformed two of its close competitors in the same asset category, HDEF and IDV. It also shows a deeper maximum drawdown. I don’t expect it will perform better in a more complicated economic environment. For transparency, a dividend-oriented part of my equity investments is split between a passive ETF allocation (FIDI is not part of it) and my actively managed Stability portfolio (14 stocks), disclosed and updated in Quantitative Risk & Value.
Be the first to comment