

hallojulie
The Fidelity Dividend ETF for Rising Rates (NYSEARCA:FDRR) has an appealing name, due to the rapid interest rate increases we have experienced in the last few months. However, looking beneath the hood, the index selection methodology is complex and may be based on the faulty assumption that historical correlations between treasury yields and stock price performance will remain applicable in the future. Although the fund has outperformed the S&P 500 during the last few months, this outperformance has not been enough to offset years of underperformance. I would give this fund a pass.
Fund Overview
The Fidelity Dividend ETF For Rising Rates aims to provide exposure to stocks of mid to large-cap dividend paying companies that have a positive correlation of returns to increasing treasury yields.
Strategy
To achieve its investment objective, the FDRR ETF tracks the performance of the Fidelity Dividend Index for Rising Rates (“Index”). The index targets companies with high dividend yields and positive correlation to changes in treasury yields that can provide protection in a rising rate environment.
The index uses a composite scoring system based upon dividend yields, payout ratio, dividend growth, and correlation to 10-yr treasury yields (Figure 1).
Figure 1 – FDRR Index Methodology Composite Scores (Fidelity)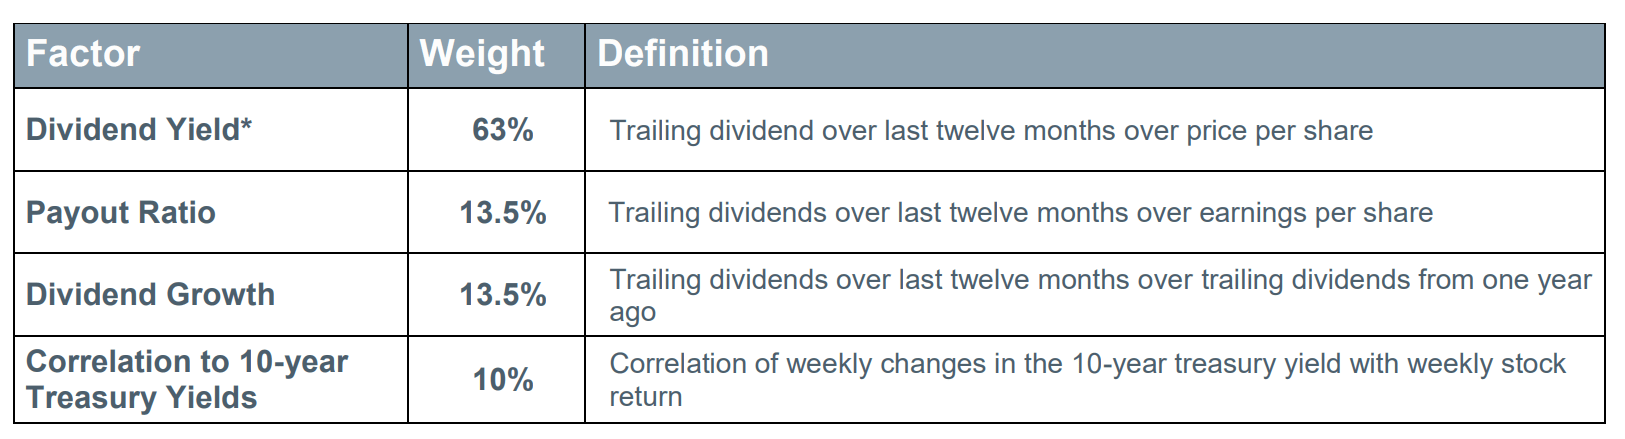
Stocks with the highest 5% payout ratios are excluded from the investment universe. International companies can represent up to 10% of the index.
The composite score is adjusted to minimize ‘size’ bias. Within each sector, securities are selected based on their size-adjusted composite score. If the sector has more than 100 securities, the top decile are selected. If the sector has 25-100 securities, the top quintile is selected. If the sector has less than 25 securities, all stocks are selected.
Within each sector, stocks are weighted based on their market cap, with an active ‘adjustment factor’ to avoid concentration based on market cap.
Portfolio Holdings
The result of the FDRR ETF’s complex index methodology is the portfolio shown in Figure 2. It contains 124 positions, with the top 10 positions accounting for 29% of the fund. Household names like Apple Inc. (AAPL) and Microsoft Corp. (MSFT) are top holdings of the fund. Healthcare names also show up as top holdings.
Figure 2 – FDRR Top 10 Holdings (Fidelity)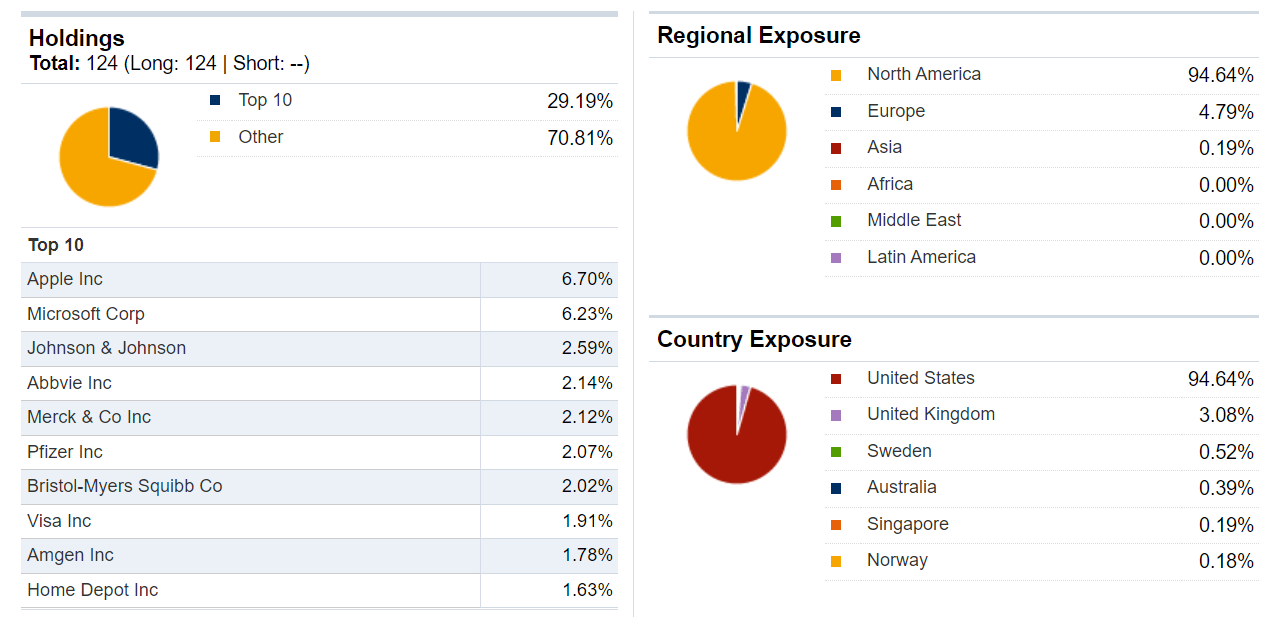
The fund’s sector exposure as of July 31, 2022 is shown in Figure 3. Contrary to other dividend funds that skew the portfolio towards defensive and value sectors, the FDRR’s sector weighting is kept close to the market’s weighting. The Vanguard S&P 500 ETF’s (VOO) sector weighting is shown in Figure 4 as a comparison.
Figure 3 – FDRR Sector Weights (FDRR Annual Report July 2022)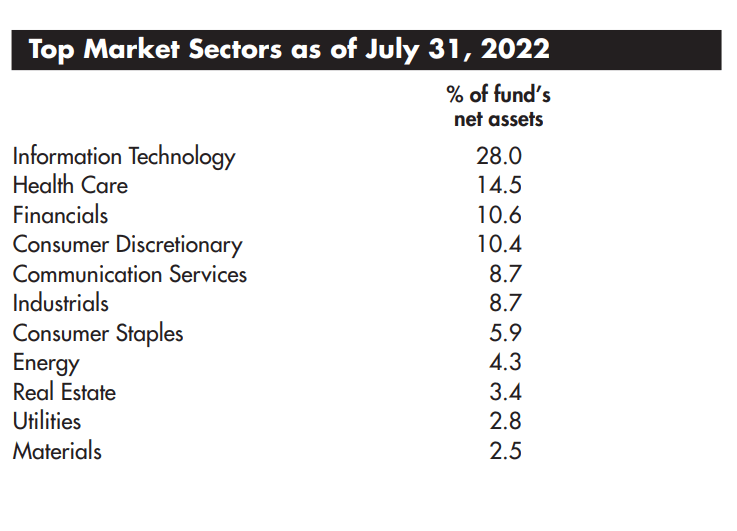
Instead, the FDRR weighs the holdings within each sector using the composite score methodology discussed above.
Figure 4 – VOO Sector Weights (Vanguard)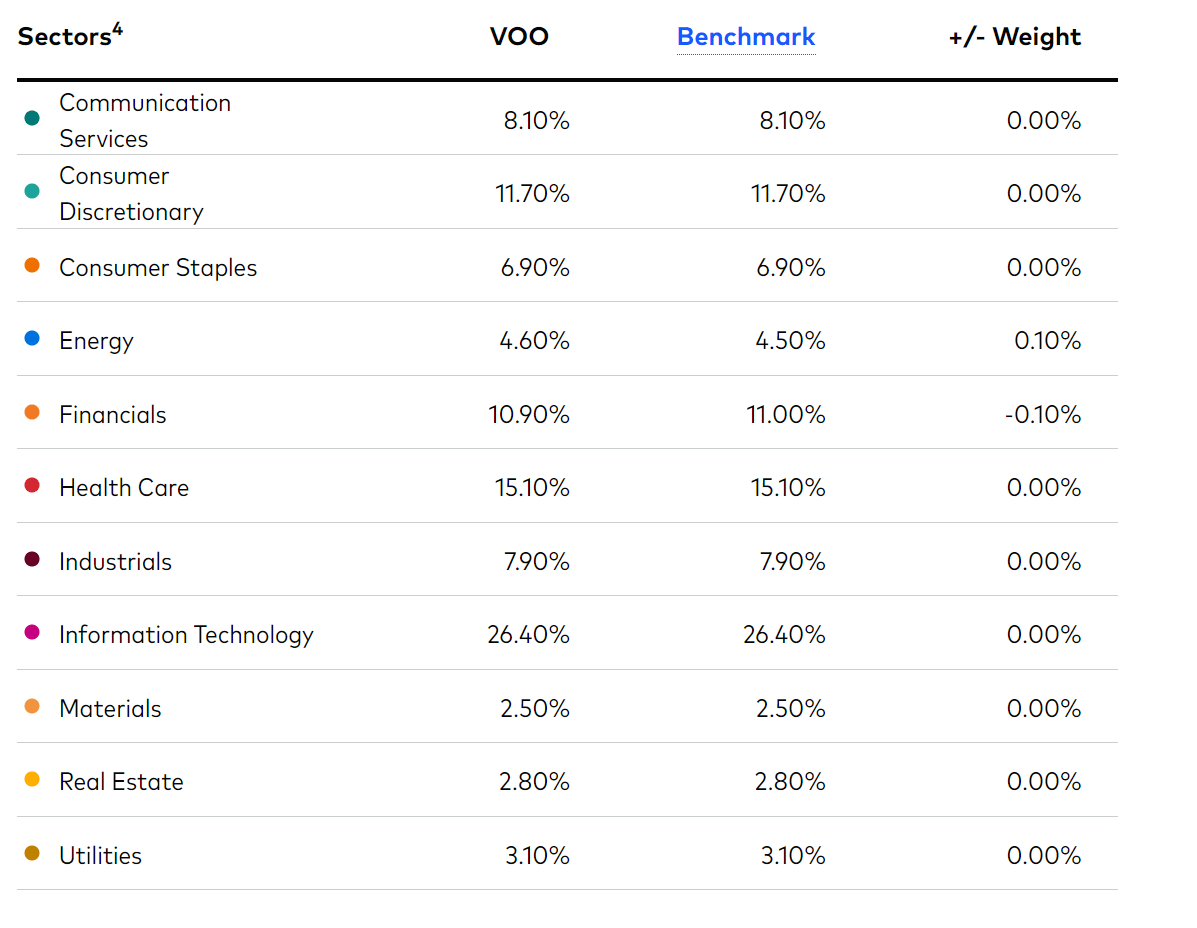
Returns
The FDRR ETF’s returns are shown in Figure 5. As of September 30, 2022, the fund had 1/3/5 Yr returns of -11.7%/6.2%/7.3%, compared to the S&P 500’s return of -15.5%/8.2%/9.2%.
Figure 5 – FDRR Returns (Fidelity)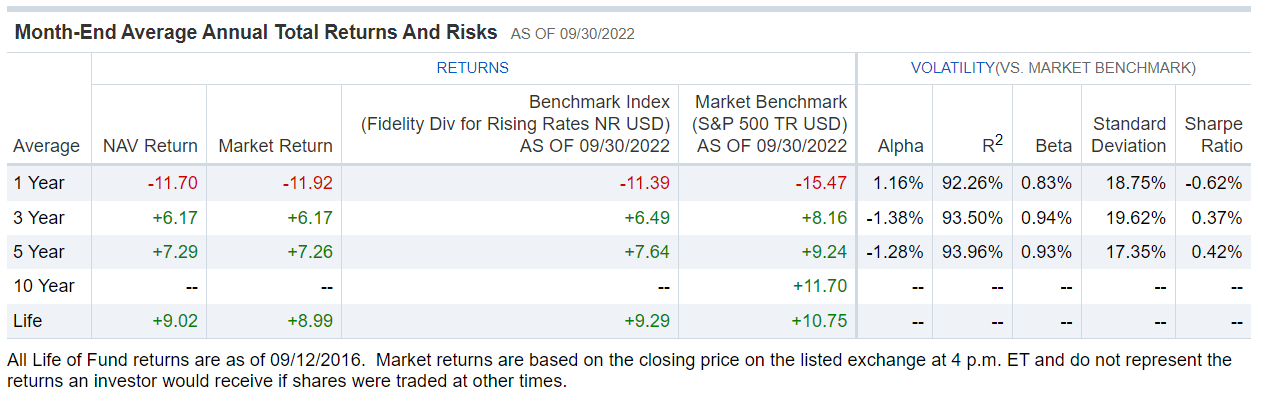
Distribution & Yield
The FDRR ETF pays a trailing 12M distribution yield of 2.9%, moderately above the S&P 500’s 1.7%. The distribution is variable and depends on dividends from the underlying portfolio. The most recent quarterly distribution of $0.293 / share was paid on September 21, 2022.
Figure 6 – FDRR Distribution Summary (Seeking Alpha)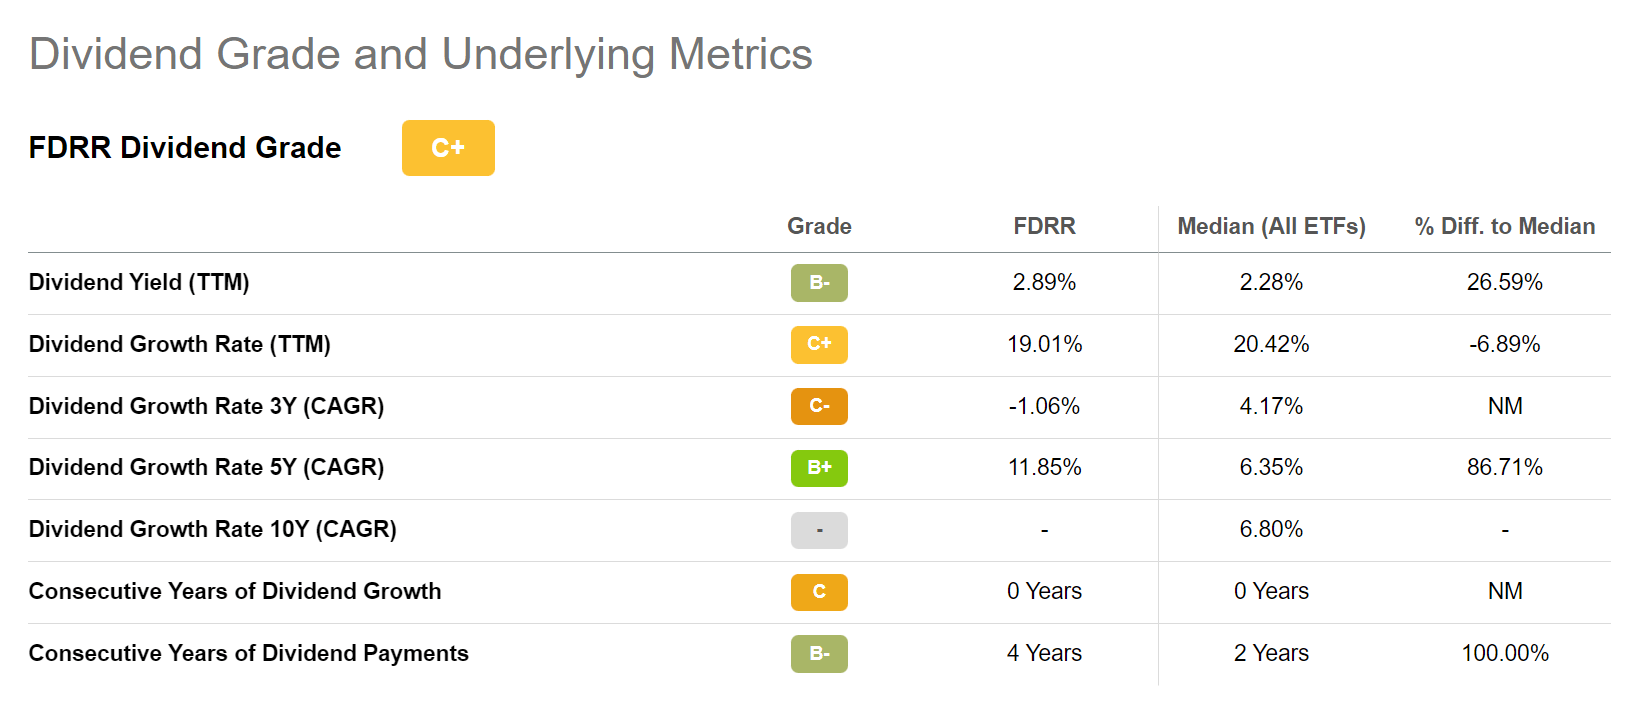
Fees
The FDRR ETF charges a 0.29% Net expense ratio.
Does It Really Protect Against Rising Interest Rates?
To be honest, after reading through the index methodology, I am not certain the small 10% weighting in the composite score does anything to protect the fund against rising interest rates.
First, correlation does not equal causation. Just because a security has been positively correlated to rising 10-year treasury yields in the past does not mean the correlation will hold in the future. Furthermore, the pace of yield increases matter, as we painfully learned this year, with the Fed increasing interest rates at the fastest pace ever and causing much of the pain in equity markets.
On a 1Yr basis, the 10Yr Yield has risen over 250 bps from 1.5% to over 4.0%. Yet the FDRR ETF has fallen by 11.7%, slightly better than the S&P 500’s 15.5% loss, but not enough to overcome prior period underperformance, so the fund still lags the S&P 500 on a 3 and 5 Yr timeframes.
Finally, the index methodology gives plenty of flexibility for the manager to adjust the weights as they see please. For example, the largest position in the fund is AAPL at 6.7%. This is essentially the same as the VOO ETF, where AAPL is held at a 6.9% weight. Microsoft is 6.2% in FDRR and 5.7% in VOO. Are AAPL and MSFT, with dividend yields of just 0.6% and 1.1% respectively, truly the highest composite scoring companies in the technology sector, or were they manually adjusted to match market weights such that the FDRR ETF does not deviate too much versus broad market ETFs like the VOO?
Conclusion
In summary, the Fidelity Dividend ETF for Rising Rates has an appealing name, due to the rapid interest rate increases we have experienced in the last few months. However, looking beneath the hood, the index selection methodology is complex and may be based on the faulty assumption that historical correlations between treasury yields and stock price performance will remain applicable in the future. Furthermore, a 10% weighting in a composite score is probably negligible in the grand scheme of things. Although the fund has outperformed the S&P 500 during latest rate increase cycle, the outperformance has not been enough to offset years of underperformance. I would give this fund a pass.
Be the first to comment