

SusanneB
Written by Nick Ackerman, co-produced by Stanford Chemist. This article was originally published to members of the CEF/ETF Income Laboratory on July 7, 2022.
Since the last time touching on First Trust Specialty Finance & Financial Opportunities Fund (NYSE:FGB), we’ve seen the discount widen and business development company prices fall. The discount was attractive before, but the widened discount with the combination of BDCs falling makes it more appealing now.
I believe this makes it a buy now for an interesting and more unique fund. That being said, this is a riskier fund, in my opinion. Risk-averse investors should probably avoid FGB.
BDCs are riskier investments, in general, because they invest in small and mid-sized businesses that are often at greater risk of failure during economic slowdowns. BDCs are leveraged up similarly to the majority of traditional CEFs. When you combine a modestly leveraged CEF with underlying positions that are usually heavily leveraged invested in below-investment-grade loans, the result is a riskier investment.
BDCs were holding up relatively well for most of the year. The unique characteristics of being primarily invested in floating rate debt while simultaneously running with fixed-rate leverage is a good hedge in a rising rate environment. They earn more income as the spread between leverage costs and earnings increases.
More recently, though, the realization that a recession is either here or could be here before too long has meant a sell-off in BDCs. Below are the YTD performances of FGB and the VanEck BDC ETF (BIZD) for some context.
Ycharts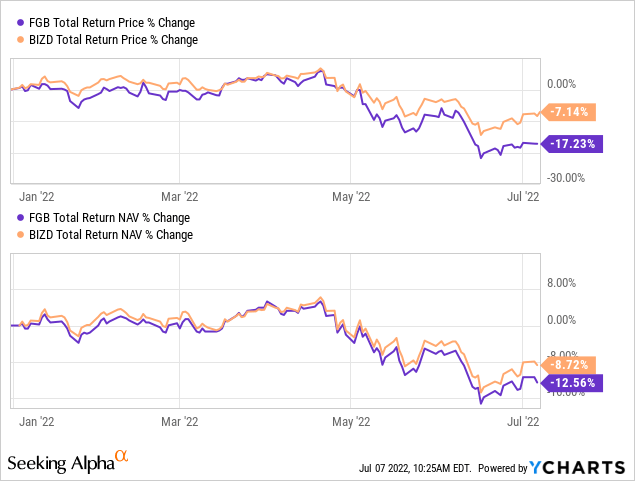
The Basics
- 1-Year Z-score: -2.15
- Discount: 13.41%
- Distribution Yield: 10.19%
- Expense Ratio: 1.49%
- Leverage: 13.81%
- Managed Assets: $62.285 million
- Structure: Perpetual
FGB has an investment objective to “seek a high level of current income. As a secondary objective, the fund seeks an attractive total return.” To achieve this, the fund will “invest, under normal market conditions, at least 80% of its managed assets in a portfolio of securities of specialty finance and other financial companies that the Fund’s sub-advisor believes offer attractive opportunities for income and capital appreciation.”
The fund is quite small. That means larger investors might not feel comfortable investing in this fund. Additionally, those investors that want to get in and out of funds quickly might not get that opportunity. The daily average trading volume comes to around 40k. That might seem okay, but for a share price of $3.24 at the last close, that’s only around $132k in daily moving dollars.
As mentioned above, this leverage on leverage amplifies the potential upside and the downside. We saw the significant damage this could do when the fund had to deleverage during 2020. They went from a loan outstanding of $25 million to $6.5 million. More recently, this is back up to $8.6 million.
The fund’s expense ratio comes to 1.49%, with leverage costs increasing it to 1.78%.
FGB Expense Ratios (First Trust)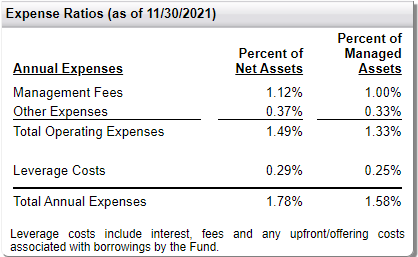
While BDCs often have fixed-rate borrowings, traditional CEFs do not generally have fixed rates. This is the case with FGB as they borrow at 1-month LIBOR plus 85 basis points. Therefore, higher rates mean higher interest expenses for this fund.
Performance – Discount Expands
As we showed above, the fund is now down quite meaningfully YTD after holding up well through most of the year when everything else was falling. The primary driver of this is the potential for a recession – either in one currently or expected to be in one within the next year. The underlying portfolio will be negatively impacted as the smaller, more financially weaker companies struggle to pay their debts.
I believe that is what is primarily being priced in at this time. Given the fund’s discount has expanded even further since the last time we touched on the fund, it means that more is being priced in on that basis too. So we have the discount expansion and price decline combining to make it a more tempting fund despite the risks, as I believe most of this risk is now being reflected.
2020 was certainly a wild time for the fund, given it was then the fund experienced both its highest premium and lowest discount. Over the last decade, the fund has averaged only a slight discount. That makes the nearly 13.5% discount at this time quite significant.
Ycharts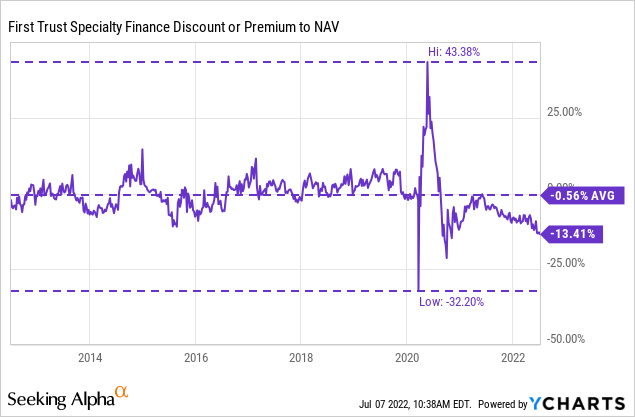
FGB is in Stanford Chemist’s Tactical Income-100 Portfolio. I believe this is for a good reason too. We can see that over the longer term, FGB has fallen significantly short of BIZD’s performance. Except, there were times to make some really good money in the name, tactically, when the fund’s valuation has made sense.
We also see that the significant outperformance really didn’t kick in until 2020. That’s precisely when they had to massively deleverage compared to the ETF, which had no leverage to worry about.
Ycharts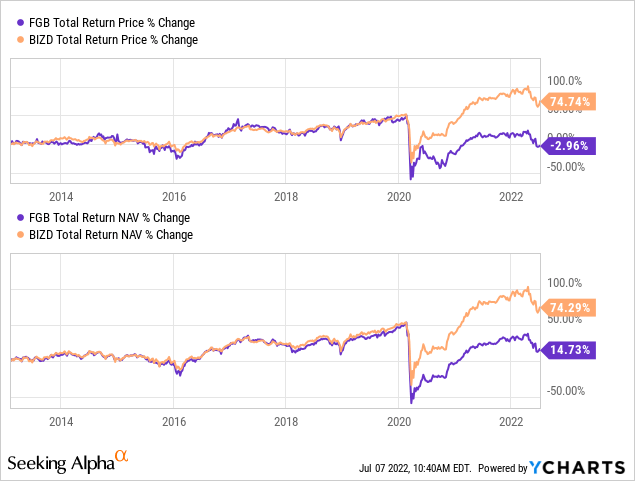
Distribution – Attractive 10%+ Yield
The fund pays quarterly for some income investors, which isn’t as appealing as the more frequent monthly payout. At the same time, the fund’s distribution yield is quite attractive at 10.19%. Due to the fund’s discount, the fund’s NAV rate comes to 8.82%. Investors can receive more than what the fund has to earn.
FGB Distribution History (CEFConnect)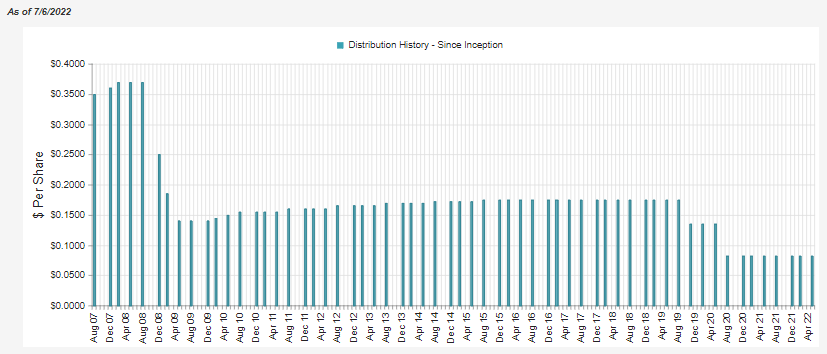
The fund has cut its distribution several times. Most notably, we expect a riskier fund to cut its payout in the periods we see above. That was in 2008/09 and 2020. The fund had the privilege of launching in mid-2007, right in time to get crushed by the great financial crisis. No doubt, that’s one of the other reasons investors don’t want to invest in the fund. They will simply look at a chart and see how much it has declined since it launched. Without taking into account how much the timing of the launch had negatively impacted the fund.
We will get a new report in a month or so showing the updated earnings (net investment income and gains/losses) for FGB. For now, the previous update is still the latest coverage. That showed that NII coverage was around 80% in the last fiscal year. The next report isn’t likely to have NII increase significantly until BDCs start meaningfully increasing their own distributions. That could come when they start receiving higher earnings from higher rates.
For tax purposes, the fund often distributes out payouts classified as ordinary income. Of course, this results from the BDCs paying mostly interest payments as they overwhelmingly hold loans. These interest payments then get passed through to investors in FGB. This would make it more appropriate for a tax-sheltered account.
FGB Annual Report (First Trust)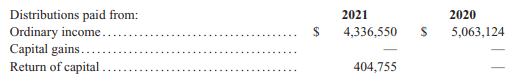
FGB’s Portfolio
The bulk of the portfolio remains in BDCs, as has been the case since I’ve followed this fund in the back half of 2020.
FGB Asset Breakdown (First Trust)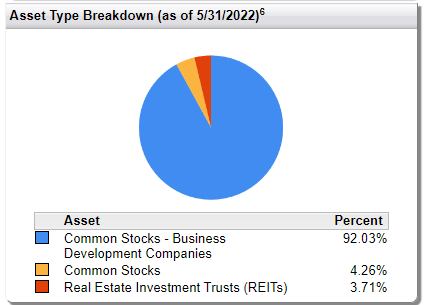
The fund has a fairly low turnover. Seeing the same breakdowns and holdings is going to be common in every update of the fund. Last fiscal year, they reported an 8% turnover, and in the last five years, it has been only as high as 20% in 2020. That could have resulted from the forced selling they were required when deleveraging their portfolio.
The world of BDCs is relatively small. For traditional CEFs, there are around 460. For publicly traded BDCs, there are around 50. Therefore, it isn’t too surprising to see how concentrated FGB is when it comes to the top ten. According to CEFConnect, FGB holds only 29 positions. The top ten represent nearly 63% of the portfolio.
FGB Top Ten (First Trust)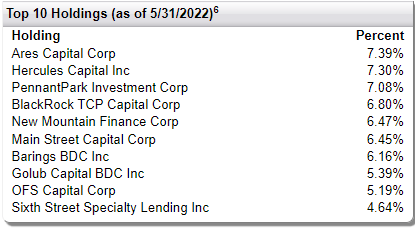
That being said, BDCs themselves are often made up of a number of different holdings too. Ares Capital (ARCC) is the largest BDC and holds hundreds of different investments on its own. Not all BDCs carry quite that many different positions. OFS Capital (OFS) carries a portfolio invested in 75 different portfolio companies as an example of a smaller BDC. That means that the fund is more diversified than it might originally appear.
Hercules Capital (HTGC) was the largest position in the fund previously. This has now been replaced with ARCC. The biggest contributing factor to this change seems to have been the performance of the two BDCs during the time period of the updates.
Ycharts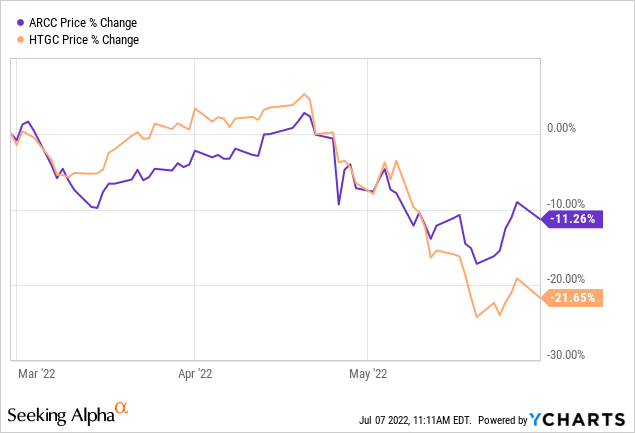
Conclusion
Today’s update on FGB was primarily to call attention to the widening discount and BDCs succumbing to price declines across the board. They had been holding up relatively well given the environment of higher interest rates. I believe this combination has made FGB a tempting but riskier position to consider.
Higher rates often help BDCs because it means the underlying loans that are primarily floating rate in nature will receive higher income. The other side of the equation is that BDCs often have higher portions of their leverage at fixed rates. Packaging up leveraged BDCs and then applying more leverage on top of it via FGB means we are looking at a higher-risk investment.
Be the first to comment