

DNY59/E+ via Getty Images
Investment Thesis
Last month saw the launch of the Federated Hermes U.S. Strategic Dividend ETF (NYSEARCA:FDV), an actively-managed offering with a net 0.50% expense ratio (0.60% gross) that aims to pay relatively high distributions and limit downside risk. These objectives sound familiar, and you may have skipped Seeking Alpha’s press release as soon as you learned of the high fees. Furthermore, FDV is entering a highly competitive space with well-known ETFs like SCHD and VYM managing billions of dollars in assets.
While I will reserve judgment until I see how FDV’s managers adapt to changing market conditions, my initial analysis reveals only a 3.35% expected dividend yield, low expected sales and earnings growth, and only average profitability. Therefore, there’s no need for investors to rush in, and I look forward to explaining why in further detail below.
ETF Overview
Strategy Discussion
According to its fund profile page, FDV’s objective is to seek “income and long-term capital appreciation by investing primarily in high dividend-paying U.S. stocks with dividend growth potential.” According to the fund’s prospectus, the adviser considers high-dividend-paying U.S. stocks to be those yielding above the S&P 500 Index (approximately 1.60%), though dividend growth potential isn’t well-defined. Furthermore, large- and mid-cap stocks may be selected, defined as companies with market capitalizations above $7 billion and $2 billion, respectively. These are roughly the mid-and small-cap thresholds for S&P Dow Jones, so it will be interesting to see how much exposure FDV has to these smaller companies. The prospectus also provides insight into how its managers select companies. I’ve listed some highlights below.
- the focus is on less-risky high-dividend-paying companies
- the process is primarily driven by bottom-up fundamental research
- companies with strong dividend yield and growth potential are prioritized
- balance sheet strength, earnings growth, and cash flow are factors used
- management commitment to the dividend
As an ETF analyst who has covered nearly every U.S. dividend ETF on the market, the low-volatility objective is easiest met by focusing on large-cap stocks. Furthermore, large-cap companies most likely have the best balance sheets and cash flow statements, so I expect a large-cap bias.
Sector Exposures and Top Holdings
Unfortunately, Federated Hermes still needs to feature basic information on the ETF on its website. Simple things like sector exposure graphs and top ten holdings lists help investors learn about the fund before buying.
Federated Hermes
Still, the daily holdings list is available, and I’ve done some organizing of my own based on Global Industry Classification Standards. The table below summarizes FDV’s sector exposures and the top five holdings in each sector.
The Sunday Investor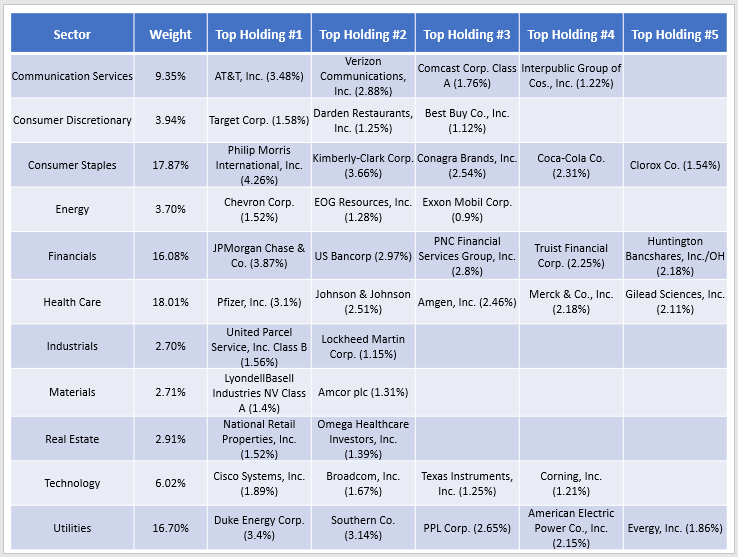
Diversification looks reasonable, with all sectors representing less than 20% of the portfolio. Consumer Staples and Health Care are about 18% each, followed by Utilities at 17% and Financials at 16%. A few less-risky Technology stocks like Cisco Systems (CSCO) and Broadcom (AVGO) are also included. The top ten holdings, which total 33.57%, are below.
- Philip Morris International (PM): 4.26%
- JPMorgan Chase & Co. (JPM): 3.87%
- Kimberly-Clark (KMB): 3.66%
- AT&T (T): 3.48%
- Duke Energy (DUK): 3.40%
- Southern Company (SO): 3.14%
- Pfizer (PFE): 3.10%
- US Bancorp (USB): 2.97%
- Verizon Communications (VZ): 2.88%
- PNC Financial Services Group (PNC): 2.80%
These ten companies have a 4.36% average forward dividend yield. The following ten holdings average 3.30%, 3.59%, 4.51%, then 3.08%. Based on this distribution, yield isn’t necessarily the driving factor, nor is dividend growth. These ten companies have an average five-year dividend growth rate of just 6.31%, which is low for a dividend ETF.
ETF Analysis
Backtested Performance
Since hardly any performance data exists for FDV, I’ve backtested the current portfolio as much as possible against SCHD and VYM. Below are the results since July 2019, assuming monthly rebalancing to current weights.
Portfolio Visualizer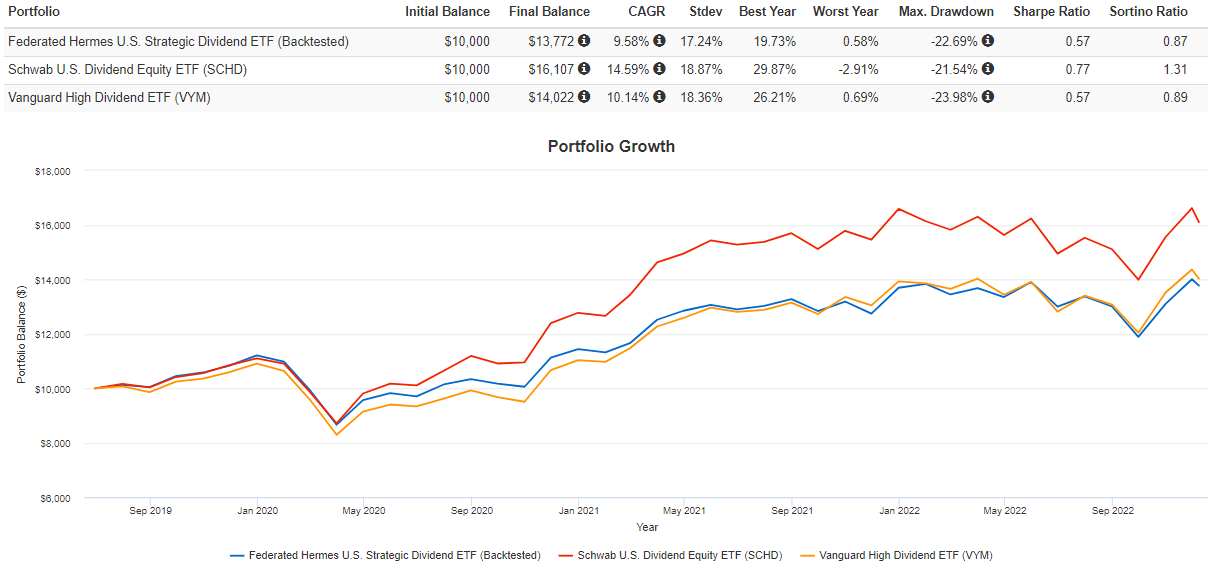
This chart suggests that FDV’s approach may result in slightly lower volatility, as measured by standard deviation, but probably not much lower than what cheaper passive ETFs offer. This portfolio’s 9.58% annualized returns were much worse than SCHD’s 14.59% without the 0.50% expense ratio reduction. The current portfolio may have a growth problem, as is standard with low-volatility dividend ETFs.
I caution that relying on backtested results is likely inappropriate, especially with actively-managed portfolios. These poor historical results may be why managers selected them because they view them as solid value plays. I only took this step to better understand the thought process of the current selections. I don’t know how active FDV managers will be, but based on the graph above, they aren’t betting that the last few years will repeat.
Fundamentals By Company
Backtested results are biased, but examining a portfolio based on its fundamentals is not, and that’s where I’d like to take this analysis next. Federated Hermes has a proprietary strategy, but I have assessed the portfolio based on numerous metrics that I’ve found to be good predictors of future performance. Here is how FDV stacks up against SCHD, VYM, and the TrueShares Low Volatility Equity Inc ETF (DIVZ), another new actively-managed ETF I’ve covered.
The Sunday Investor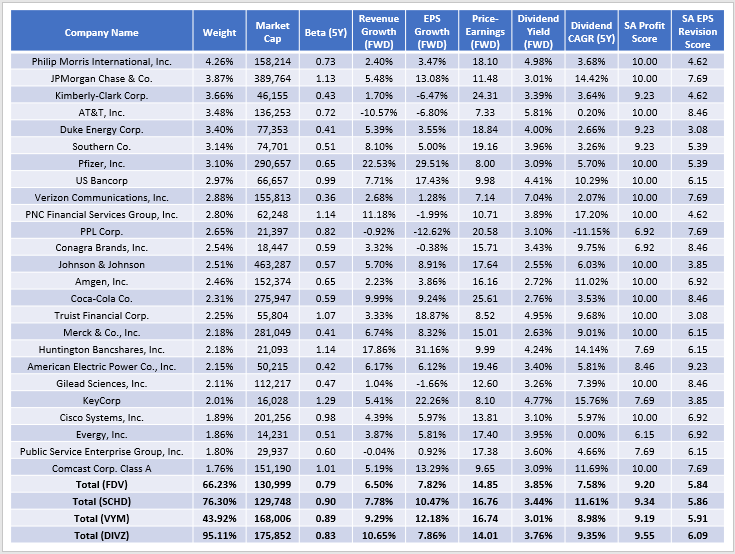
First, FDV’s weighted-average market capitalization is $131 billion, consistent with my expectation that low-volatility dividend companies are often larger. Only five companies have market capitalizations below $15 billion (EVRG, NNN, VTRS, OHI, IPG), and only Evergy is in the top 25 above. The $2 billion minimum figure in the prospectus was likely to allow managers flexibility, but in practice, I think FDV will remain primarily a large-cap dividend ETF.
Second, The portfolio’s 0.79 five-year beta is the lowest of the four, so FDV may provide some nice downside protection benefits. One advantage I see over DIVZ is that its portfolio managers don’t need to worry as much about volatile Energy prices. Total exposure is just 3.70% compared to 20.79% for DIVZ, so the two have very different outlooks on the sector. Sadly, my target weight of 10% lands in the middle, so neither portfolio looks ideal.
Third, I’m skeptical that FDV prioritizes dividend growth, given how its current constituents have only increased their dividends by an annualized 7.58% over the last five years. That’s 4.03% lower than SCHD and a percentage point or two behind VYM and DIVZ. Many low-dividend-growth stocks are near the top, like Philip Morris and Kimberly-Clark. Estimated sales and earnings growth rates are in the single digits or worse, and as a portfolio, FDV has a 6.50% and 7.82% estimated sales and earnings growth rate. That’s not enough to sustain strong dividend growth, so I’m disappointed in these results.
Fourth, FDV’s expected 3.85% dividend yield looks excellent on paper, but that’s before fund expenses like the 0.50% expense ratio are deducted. Therefore, a rough estimation of 3.35% is reasonable, but readers also need to be aware of the strong possibility of dividend dilution with a new ETF. If FDV were to experience a surge in demand and create more ETF units after the fund has collected the distributions from its underlying holdings, those distributions would have to be spread across more units, resulting in dilution. Either way, a 3.35% yield isn’t great, considering that SCHD’s constituents yield 3.44% (3.38%) after fees, and it has much better sales, earnings, and dividend growth potential.
Finally, FDV’s selections aren’t necessarily higher quality, either. Its weighted-average 9.20/10 Profitability Score is on par with VYM but lower than SCHD and DIVZ. Quality is high, but that’s true for most large-cap dividend ETFs, so I don’t want readers fooled into thinking it’s a unique factor. Furthermore, its 5.84/10 EPS Revision Score is the lowest of the four ETFs, suggesting weaker sentiment on Wall Street. Philip Morris International is one example. The company missed earnings expectations last quarter, and 25% of analysts have revised next quarter’s earnings downward. The company may be considered a deep-value play, but its stock price has declined by 4.25% over the last five years. It is difficult to understand why it’s FDV’s top holding. Notably, it’s not included in SCHD and is only VYM’s 26th-largest holding.
Seeking Alpha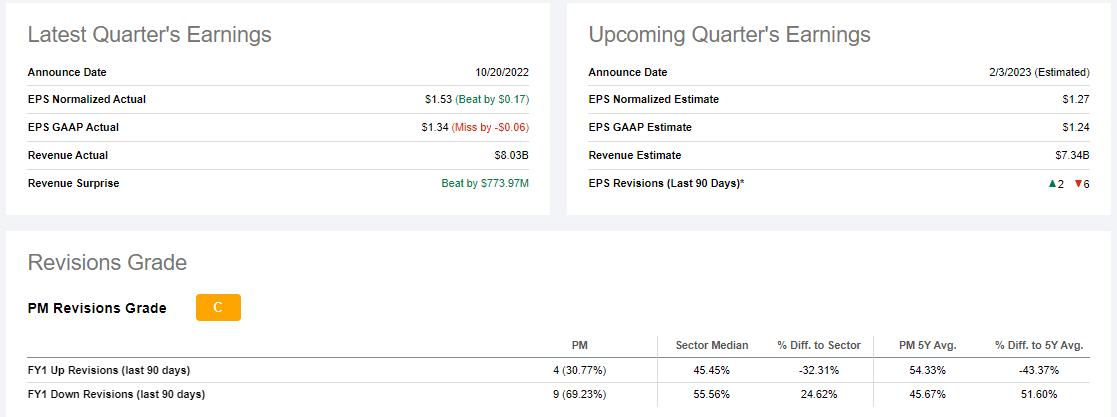
Investment Recommendation
FDV aims to select high-dividend-paying U.S. companies with strong dividend growth potential, but my fundamental analysis indicates the current selections could be better. High-fee, actively-managed dividend funds have an uphill battle since those fees directly reduce the distributions shareholders seek. Furthermore, dividend growth isn’t supported because its current constituents have low estimated sales and earnings growth and aren’t of higher quality than what passive alternatives like SCHD and VYM hold. Though it’s still early and active managers have complete discretion to adapt as needed, I’m not impressed with these selections and don’t recommend investors buy FDV.
Be the first to comment