

buzbuzzer
Federal Realty (NYSE:FRT) is an old-line shopping center REIT that I have long admired, but never wanted to buy as it consistently traded at a premium. After decades of high valuation this REIT has finally gone on sale, now trading at a reasonable 14.5X FFO multiple and just over 80% of net asset value (NAV).
FRT prides itself as having strong properties in strong locations and for the most part the data backs up their claim. If you like investing in gateway MSAs, FRT is a good way to get that exposure with its mix of quality and value.
Property portfolio
FRT’s portfolio looks significantly different than that of shopping center REIT peers. They focus on particularly large properties. With just 104 properties they own 25 million leasable square feet indicating an average property size of about 240 thousand square feet. That would be a large industrial warehouse, but is particularly large for shopping centers.
At the Bank of America Conference on 9/13/22 FRT describes their affinity for large properties being rooted in the redevelopment opportunities that they present. With that much area they can consistently find ways to enhance properties after purchase to improve NOI. Its current improvement pipeline is $1.3 billion.
S&P Global Market Intelligence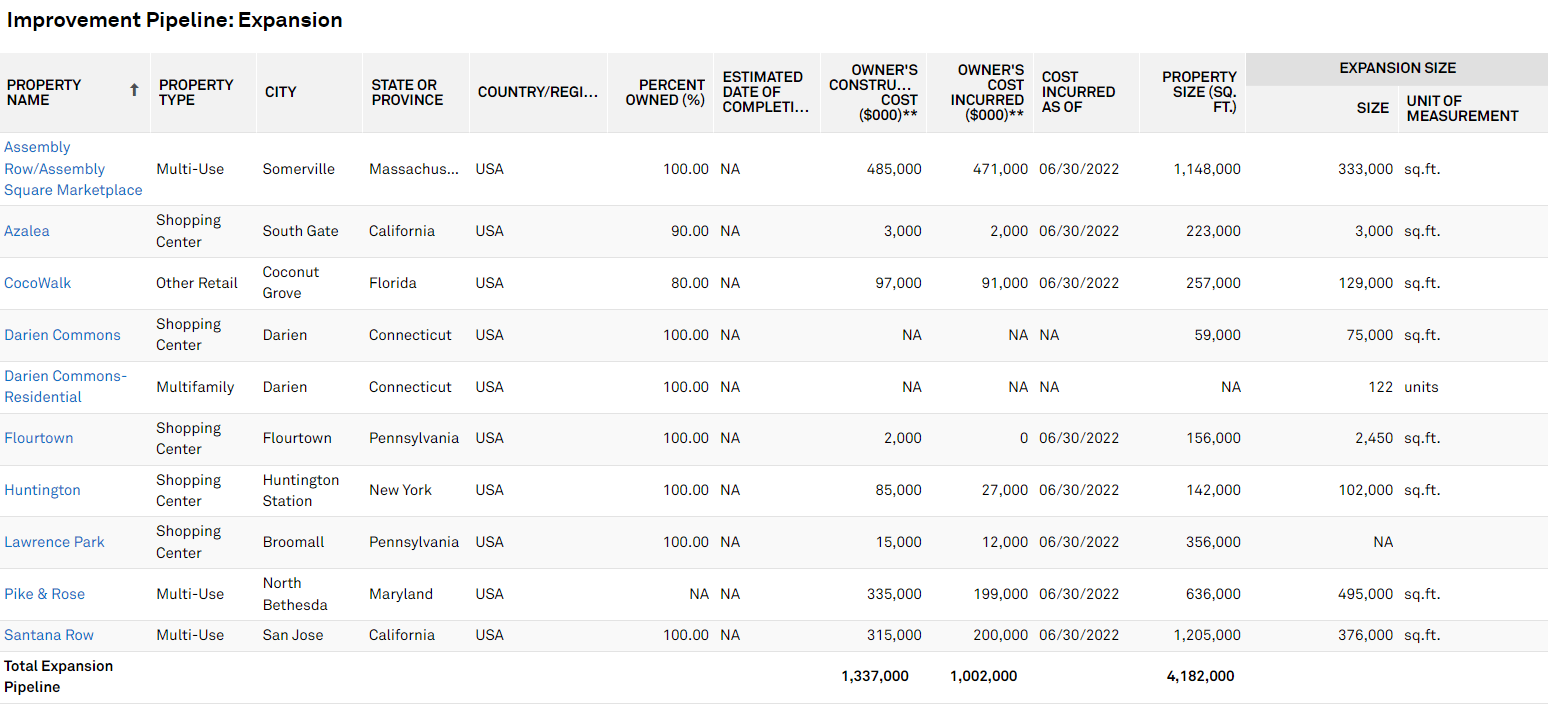
As these complete it will likely cause a nice bump to FFO/share as $1B of the expenses have already been paid.
Beyond the size of the property, FRT is quite particular about where it acquires. Their portfolio is located in high income and high population density areas as highlighted in their presentation slide.
FRT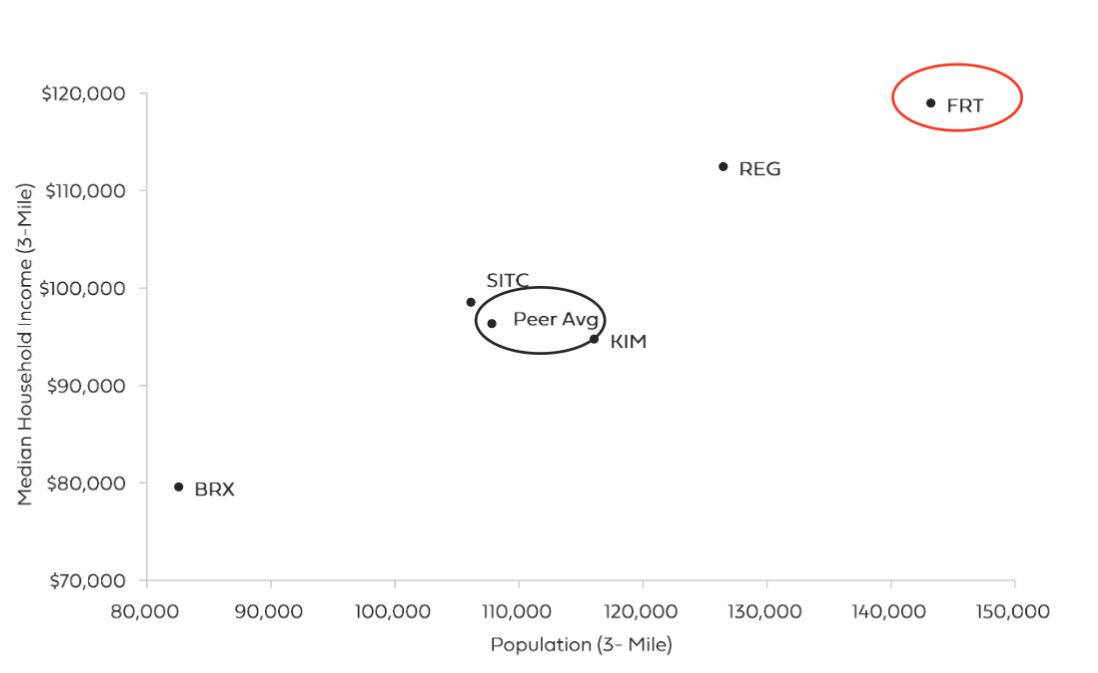
It is worth noting that Urstadt Biddle (UBA) was conveniently left off their peer comparison. UBA’s 3 mile household income is actually slightly higher than FRT’s. Here is the peer comparison chart as UBA presents it.
UBA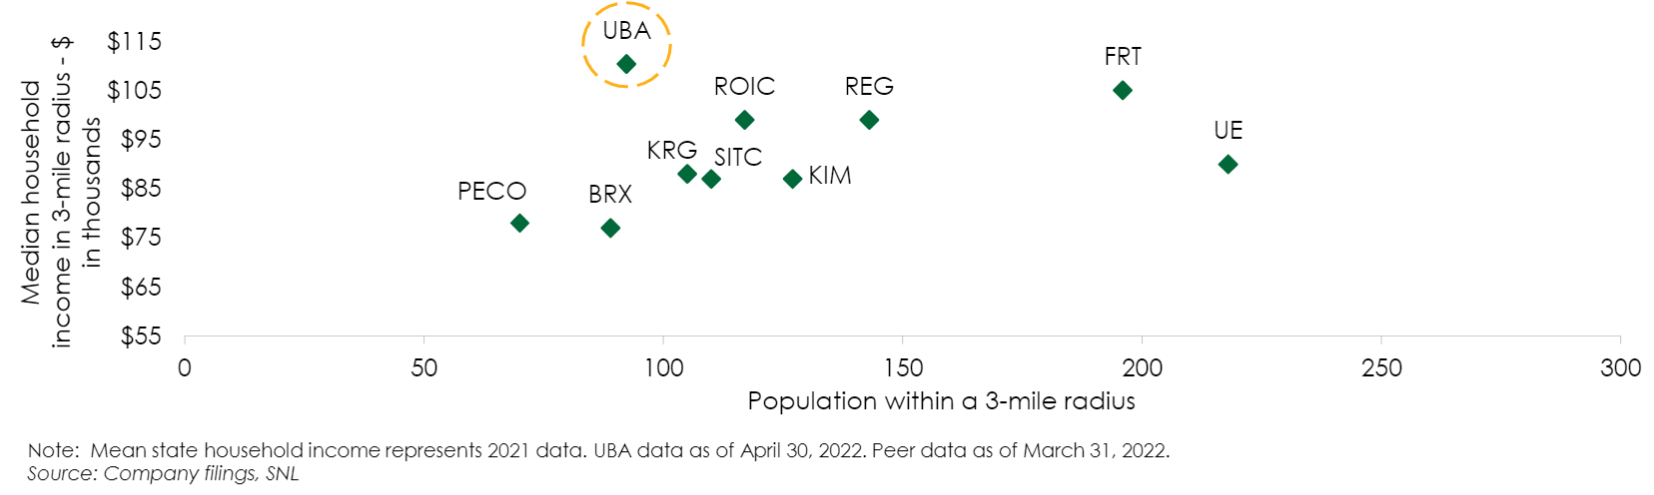
If we follow this chain of obfuscation even further one might note that Whitestone REIT (WSR) is conveniently left out of UBA’s peer comparison. If one adjusts for cost of living, Whitestone has the highest household income in its catchment radii.
While I would have preferred FRT include the full peer set in their presentation, their household income and population metrics are very good.
Overall, FRT’s asset portfolio is of superior quality and should be traded at the higher end of the FFO multiple range for shopping centers.
Growth
Historically, FRT has achieved a moderate pace of growth via a few mechanisms:
- Same store NOI growth
- Acquisitions spreads
- Developments spreads
All 3 of these levers remain available today, but the same store NOI growth is likely to be significantly above trend for another couple years as it bounces back from a recent trough.
Same store NOI had quite consistently been around 3% per year until a massive downdraft in the pandemic.
S&P Global Market Intelligence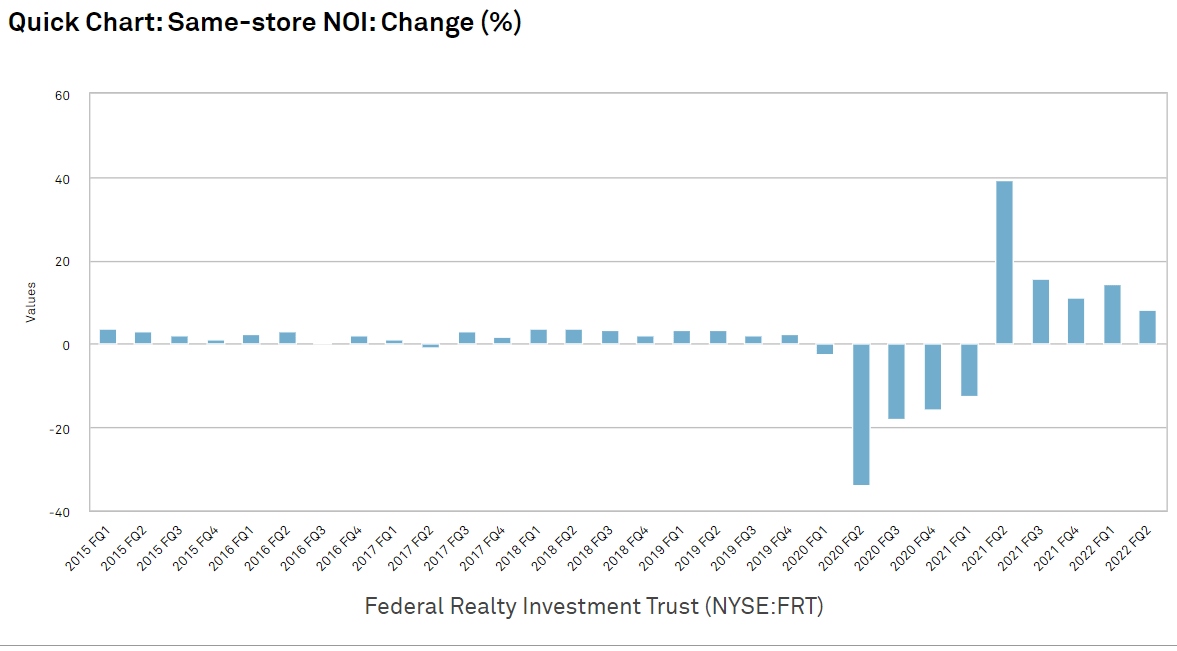
This drop in same store performance was far more severe than that of peer shopping centers as can be seen in the slide below.
FRT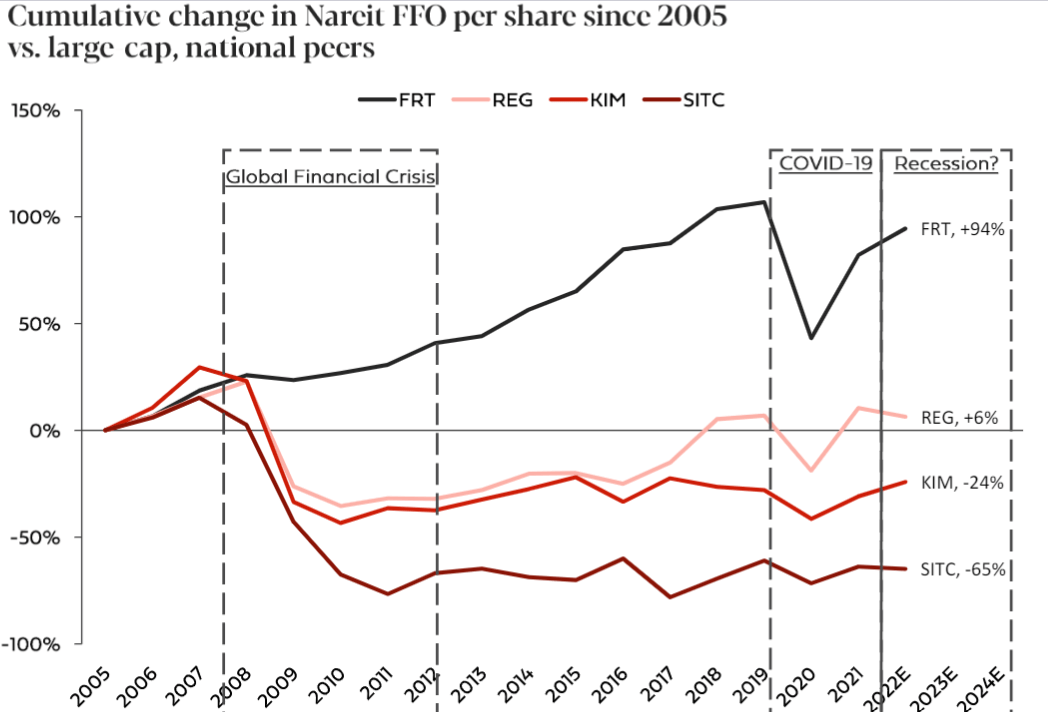
Of note, FRT did not suffer during the financial crisis, so its troubles in 2020 were likely not related to the recessionary aspects of the pandemic. I attribute the underperformance to location as its assets are mostly located in the areas that had the longest and strictest COVID lockdowns.
S&P Global Market Intelligence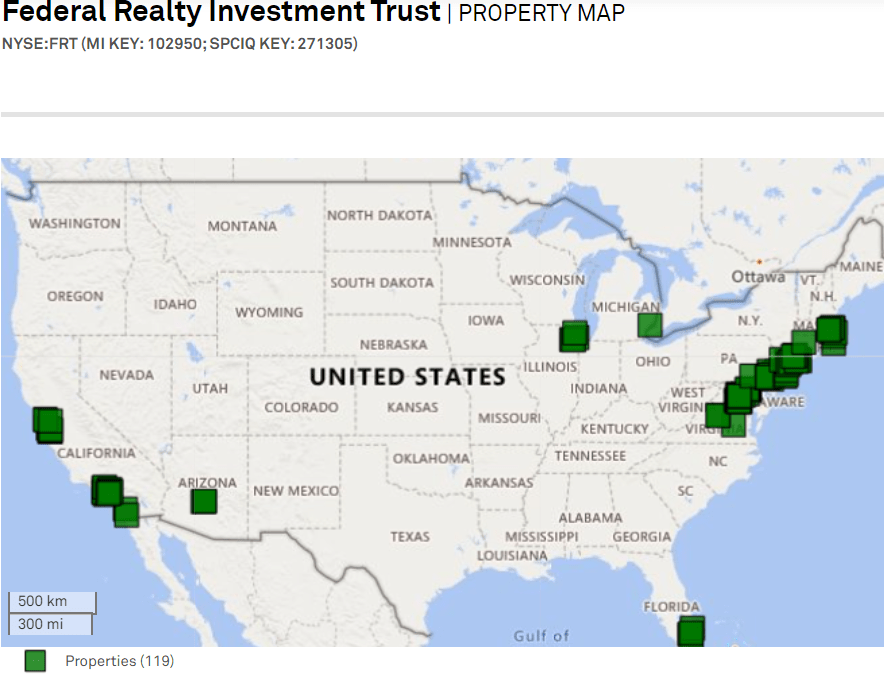
It is also partially related to tenant mix with substantial exposure to gyms and restaurants which are normally good tenants, but not during the pandemic.
While the hit to NOI was substantial, I think it is quite clear that the challenges were temporary in nature and not related to desirability of their properties.
As these locations opened back up, NOI has swiftly rebounded. Tenants resumed paying rent and new tenants have come in with recent quarters featuring record leasing volume. This activity facilitated a guidance raise.
FRT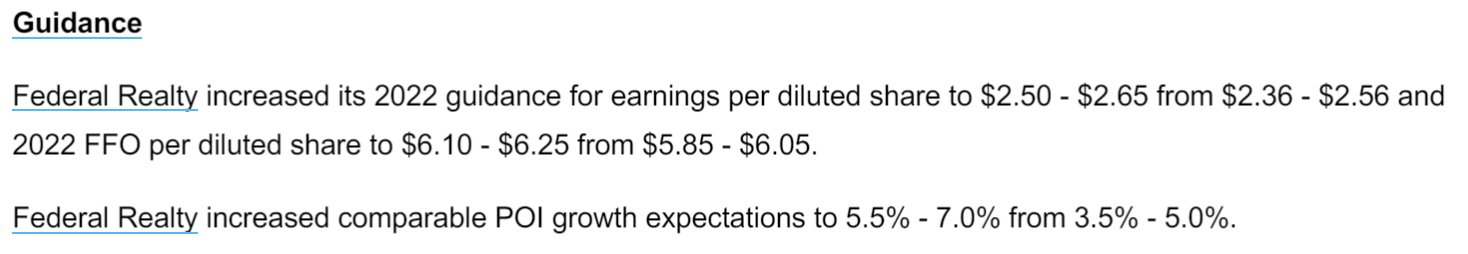
POI is Property Operating Income. It is not a metric I have seen many REITs use, but it is basically equivalent to same store NOI which would be more standard. 5.5%-7% is a good pace that should spur substantial FFO growth as each percentage point of NOI growth usually translates to more than 1 point of FFO growth.
In combination with the re-developments coming online, FRT is looking at moderate to fast pace growth which is reflected in the consensus estimates.
S&P Global Market Intelligence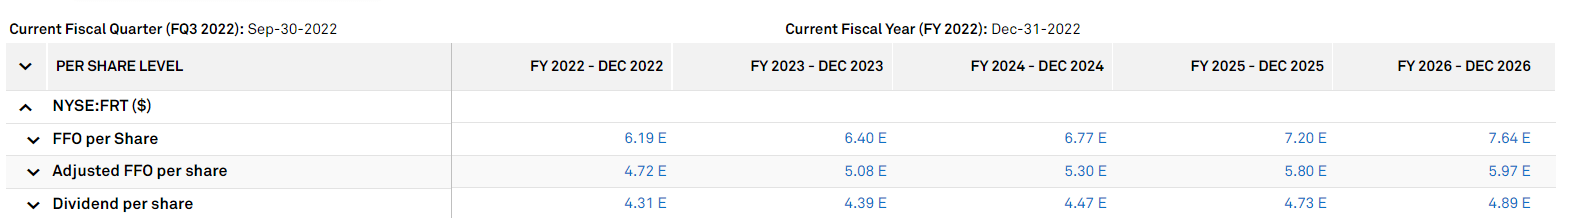
Valuation
FRT still trades at a somewhat premium multiple relative to its shopping center peers.
S&P Global Market Intelligence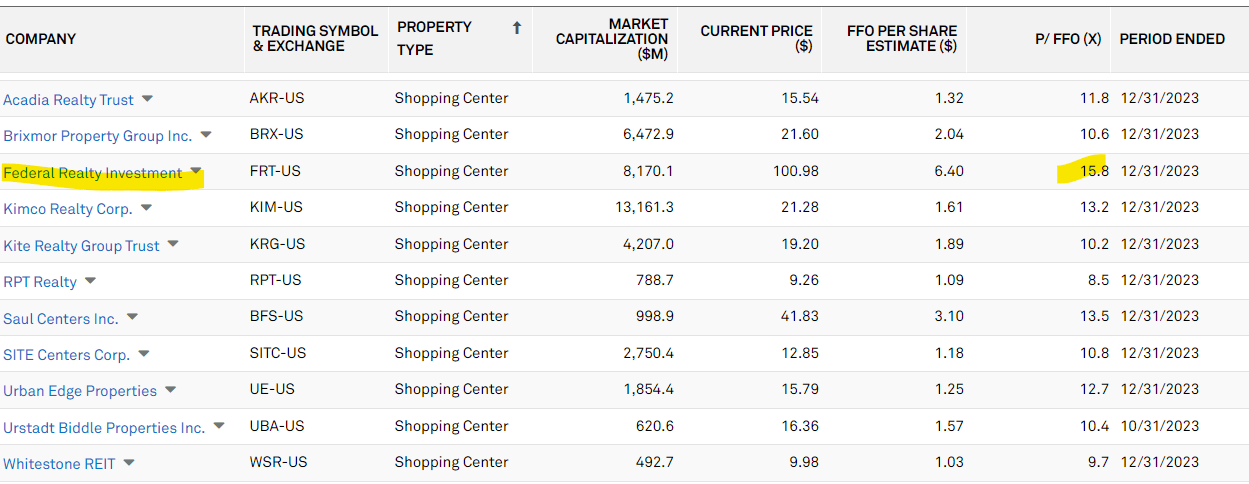
It is, however, quite cheap relative to its own history as it has often traded over 20X.
S&P Global Market Intelligence
It is also cheap relative to its asset value.
S&P Global Market Intelligence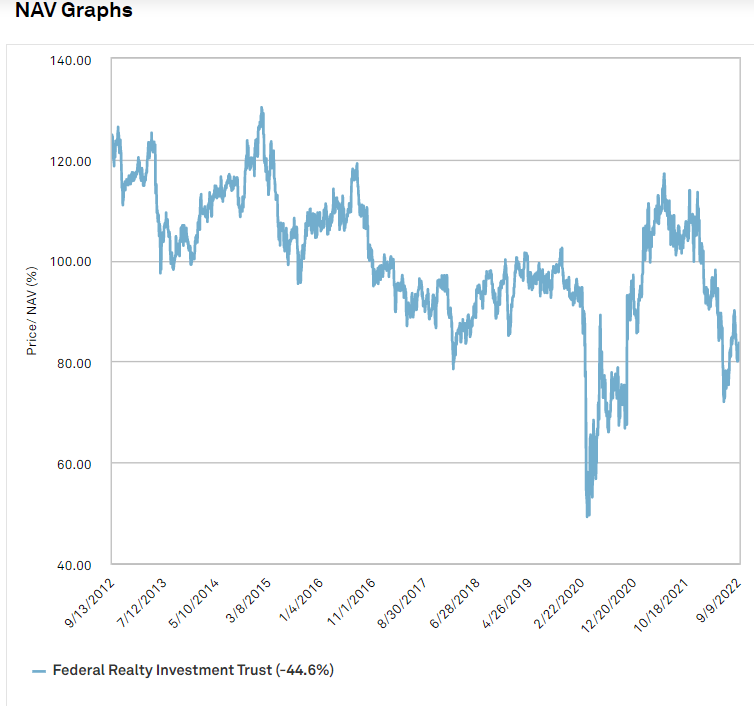
NAVs are of course based on a cap rate assigned by analysts and the cap rate used above is 5.12%.
While I think this is the correct cap rate for current market conditions (actual property sales data) there is an argument that with interest rates rising cap rates will rise slightly.
Thus, FRT is perhaps closer to 90% of NAV rather than the 80% using trailing cap rate data.
Dividend aristocrat
A recent streak of dividend increases is merely the tip of the iceberg.
S&P Global Market Intelligence
This company has been consistently raising for 54 years putting it in the rare club of dividend aristocrats.
At a 4.32% current yield it is also a bigger yield than most of that elite group.
I bring this up because I know dividend history is a big deal to a large portion of investors who rely on dividend income, but I don’t think it has a particularly large impact on fundamental value. It is a nice indicator of a company that has been conservatively managed and generally shareholder friendly, but I wouldn’t overpay to chase companies on the aristocrats list.
That said, given the substantial pullback in FRT’s market price and the reduced FFO multiple I think it would be reasonable to buy FRT at these levels.
How I’m playing it
Within shopping centers, I have significant exposure to Whitestone (WSR) Kite Realty (KRG) and the portion of Armada Hoffler (AHH) that is retail.
I prefer these due to their extremely cheap valuations and primarily sunbelt exposure. Consensus market pricing still shows a slight preference for coastal gateway markets with the associated REITs trading at premiums, but I think sunbelt will continue to outperform fundamentally.
Be the first to comment