

Kwarkot
Federal Realty Investment Trust (NYSE:FRT) is one of my very favorite REITs. It is one of only a few I would not hesitate to put into a buy-and-hold account for a decade or two.
The reasons are many. You can find them in their investor presentation, in my past relevant articles, and in many other articles on SA.
What is harder to find is any research and analysis that really takes apart their business model to figure out what their likely future is. That is what you get here, if you want it.
Here is a short summary of the positive attributes whose repetition makes up most of most of the articles on Federal Realty, with more words and often pictures or graphics:
- Locations in first-ring suburbs of major cities provide a moat
- Highest household income among peers: $133k within a 3-mile radius
- Highest population density among peers: 172k within a 3-mile radius
- 75% of centers have a grocery component
- 35% of centers are mixed use including residential and/or office
- Diverse portfolio by category and by tenant
- Active and profitable development and redevelopment
- Credit ratings of BBB+ or equivalent
- Ample liquidity and otherwise excellent balance-sheet metrics
- Well laddered debt maturities
- Dividend King: A 54-year CAGR of 7% for dividends
What this all adds up to is spectacular management performance.
Some aspects of the historical context will fool people who base their thinking, if any, on 5-year screens. Retail took on excessive debt during the Great Recession, and thanks mostly to that entered a difficult period beginning in 2017.
A lot of companies were zombies that needed to fail. This happened over several years, wrapping up in 2020 when the pandemic overstressed those who were left.
This had real economic impacts on retail landlords. Federal Realty managed to increase their FFO/share through 2018, but then it dropped in 2019 even before getting hammered in 2020. Most other retail REITs did worse.
These impacts also affected dividend growth. The increase of the dividend on FRT dropped from an average of about 8% from 2013 thru 2016 to less than 3.2% in 2017 thru 2020 before probably bottoming in 2021 and 2022. More on that below.
But after 2020 flushed out the weak sisters in retail, we have seen huge demand for quality properties. In parallel, the number of closures and bankruptcies this year has dropped to historically low levels.
FRT responded by appreciating strongly from its 2020 lows. Many investors, including me, profited handsomely and took those profits. But then after peaking at about $140 per share at the start of this year, FRT joined the broad market in taking a plunge downward.
In the midst of that market swoon, one fine spring day FRT showed up on the monitoring screens I used to check for developing bargains. I published a couple of articles about what they indicated along the way.
Specifically, FRT was down 33% from its 52-week high, implying 50% upside to get back to that high. I had not considered FRT to be overvalued last year and thought it might be the reverse.
This made it an easy decision to jump into a position at $95 and to figure out later just how much the upside might be. Now that position is up nearly 20% and I have found time to look in more detail. Let me share my research with you.
Additions to Properties
REITs grow along various paths, but in most cases growth boils down to how much new, income-producing property you can build or buy. Here is how that looks for Federal Realty:
RP Drake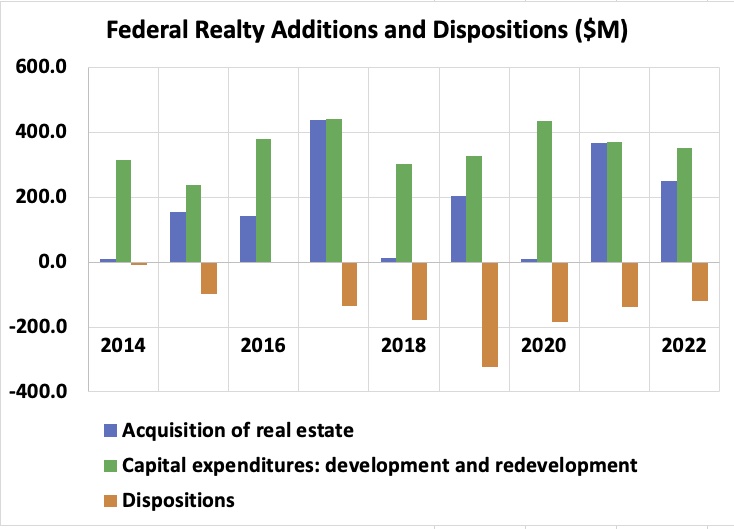
Some added properties are bought (blue bars), and often paid for by selling older properties (orange bars). Other added properties (green bars) are developed and various properties are redeveloped.
You can see that Federal Realty steadily develops new properties, sometimes acquires them, and sometimes sells them. (The numbers for 2022 are guesstimates based on the first two quarters, management mumbling, and other evidence.)
Federal Realty has been averaging about $400M per year in net property added. There are some indications, though, that this may increase strongly now. In particular, in Q2 they issued new stock at about twice their normal rate and they also increased the size of the authorization for their At-The-Market program.
(Incidentally, TIKR lumps together acquisition spending, expenditures for development and redevelopment, and other capex into a number labeled “acquisitions.” To produce the above, I pulled the more detailed information from the Statements of Cash Flows from all the 10-Ks.)
Basic Cash Flows
This next graphic shows three significant numbers related to cash flows. It also will enable some useful discussion of the impact of the pandemic.
RP Drake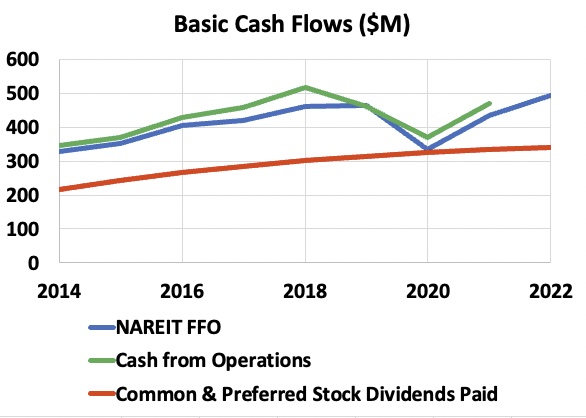
If GAAP accounting is not distorting the meaning of the standard financials, then Cash from Operations (“CfO”) comes out pretty close to Funds From Operations (“FFO”). FFO is a standardized attempt to quantify REIT earnings, using numbers from the GAAP financials.
For Federal Realty, FFO (blue curve) and CfO (green curve) are pretty close, so one can pretty much take FFO at face value, as a measure of the earnings before any recurring capex or dividends.
The red curve shows the dividend payout. In 2020, FFO fell to the level of the dividend payout.
The same thing, more or less, happened to most REITs whose tenants were shut down in 2020 by government fiat. Many of them chose to cut their dividends in response.
Simon Property Group (SPG), for example, cut their dividend so much that their retained earnings were a larger fraction of FFO than they had been before. This gave them extra funds to support the costs of recovery.
In contrast, Federal Realty decided to use the strength of their balance sheet to sustain their record of dividend increases. You can see above that the ratio of FFO to dividends (the FFO payout ratio) is returning this year to previous levels.
We are likely to see the dividend return to growing with FFO/share from here. Debt to EBITA will be back to pre-pandemic levels by late 2023. Paying down debt could delay the return to strong dividend growth by another year.
It was notable to hear in the last earnings call that 33% of Federal Realty’s tenants are still on a cash basis. These will dominantly be small-shop tenants whose future appeared uncertain during the pandemic.
Now there is no hurry to take such tenants off cash basis. And most indications are that retail broadly is in its least-vulnerable shape in 20 years.
The earnings calls indicate very strong demand for Federal Realty’s properties, and an ability to push rent up pretty hard (9% in the first half of 2022) on new leases.
Despite that cash-basis question, my expectation would be for rents to rise strongly over the next several to ten years. And moreso if we see substantial inflation.
Stocks and Debt
We can see above that, on average, acquisitions and dispositions are fairly balanced for Federal Realty. The main use of new capital is to support development and redevelopment.
Two major sources of that capital are increases in net debt and issuing common stock. This graphic shows those elements, with the 2022 numbers being TTM at the end of Q2.
RP Drake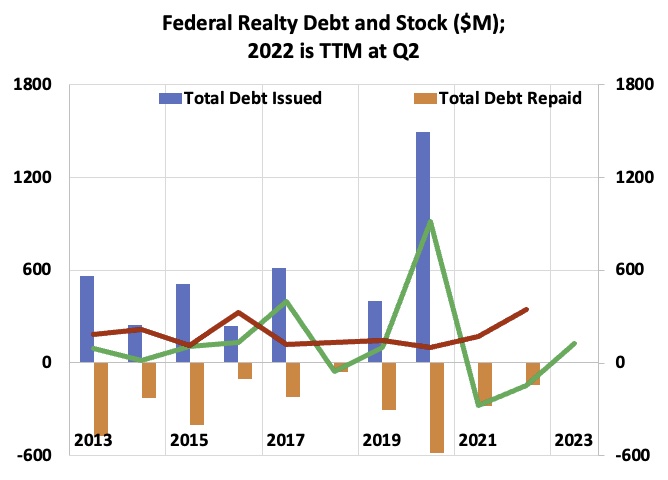
You can see that from 2013 through 2017, Federal Realty increased their net debt (green line) every year. Then they took a year off in 2018 when times got harder, as described above.
Like many REITs, they issued a lot of debt during 2020. This provided liquidity against an unknown threat. It also covered real costs while letting them sustain the dividend.
For the last 18 months they have been paying the debt. That may continue in 2023, but new debt should start flowing after that.
The red line shows the capital raised by issuing stock. This has typically been near $200M per year, but now appears to be near $400M and might be even larger when 2022 is complete.
Paying for Growth
We can put the pieces discussed above together to get a picture of how Federal Realty has paid for growth. That is shown here, using averages from 2014 through an estimated value for 2022.
RP Drake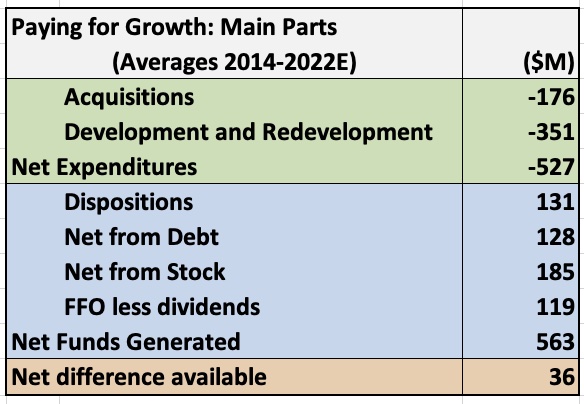
You can see that dispositions, net new debt, and the part of FFO left over after paying dividends are comparable. The net from stock issuance is 50% larger than any of these, but only about a third of the total funds generated.
Subtracting the funds expended on acquisitions, development, and redevelopment from the net funds generated, one is left with an average of $36M. This goes toward recurring capital expenditures but does not fully cover them. In addition the net proceeds from a large number of small items on the Statements of Cash Flows contribute.
I like this way of putting together the drivers of growth for a REIT like Federal Realty whose FFO is not messed up by GAAP accounting. It is always difficult to get a handle on a precise and sensible Adjusted FFO per share, for reasons discussed here. Tracking the addition of property may be more direct.
How Much Growth?
The CAGR of the FFO/share by Federal Realty from 2014 through 2018 was 6.8%. That is comparable to their 54-year CAGR of dividends, which must reflect growth of underlying earnings.
Forward growth of per share earnings for Federal Realty depends on the several elements shown in this graphic:
RP Drake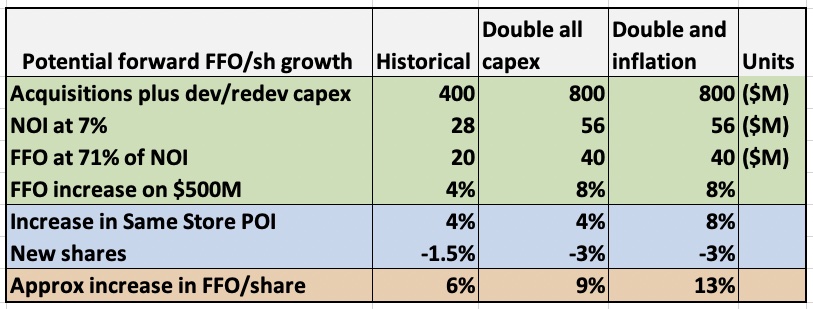
First consider the rows shaded green. One sees above that the main new property for Federal Realty is that developed. The return to NOI on that is typically 7%. Then they acquire properties at well below 7% cap rates but redevelop them at returns well above 7%.
In this context it makes sense to me to use a 7% ratio of that capex to the resulting NOI. In addition, the historical data has Federal Realty managing a 71% ratio of FFO to NOI, on average.
At the historical rate of property additions of $400M per year, this generates a 4% increase in the current FFO of about $500M. If the rate of additions doubles, this goes to 8%.
To this is added the increase in same store Property Operating Income (“POI”). In these times of high demand and healthy tenants, 4% seems to me like a low-end number.
In addition, the history is from a low-inflation period. We could easily see 4% inflation or twice that over the next decade. If this boosts rents by only 4%, the increase of same store POI could easily go to 8%.
As to share issuance, the historical average is 1.5%. But if we project the recent quarter we might expect 3%.
The row shaded orange shows the rate of increase of FFO/share, for the three scenarios just discussed. A solid continuation of the past gets you 6%, not unlike what has happened.
Expanded property growth or inflation can easily push this to 10% or above, as the second and third column indicate. Now consider the implications for valuation.
Valuation Models
Now we turn to valuation. Here I used a model motivated by my discussion of the Lost Chapter of Benjamin Graham.
This started with considering earnings. Federal Realty has paid out an average of 71% of FFO as dividends since 2013. Per the above, they have reinvested about 16% of FFO to support growth of earnings.
To my mind, these to items comprise the earnings that accrue to the benefit of investors. In other words, one can consider the free cash flow to investors to be roughly 87% of FFO (the accuracy, though, is not two digits). I used 87% of the $6.18 guided for 2022 FFO/share at the midpoint, or $5.37, as the initial earnings in Discounted Cash Flow (“DCF”) models.
Looking ahead, the combination of improved retail balance sheets, inflation, and other factors may well make this decade very strong for increasing nominal FFO/share. In the context of the above, I evaluated three DCF models.
The DCF Models
Federal Realty grew FFO/share at a CAGR of 4.9% from the peak in 2008 to the peak in 2018. This was a period of low inflation and included the challenged retail environment described above.
We can note that the 54-year CAGR of FFO/share is probably close to that of dividends, at 7%. It seems sensible to me to project the terminal (long-term) rate of growth in the middle of these numbers, at 6%.
The first DCF model ignores the good years expected now and ignores inflation. It takes the growth rate to be 6% always. This should provide an underestimate.
The second DCF model takes FFO/share to grow at 10% for 5 years and 6% after that. This prices in some good years but not inflation. We can note that Federal Realty has grown FFO/share at about this rate numerous times, making up for other periods of slower growth.
The third DCF model uses an estimate of what will happen if the 2020s turn out to produce moderate inflation. It supposes that economic growth plus inflation result in growth of FFO/share at 12% for 10 years, followed by 6% after that.
The Target Period
I use 10 years as a target period based on my estimate that this approximates the 21st century business cycle. Through the bulk of the 20th Century they were more like 7 years, but that reflected hysteresis in manufacturing.
Service industries dominate the economy now; it seems that major national disruptions may be needed to trigger recessions. The last three – dot/com, Great Recession, and Pandemic – certainly had little connection to historical economic pullbacks. But they seem to come at more or less ten-year intervals.
The Calculation and Results
When you pay for a REIT stock like FRT, you get two things. You get the net present value of the dividend cash flows until some notional sell date. You also get the appreciation in price until that date.
With this addition, the inputs to the modeling for the three models are shown here:
RP Drake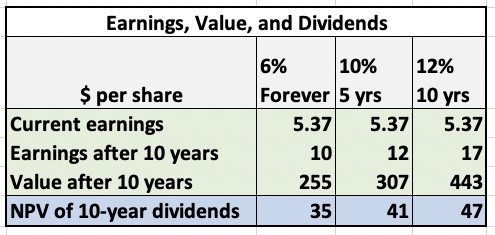
The rows shaded green show the path to the value after 10 years. This is 25.5 times the earnings at that time, based on the terminal growth rate of 6% and a discount rate of 10%. The row shaded blue shows the NPV of the dividends for the notional 10-year holding period.
I evaluated a weighted average return with two parts. The first part is the NPV of the dividend cash flows for a 10% discount rate. I weighted this as a 10% return times the fraction of the price corresponding to the NPV of the dividends.
To find the return on the remainder of the price, I multiplied that fraction of the total price times a standard CAGR calculation. The CAGR calculation set the initial price as the price paid less the NPV of ten years of dividends. It used the Value after 10 years from the table above as the final price.
The sum of the results described in the last two paragraphs gives the weighted average return. This gets us the following plot.
RP Drake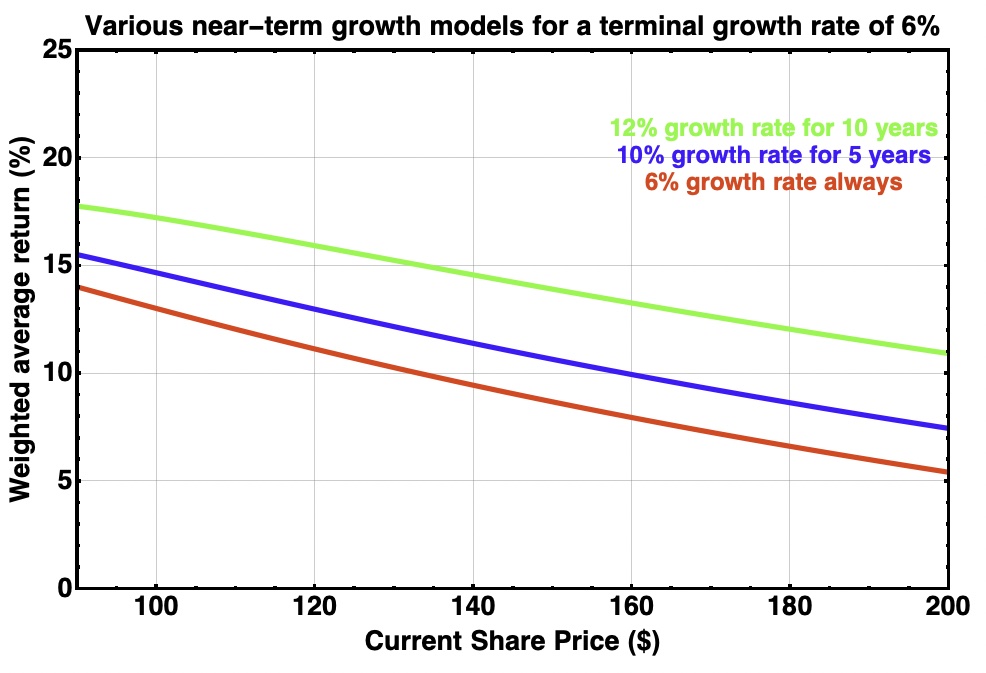
With FRT currently at $112, even relatively weak growth (the red curve) should produce net returns on investment of around 12%. Five years of strong growth at the start increases this to about 14%.
If inflation is significant across the decade, the nominal returns will be larger, with the green curve giving an example. Even so, the real returns appear likely to be significant at the present price.
It is notable that the dividends put a real floor under the return. Suppose their NPV is a third of the price paid. That locks in a 3.3% minimum return. It reduces the impact of swings in the increase of price.
Risks and Takeaways
Now retail will not always be healthy. But it always has been healthy for a decade or more after a period of re-establishment like the one we have just seen.
So my conclusion is that retail is likely to be healthy for the next 5 to 10 years, if not more. The more wrong I am about that, the less Federal Realty will prove able to grow. That said, if there are just a few good years now, that might suffice to get the price up to where I sell my position.
There are also, as always, all the risks laid out in the 10-K SEC filings by Federal Realty. Any of the many risks having extremely small odds nonetheless might occur and have a significant negative impact.
And, as always, there is the risk that discount rates overall take a serious move upward. This probably would come with sustained (and much) higher interest rates. If those come too soon, I will wish I had more of my positions in stocks securely paying higher dividends.
Based on the analysis above, I will probably hold my FRT until the price is somewhere in the $140s. If by then I decide that inflation is sufficiently strong, I might stay in longer.
Be the first to comment