

This article was co-produced with Dividend Sensei and edited by Brad Thomas.
Among dividend-paying companies, the dividend kings, companies with 50 year-plus growth streaks, are considered the bluest of blue chips.
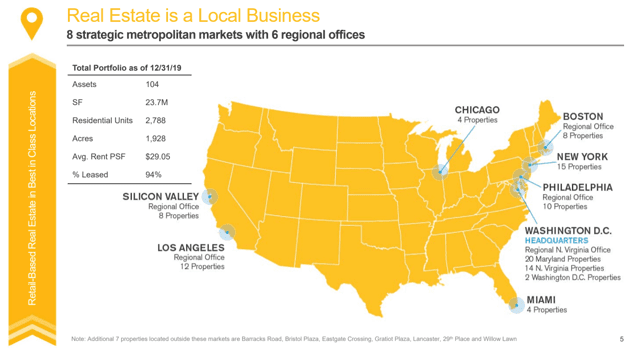
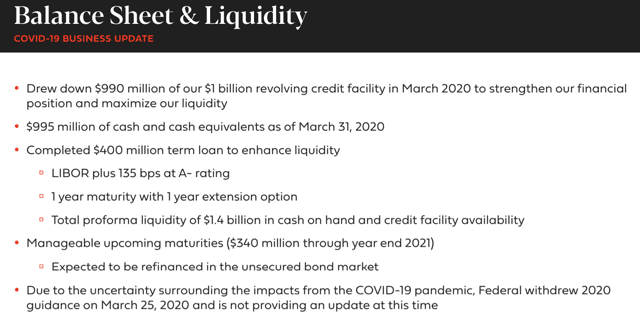
(Source: Investor Presentation)
Federal Realty Investment Trust (FRT) was founded in 1962, just two years after Congress created REITs, making it one of the oldest REITs on earth. It’s also the only dividend king in the world, with an impressive 52-year payout growth steak, through all manner of economic and financial crises.
However, we live in unprecedented times, with much of America’s economy still shut down.
This is expected to result in the worst recession in 75 years.
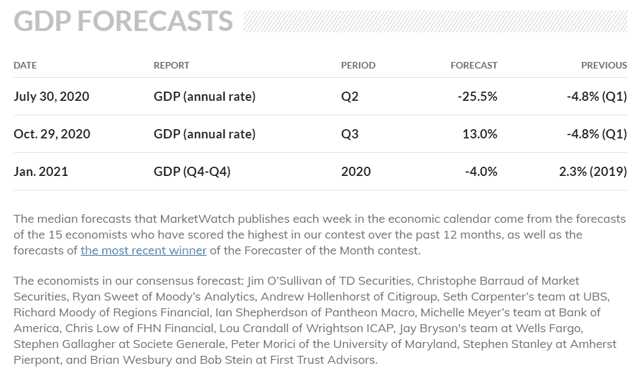
(Source: MarketWatch)
Among the 16 most accurate economists the consensus is for -4% growth in 2020. But that’s just the consensus and individual forecasts from reputable sources, such as the Congressional Budget Office, are more pessimistic.
 (Source: Congressional Budget Office)
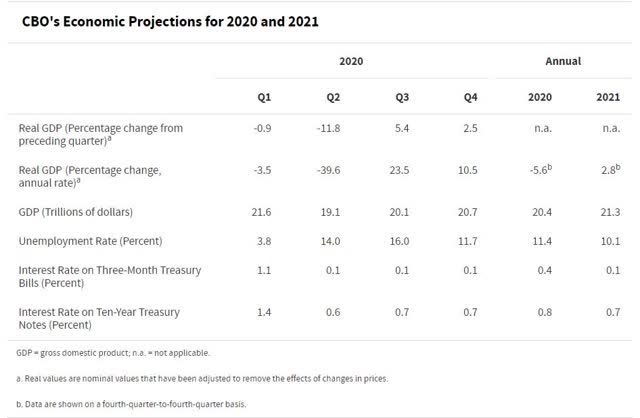
The CBO’s latest forecast estimates -5.6% growth in the US and some estimates are as bad as -6%.
According to the National Bureau of Economic Research, the average recession is a peak decline of 1.4%. Or to put another way, economists, looking at the best available data we have today, are estimating this recession will be about three to four times as bad as a typical downturn.
 (Source: Moon Capital Management, NBER, Multipl.com)
Using the S&P 500 as a proxy for the average quality US corporation, and then looking at historical dividend cuts during recessions, including average ones in the modern era, we estimate that:
-
Below-average dividend safety (2/5) = over 2% dividend cut risk (normal recession)
-
Average dividend safety (3/5) = about 2% cut risk
-
Above-average safety (4/5): about 1% dividend cut risk
-
Very safe (5/5): about 0.5% dividend cut risk
This isn’t a normal recession of course, but the worst in 75 years.
So using the current -4% to -6% estimate range, we can extrapolate the current economic forecasts that would mean that in the Great Lockdown Recession safety ratings would translate to
-
Below-average dividend safety (2/5) = over 10% dividend cut risk
-
Average dividend safety (3/5) = about 8% cut risk
-
Above-average safety (4/5): about 4% dividend cut risk
-
Very safe (5/5): about 2% dividend cut risk
Pre-recession FRT was a 5/5 safety stock and courtesy of its wide REIT moat (strong access to the lowest cost of capital) and industry-leading management, 11/11 Super SWAN quality.
In other words, as close to a perfect REIT as exists on Wall Street.
BUT no blue chip, no matter the quality, is risk free or incapable of failing.
Fallen Aristocrats
 (Source: Ploutos) note MO is still a dividend king, adjusted for spinoffs
Black swan events, such as the Financial Crisis, caused many strong financials to cut or suspend their dividends due to the Fed insisting on it as part of the bailout.
87% of REITs during the Great Recession cut or suspended dividends (due to excessive leverage), with Federal Realty, Realty Income (O), W.P. Carey (WPC), and National Retail (NNN) being notable exceptions courtesy of conservative balance sheets and strong BBB to A- credit ratings.
Going into this recession the REIT sector, in general, had the strongest collective balance sheet in its history.
But then the pandemic happened, resulting in 40 states issuing lockdown orders, and forcing many businesses to close, overnight for an unknown period of time.
So here was the result.
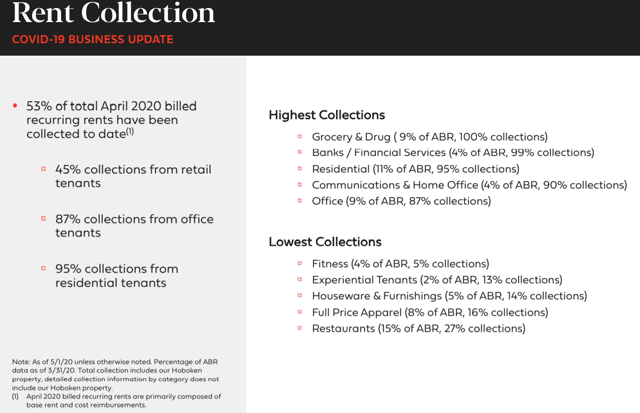
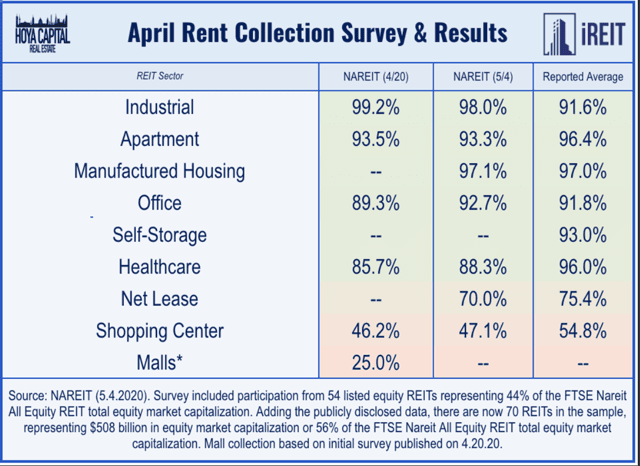 NAREIT has conducted two rent surveys of REITs by industry, and you can see that some are holding up better than others.
Malls, shopping centers, and triple net lease (free-standing retail) have seen precipitous declines in rent collection.
When this survey data came out we stress-tested all REITs on the DK Master List based on a simulated three-month lockdown. That’s double the longest any lockdown has lasted in any country or state so far. Here were the results of the FRT stress test, from the DK company update tool.
Federal Realty Investment Trust- Dividend Aristocrat, King, And Phoenix Watchlist Stock Downgraded to 4/5 safety and 10/11 SWAN quality-speculative, margin of safety requirement for good buy 10% instead of 5%, and max risk-cap recommendation 2.5% or less.
Loses Super SWAN status but remains on Phoenix watchlist and in our Phoenix portfolio. DK Fortress Portfolio also will hold onto our shares.
2020 AFFO payout ratio consensus 91% but applying the stress test 104% AFFO payout ratio consensus (might have to borrow to maintain 52-year dividend growth streak)
Debt/EBITDA 4.8 might rise to 5.5 vs 6.0 or less safe for industry
Interest coverage of 4.2 might fall to 3.6 vs 2+ safe
A- credit rating and 56% debt/capital vs 60% safe = lots of financial flexibility
F-score of 5/9 vs 4+ safe means little short-term solvency risk
M-score of -2.54 vs -2.22 or less safe = low accounting fraud risk
Here are the other long-term fundamental stats.
2020 FFO growth consensus -6% vs +6% 3 months ago
2021 FFO growth consensus +8%, 2022 FFO growth consensus +7%
Long-term growth consensus unchanged at 6.0% CAGR (management long-term guidance 6+%)
Growth range (factors in 3 consensus sources and analyst scorecard): increases from 2% to 8% to 4% to 8% CAGR
Average fair value falls from $132 to $126
Currently 42% undervalued = potentially ultra-value (but speculative) buy
Stress test AFFO payout ratio (applying latest industry cash flow disruption estimates to current year consensus) 104% vs 90% safety guideline, safety 4/5 and quality 10/11
Five-year total return potential 17% to 25% CAGR” – DK stress test
As economist John Maynard Keynes said “When the facts change, I change my mind. What do you do sir?“
The unprecedented retail crisis sweeping America has resulted in Super SWAN FRT becoming a more speculative though still safe dividend stock.
But as REITs have reported earnings we have gotten more information about how rent collections are going.
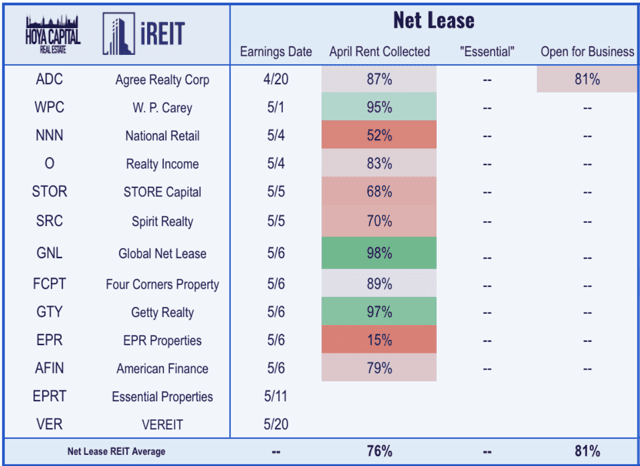
Most triple net lease REITs collected more rent than the surveys expected. Realty Income and WPC far more, meaning their recession safety and quality scores remain intact (both 4/5 above-average safety).
NNN’s 48% rent and management reporting 37% of tenants were negotiating for one- to three-month rent deferments, which means we ran a second more severe stress test on it, downgrading it to 3/5 average safety (about 8% dividend cut risk), and 7/11 average-quality.
What about FRT? The only dividend king in REITdom and arguably the safest dividend in the sector, pre-pandemic?
Let’s take a look at FRT’s latest results to see why I’m stress testing Federal Realty once more, so you can know just how safe the dividend and your investment is during this unprecedented crisis.
FRT Results: Bad… As Expected
FRT’s Q1 results were far worse than previous guidance.
But the company continues to access very low-cost capital.
Federal Realty closed on a new $400 million unsecured term loan. Proceeds will be used to repay balances outstanding under the Company’s $1 billion unsecured credit facility. The term loan bears interest at LIBOR plus 135 basis points and will mature in May 2021, with an option to extend the loan until May 2022.” – FRT earnings release
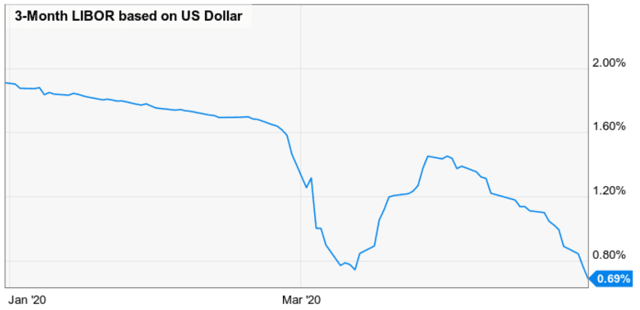
(Source: YCharts)
FRT’s revolving credit facility is now costing it 2.05%, below the 3.13% average interest cost that one of just 6 A-rated REITs in America (from 2+ credit rating agencies) enjoys.
However, here’s the most important information we just found out.
(Source: investor presentation)
In April FRT collected 47% less rent than expected, though May is on-trend for an improvement per the conference call (I listened to it rather than reading the transcript to get this article out earlier).
FRT is NOT a mall REIT but a highly diversified shopping center REIT with the most productive and highest quality properties in the country.
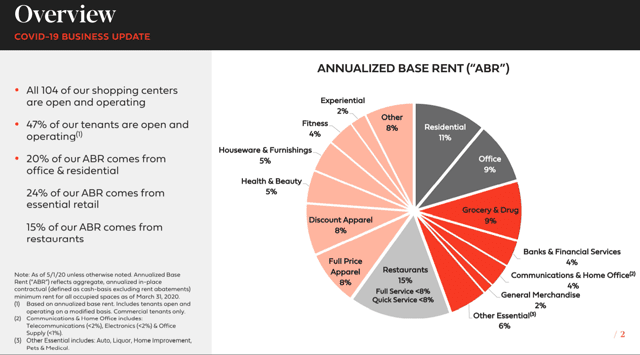
(Source: investor presentation)
FRT is reporting rent collection in-line with its shopping center peers.
Similarly, 47% of its tenants being open is the shopping center average.
Federal’s Strengths Turning Into A Temporary Weakness
Why isn’t FRT, which owns the highest quality and best-situated premium shopping centers in America, fairing better than lower quality rivals?
(Source: Investor Presentation)
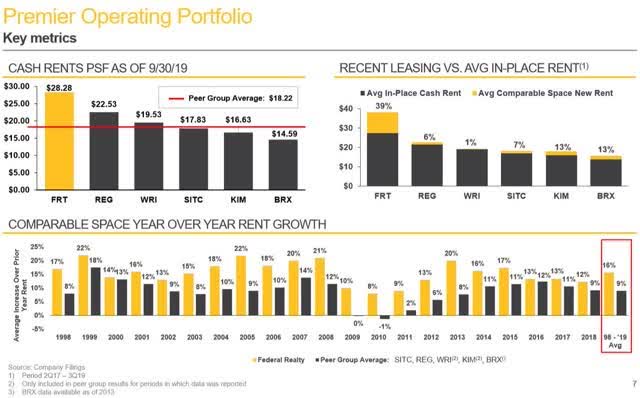
FRT’s rent/square foot and lease spreads have consistently been about twice its peers. In Q1 the 15% straight-line lease spreads were within the company’s historical norm.
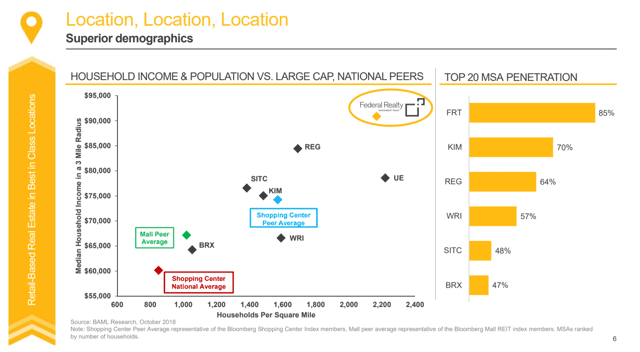
There’s no denying FRT’s superior assets, as seen by the population density of its centers, add well as the median household income.
85% of centers are located in America’s 20 largest cities. But that’s also the problem FRT faces right now. “Location, location, location” is said to be the most important three things in real estate.
Prior to the pandemic, these were unquestionably working in FRT’s favor. But now they are temporarily working against it.
(Source: Investor Presentation)
FRT’s centers almost are entirely located in states that are currently locked down.
 (Source: New York Times)
Now there is some good news on this front.
-
May 8, California will allow curbside pickup in retail stores
-
“Some retail sectors (including bookstores, clothing shops, sporting goods stores, and flower shops) can resume business as long as their local officials give approval and they make changes in their operations, such as having workers wear masks.”- SFgate
California has a four-stage plan for reopening.
-
Stage 1: lockdown
-
Stage 2: “In this stage, schools, summer programs, childcare facilities, and low-risk businesses will reopen with adaptations and modifications to promote social distancing.”
-
Stage 3: “In this stage high-risk workplaces will reopen. Newsom said those include: personal care (hair and nail salons, gyms), entertainment venues (movie theaters, sports without live audiences) and in-person religious services (churches, weddings)”
-
Stage 4: “This marks the end of the stay-at-home order and reopening of the highest-risk parts of the economy including concerts, convention centers, and live audience sports events. Newsom said this stage will be implemented when therapeutics to treat a patient infected with COVID-19 have been developed.”
On Friday, May 8, California is planning to enter stage 2, which will allow most of FRT’s tenants to reopen (the 53% that are currently closed).
New York Gov. Cuomo has announced that on May 15 low-risk small businesses might be allowed to reopen.
New York would rely heavily on progress in key areas — declines in new positive virus cases and deaths, and increases in testing, hospital capacity and contact tracing — under a complex formula that will determine when parts of the state are eligible to reopen…
Once the requirements are met, the plan would first allow construction and manufacturing and some retail stores to reopen for curbside pickup, similar to California, after May 15…
The effect of phase one would be evaluated after two weeks. If indicators are still positive, state officials said, the second phase of reopening would include professional services, more retailers and real estate firms, among others, perhaps as soon as the end of May.
Restaurants, bars and hotels would come next, followed by a fourth, and final, phase that would include attractions like cinemas and theaters, including Broadway, a powerful financial force in New York City.” – NYT
All states are basically following a similar multi-phase approach.
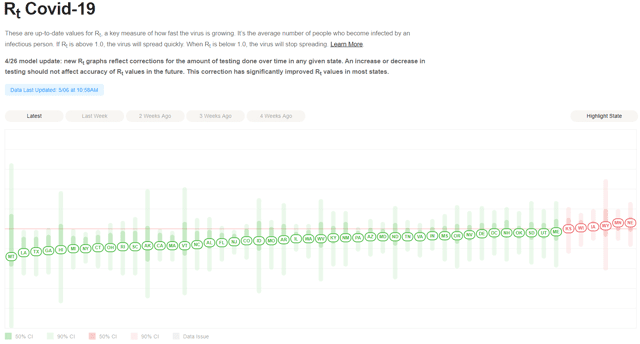
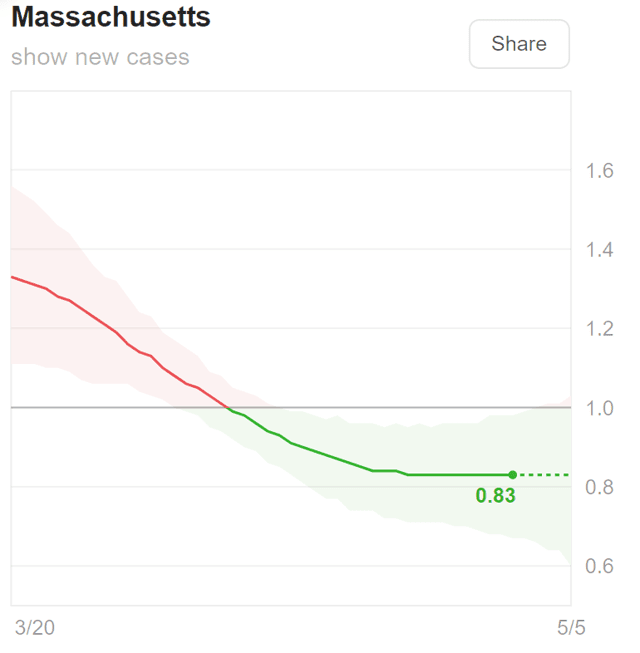
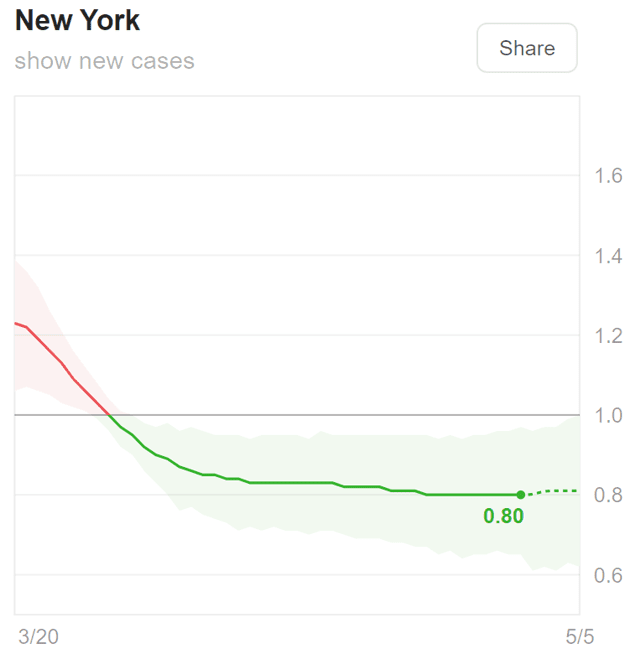
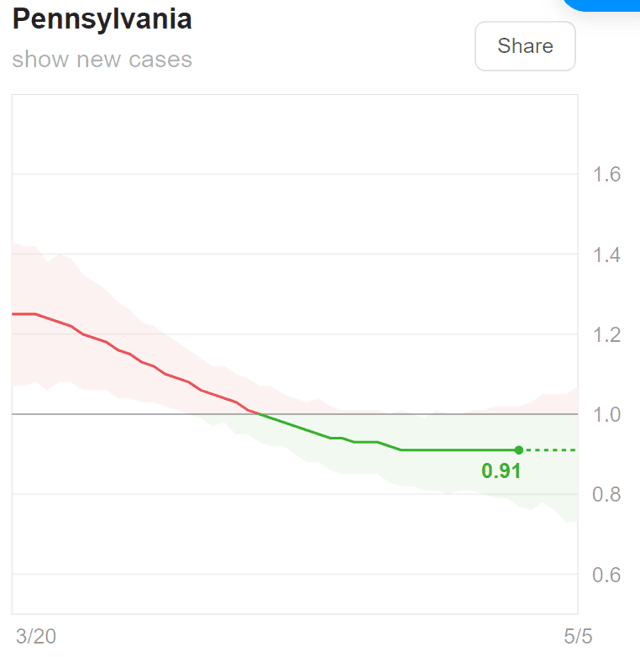
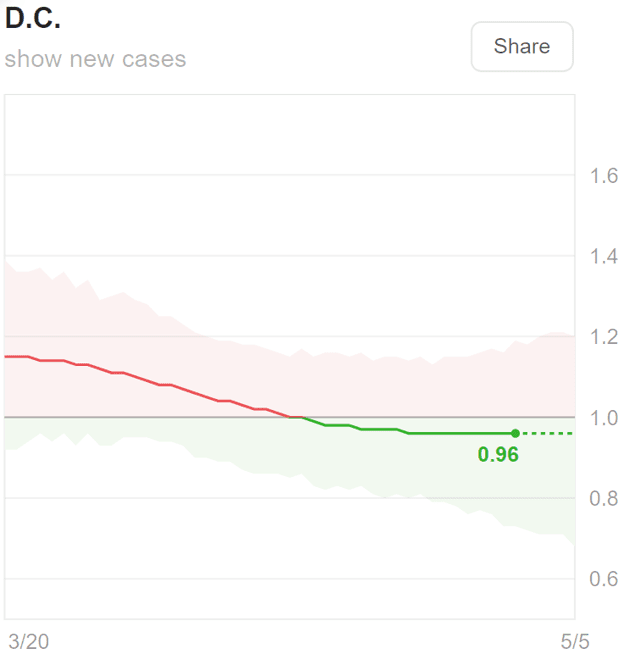
(Source: Rtlive)
The reproductive rate of a virus is how many new people each infected person is estimated to pass it onto. The rt is the effective R^0 which for COVID-19 is estimated to be between 2 and 4 (depending on country/state).
When Rt is
-
more than 1 the virus will spread exponentially
-
=1 virus will spread steadily
-
less than 1 virus will burn itself out (eventually)
Here’s the estimated Rts in FRT’s most important states, which include 73 of its 104 properties.
(Source: rtlive)
The highest Rt in an FRT state is 0.96 in DC, and all the rest are lower and below 1.
The lowest is NY at 0.8. That’s good news. However, Germany, which began its phase 1 restart on April 20, has seen its Rt rise from an estimated 0.7 to 1.0.
This means we’ll have to closely monitor this number in the coming weeks to track how these state restarts are going.
Even if FRT’s states restart on schedule, there’s no guarantee that shoppers will return in sufficient numbers to allow tenants to be able to afford their contractual rent.
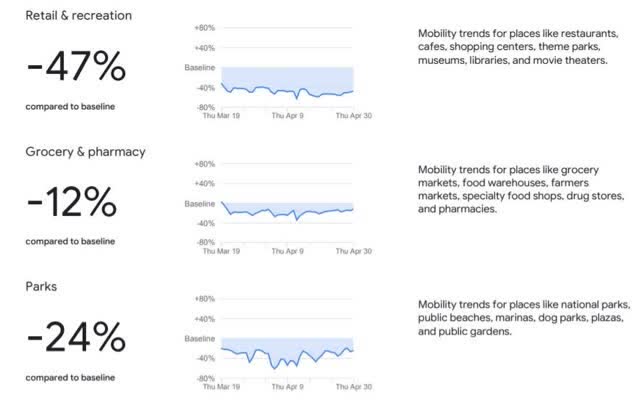
California Mobility Report
 NY Mobility Report
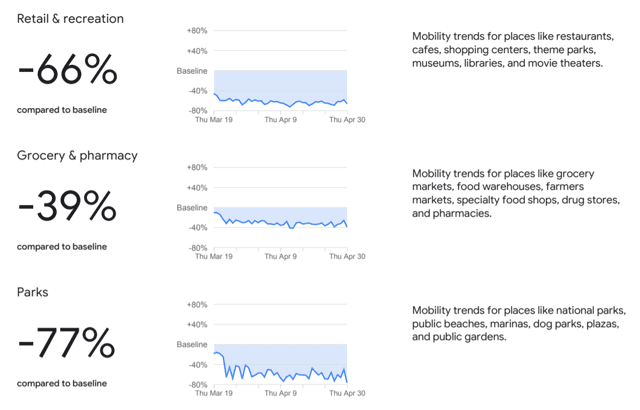
Washington DC Mobility Report
Pennsylvania Mobility Report
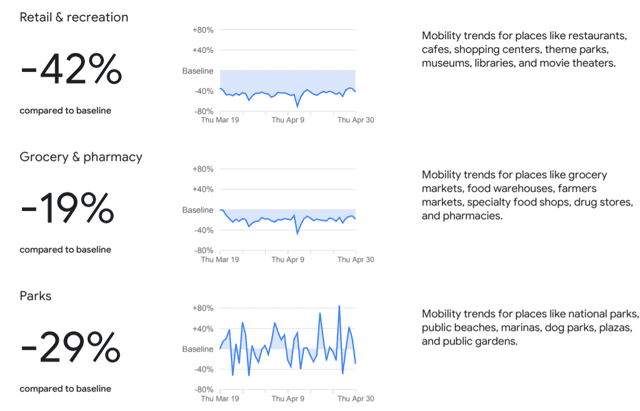
Massachusetts Mobility Report
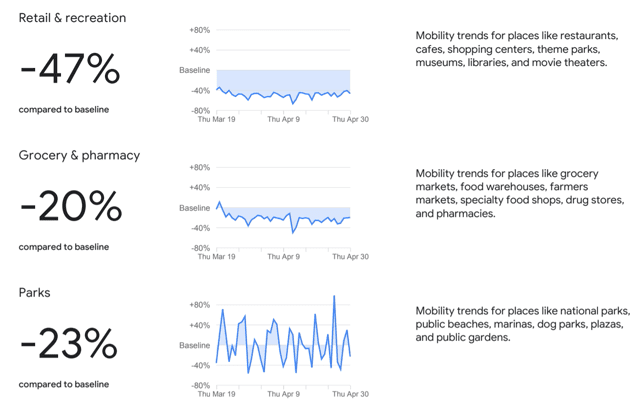
(Source: Google COVID-19 Community Reports)
Google is using anonymized cell phone data to track mobility on a monthly basis in every state and country.
In the Dividend Kings COVID-19 Tracking tool, we’re tracking
-
Worst-case final case forecasts for major countries and the world (based on the highest large country per capita case rate)
-
State Rts over time
-
State retail sale mobility data (monthly)
|
State |
Rt (4/29) |
Retail Mobility Data Compared To Baseline (April) |
|
Washington DC |
0.91 |
-66% |
|
New York |
0.83 |
-58% |
|
New Jersey |
0.84 |
-56% |
|
Hawaii |
0.76 |
-48% |
|
California |
0.85 |
-47% |
|
Massachusetts |
0.86 |
-47% |
|
Maryland |
0.9 |
-44% |
|
Vermont |
0.8 |
-43% |
|
Connecticut |
0.81 |
-42% |
|
Oregon |
0.88 |
-41% |
|
Florida |
0.89 |
-40% |
|
Michigan |
0.78 |
-39% |
|
Rhode Island |
0.82 |
-39% |
|
Deleware |
0.95 |
-38% |
|
Virginia |
0.85 |
-38% |
|
Nevada |
0.94 |
-36% |
|
Illinois |
0.9 |
-35% |
|
New Hampshire |
0.96 |
-35% |
|
Washington |
0.92 |
-33% |
|
Colorado |
0.88 |
-32% |
|
Pennsylvania |
0.91 |
-32% |
|
Wisconsin |
1.00 |
-32% |
|
Arizona |
0.89 |
-30% |
|
Minnesota |
1.03 |
-30% |
|
North Carolina |
0.84 |
-29% |
|
Ohio |
0.82 |
-29% |
|
Indiana |
0.95 |
-27% |
|
Iowa |
1.04 |
-25% |
|
New Mexico |
0.87 |
-25% |
|
Texas |
0.75 |
-25% |
|
Kansas |
1.02 |
-24% |
|
Kentucky |
0.86 |
-24% |
|
North Dakota |
0.89 |
-24% |
|
Utah |
0.93 |
-24% |
|
Georgia |
0.81 |
-23% |
|
Maine |
0.94 |
-23% |
|
Montana |
0.74 |
-23% |
|
Idaho |
0.79 |
-22% |
|
Louisiana |
0.79 |
-22% |
|
Nebraska |
1.09 |
-22% |
|
West Virginia |
0.76 |
-22% |
|
Missouri |
0.86 |
-21% |
|
South Carolina |
0.83 |
-21% |
|
Wyoming |
1.02 |
-20% |
|
Alabama |
0.83 |
-18% |
|
Tennessee |
0.91 |
-18% |
|
South Dakota |
0.99 |
-17% |
|
Alaska |
0.7 |
-16% |
|
Mississippi |
0.86 |
-10% |
|
Oklahoma |
0.94 |
-10% |
|
Arkansas |
0.86 |
-8% |
|
Average |
0.88 |
-30% |
(Sources: Google Mobility, Rtlive)
As you can see, all have seen far greater decreases in retail mobility in April. This explains why 53% of FRT’s tenants are currently closed and why its rental income has been so severely impaired.
While not a real-time measure of how quickly consumers are returning to retail centers, it’s a pretty useful tool when combined with
-
State Rt data
-
NYT state reopening tool
-
Weekly and monthly retail sales data
-
Weekly economic reports (and NY Fed/Dallas Fed/Harvard Weekly Economic Index)
-
Blue-chip economist GDP consensus forecast
This, plus NAREIT monthly rental surveys and other analyst reports/notes, are how we, iREIT, and Dividend Kings are tracking the state of the retail apocalypse (the first one was fake, this one is very real).
So what does all this mean for Federal Realty and the safety of its impressive 52-year dividend growth streak?
To answer that, we turn to my new more conservative Stress Test.
How Safe Is The Dividend? Stress Test #2
On the conference call, CEO Don Wood made three things clear.
-
FRT values the 52-year dividend growth streak and has every intention to get that to 53 years.
-
The dividend costs $79 million per quarter ($316 million per year) and FRT believes that paying the dividend every quarter will win it the trust of investors which will reduce its cost of equity later.
-
Management will be disciplined in capital allocation and consider the dividend issue on a quarterly basis, as the facts on the ground dictate is prudent.
In other words, if FRT can afford to pay the dividend, it will, seeing it as a long-term strategy to maintain the trust built up over 52 years that has given it the lowest cost of capital in the industry.
The question is, how likely is FRT to see a cash flow crunch so severe that it becomes financially irresponsible to keep paying the dividend?
A stress test should be excessive conservative, but not so ludicrous as to assume an apocalypse.
Previously we used a three-month lockdown stress test on all retail REITs and estimated, based on NAREIT’s preliminary April rent survey a 15% cash flow reduction for all retail REITs.
We added that to the roughly 5% that consensus estimates had already fallen for the industry.
States are beginning to reopen, and hopefully May mobility data from Google will show consumers returning but until that data becomes available I’m going to double the lockdown assumption to six months.
After listening to the conference call a few key things stood out.
-
May rent collection is ahead of April, so fundamentals appear to be improving.
-
$10 million loan restart fund is being offered to 35 of the strongest restaurant tenants to help them reopen.
-
J.Crew, which just filed for bankruptcy, has 11 stores in FRT centers (all of them located in the most productive and highest traffic ones) – management not worried about releasing these.
-
Q2 and Q3 at least are when the effects of the pandemic are expected to last.
-
FRT’s top 10 executives are individually having meetings with tenants in default on rent (small size turns to a key advantage) – no 1 size fits all policy for renegotiating rents.
-
Construction that’s nearly complete will be completed
-
New construction on hold
-
$675 million redevelopment pipeline
-
$250 to $275 million 2020 capex plan
-
$250 million 2021 capex plan
-
$150 to $175 million 2022-2023 capex plan
-
80% of capex on non-residential mixed-use properties (like apartments, hotels, offices, etc.).
-
$280 million in spending can be put on pause to preserve liquidity if necessary
FRT is being proactive in helping its tenants and communities restart as soon as safely possible.
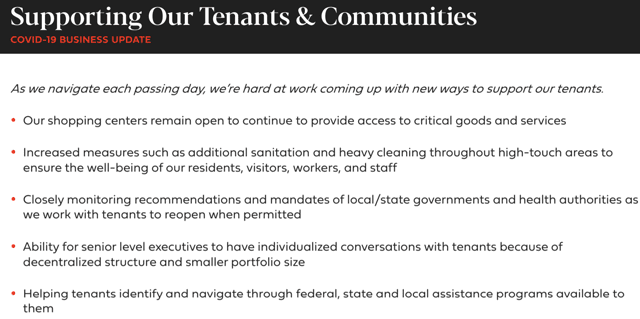
(Source: Investor Presentation)
OK, that’s all well and good but let’s get to the numbers. How bad could this pandemic be for FRT in 2020 and how safe is the dividend now that we know about half the tenants are closed?
From the conference call, we deem the following stress test appropriate.
-
Assume six-month total lockdown
-
24% 2020 cash flow reduction (management specifically said April rent collection is not indicative of the full year but let’s be conservative)
States are already beginning to reopen and in DC and Virginia traffic on the roads is rising even with existing lockdowns in place.
Management has seen higher May rent collection so far, and so the bottom may be in.
However, there are plenty of reasons to be very cautious and model that cash flows, in a realistic worst-case scenario, might come in 24% lower than current consensus.
So let’s run the stress test and see how FRT’s numbers look
-
2020 AFFO payout ratio consensus 98% (AFFO consensus now down 15%)
-
Stress test 122% AFFO payout ratio (would have to tap $1.4 billion liquidity to pay the dividend)
-
Debt/EBITDA 4.8 might rise to 6.0 vs 6.0 or less safe for industry
-
Interest coverage of 4.0 might fall to 3.0 vs 2+ safe
-
A- credit rating and 56% debt/capital vs 60% safe = lots of financial flexibility
-
F-score of 5/9 vs 4+ safe means little short-term solvency risk (might fall to 4/9, still safe in the stress-test scenario)
-
M-score of -2.54 vs -2.22 or less safe = low accounting fraud risk
FRT’s leverage looks like it will not exceed the safe level for shopping center REITs. Its interest coverage should remain strong enough to retain the A- credit rating.
S&P may put it on a negative outlook, but the main concern with dividend safety is two fold.
First, FRT is likely to have to tap liquidity ($1 billion in case right now) in order to pay the dividend.
-
$316 million annual dividend cost
-
$1.4 billion in liquidity
-
$275 million in upper-end capex guidance
-
$1.125 billion available for paying dividend = 3.6 years worth of dividend capacity from net liquidity alone
But we can’t forget about debt covenants.
(Source: Investor Presentation)
What if we apply the more conservative stress test to these bond covenants?
-
Debt/total assets: 48% vs 60% limit
-
Secured debt/total assets: 8% vs 40% limit
-
Interest coverage ratio: 3.0 vs 1.5 limit
-
Unencumbered asset ratio: 195% vs 150% limit
FRT, even if it collected April level rents (May rents already are recovering) for six months, would be nowhere near breaching its contents.
(Source: Investor Presentation)
And we can’t forget that FRT’s access to capital markets is as strong as ever. The company also has the option of raising non-share equity at the asset level.
During the conference call management said that it was open to going on offense and leveraging up the balance sheet to make opportunistic distressed investments if any attractive ones become available.
(Source: earnings supplement)
FRT has just 9.5% of its bonds maturing this the end of 2021, and its current liquidity gives it very strong financial flexibility. For example, the $1.4 billion in liquidity is sufficient to cover
-
Cover the dividend through the end of 2021: $613
-
$525 million in max capex planned through 2021
-
refinance 70% of maturing debt through 2021
What’s the conclusion of the stress test when even management admits it’s facing the most uncertainty in its history?
FRT retains its 4/5 safety rating and 10/11 quality rating but gets put on a negative outlook.
That means the same thing as when S&P or Moody’s place a company on a negative outlook, high uncertainty, and the potential for a downgrade should conditions worsen beyond current conservative expectations.
However, we should note that even as analysts have been steadily cutting FRT consensus estimates for this year, they remain bullish on the long-term outlook of the company.
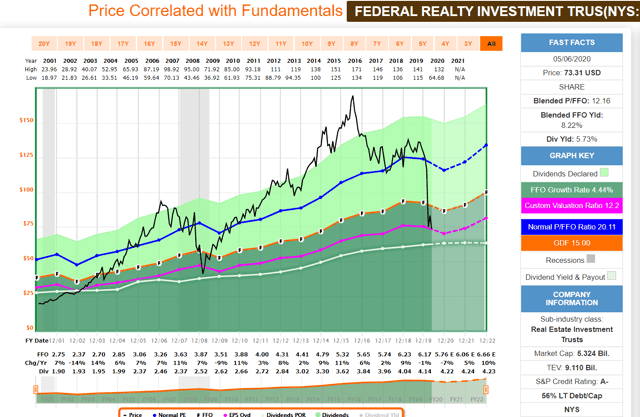
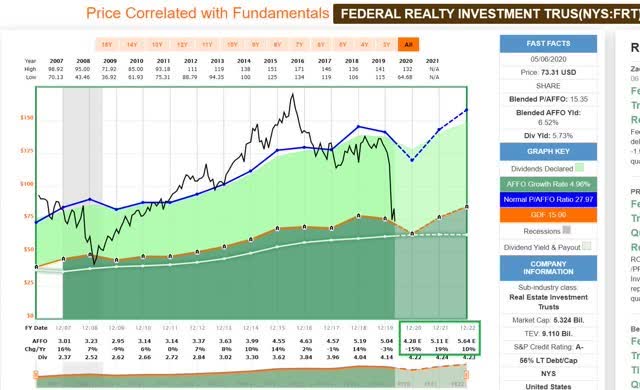 (Source: F.A.S.T Graphs, FactSet Research)
FRT’s payout ratio is expected to hit 98% in 2020, 83% in 2021, and 75% in 2022, vs 90% safe for retail REITs.
In fact, in 2021 FRT is expected to see AFFO soar 19% and 10% more in 2022 as its redevelopment projects come online and the economy recovers.
By 2022 FRT is expected to be reporting record cash flow once again.
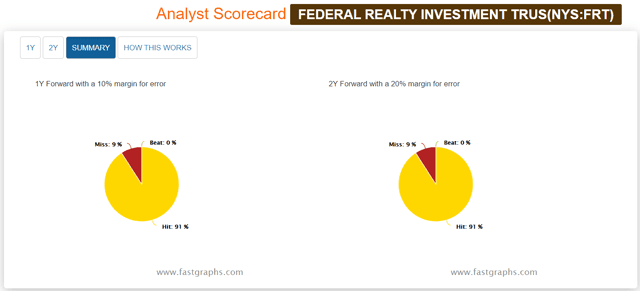
91% of the time FRT meets its 12 and 24-month consensus forecasts, within a reasonable margin of error.
The sharp revisions to FRT’s cash flow estimates (which are ongoing) likely mean it will continue its historically good track record of growing as expected.
Here’s the REIT’s growth matrix for the next few years.
|
Metric |
2020 Growth Consensus |
2021 Growth Consensus |
2022 Growth Consensus |
|
Dividend |
2% |
0.5% |
0.2% |
|
FFO |
-7% |
5% |
10% |
|
AFFO |
-15% |
19% |
10% |
|
EBITDA |
-5% |
6% |
19% |
|
EBIT |
-15% |
2% |
-34% (1 analyst) |
(Source: F.A.S.T Graphs, FactSet Research)
With the exception of a single analyst forecasting a severe pre-tax profit decline in 2022, the consensus is that FRT will be able to recover relatively quickly in the coming years.
FFO will take some time to ramp up, with 5% and 10% growth in 2021, and 2022, respectively.
EBITDA is expected to soar 26% between 2022 and 2020, helping to reduce FRT’s leverage, which even under severe stress test conditions never breaches safe levels.
All of this means that FRT remains the safest shopping center REIT in America, and management is likely to be able to achieve its goal of extending the dividend growth streak to 53 years.
The next hike might potentially come later than expected (FRT can maintain the same dividend for seven quarters without losing the annual dividend growth streak). Or it may come in two quarters, on schedule but come in the form of a single penny hike.
However, given the current facts, as best as anyone can know them (including the analysts who cover FRT for a living) FRT’s dividend still appears safe and dependable.
Valuation/Total Return Profile: A Wonderful Company At A Wonderful Price
FRT’s long-term growth rate has been 7% CAGR and its long-term guidance is 6+% CAGR.
Here is what analysts expect.
-
FactSet long-term consensus: 6.0% CAGR
-
YCharts long-term consensus: 4.6% CAGR
-
Reuters’ five-year growth consensus: 6.7% CAGR (six analysts)
-
20-year growth rate: 4.4% CAGR
-
Management guidance: 6+% CAGR
-
Realistic growth range: 4% to 8% CAGR
-
Historical market-determined fair value: 20 to 23 FFO
Using periods of similar fundamentals, such as interest rate environments and expected growth rates, we can apply the actual multiples to FRT’s fundamentals that investors have historically paid.
|
Metric |
Historical Fair Value (19 yr) |
2020 |
2021 |
2022 |
|
5-Year Average Yield |
3.07% |
$137 |
$138 |
$138 |
|
13-Year Median Yield |
2.98% |
$141 |
$142 |
$143 |
|
FFO |
21.8 |
$126 |
$132 |
$145 |
|
AFFO |
28.0 |
$120 |
$143 |
$158 |
|
EBITDA |
15.7 |
$120 |
$128 |
$152 |
|
EBIT |
25.1 |
$101 |
$103 |
NA |
|
Average |
$124 |
$131 |
$147 |
This provides a range of fair value estimates. There is about an 80% probability that FRT’s true worth is between $101 and $141. The average fair value of $124 is a reasonable estimate of what it’s worth today.
|
Classification |
Margin Of Safety For 10/11 Quality SWAN |
2020 Price |
|
Reasonable Buy |
0% |
$124 |
|
Good Buy |
10% |
$112 |
|
Strong Buy |
20% |
$99 |
|
Very Strong Buy |
30% |
$87 |
|
Ultra-Value Buy |
40% |
$74 |
|
Currently |
38% |
$76.5 |
FRT is currently about 38% undervalued. What does that mean for today’s investors potentially interested in buying this dividend king REIT at the best valuation in 12 years?
Best Time To Buy FRT in 12 Years
 (Source: F.A.S.T Graphs, FactSet Research)
The Last Time FRT Traded At 12X FFO
(Source: F.A.S.T Graphs, FactSet Research)
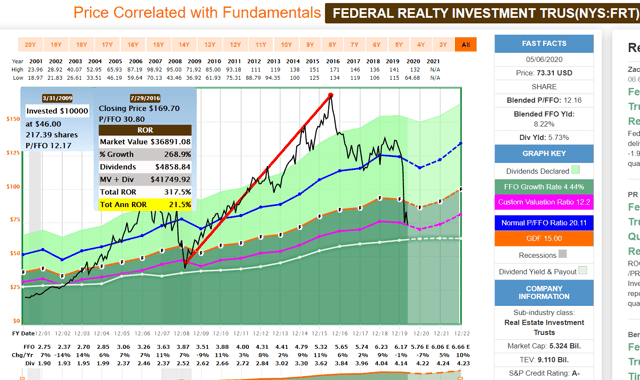
Here’s the proof that markets are not efficient except in the long-term.
FRT went from 12X FFO in 2008 to 31X in 2016, going from 42% undervalued to 48% overvalued.
(Source: F.A.S.T Graphs, FactSet Research)
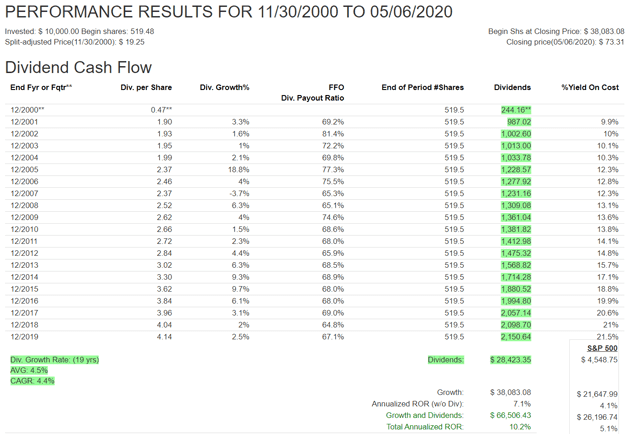
Even factoring in the current crash, over the last 20 years FRT has doubled the S&P 500 due to its quality and clockwork-like dividend growth.
Growth that resulted in investors recouping their initial investments almost three times over in safe and growing income, even in recessions.
What kind of long-term returns could patient long-term income investors see from buying FRT at the best valuation in 12 years?
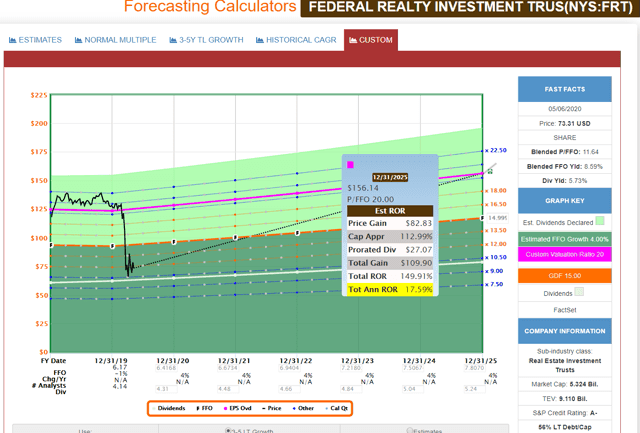
(Source: F.A.S.T Graphs, FactSet Research)
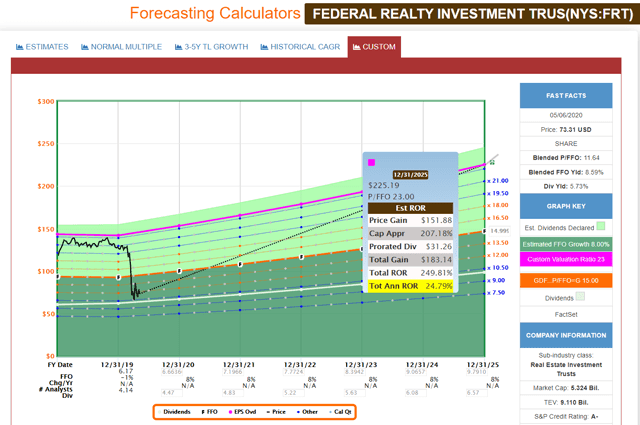
If FRT grows at 4% to 8% CAGR and returns to historical fair value (80% probability), then 17% to 25% CAGR are possible from these historically low levels.
(Source: F.A.S.T Graphs, FactSet Research)
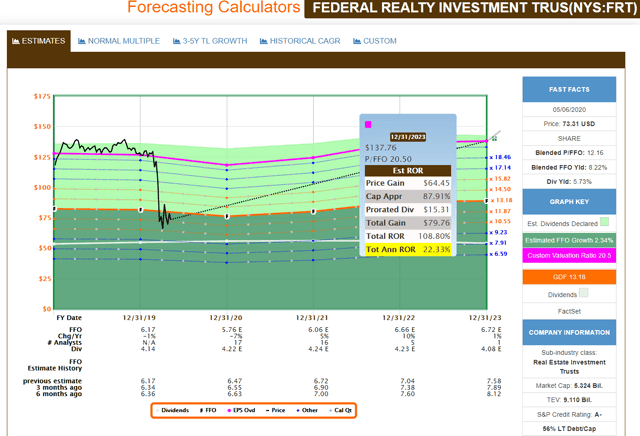
If FRT grows as expected and returns to the mid-range of historical fair value then the consensus total return potential through the end of 2023 is about 22% CAGR.
Such is the opportunity for anyone willing to invest in this high-quality if somewhat speculative REIT right now.
Don’t Forget About Prudent Risk Managment
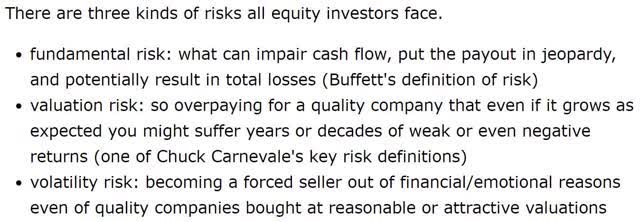 We’ve spent this entire article going over FRT’s fundamental risks, and I and most analysts remain confident that the best management team in the industry will see FRT through this latest crisis.
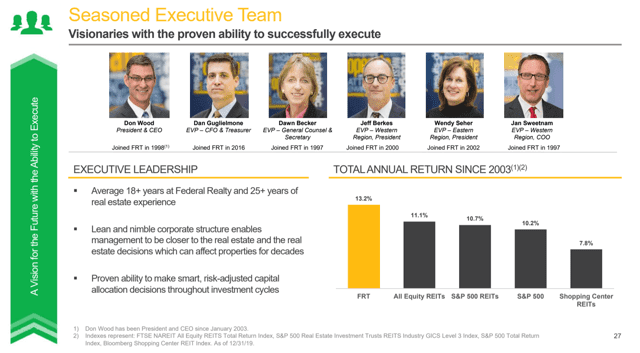
(Source: Investor Presentation)
The average executive at FRT has 25 years of real estate experience and has been at FRT for almost 20 years.
They are steeped in its conservative corporate culture, including maintaining the strongest balance sheet in the industry, which is why the dividend kept growing through the Financial Crisis.
All businesses are loosely functioning disasters, and some are profitable despite it.
At 30,000 feet, the world is beautiful and orderly. On the ground, it’s chaotic and confusing. Nothing ever goes to plan. Surprises lurk around every corner. Things are constantly breaking. Someone is always upset. Mistakes are made daily. Expecting anything less is being out of touch with reality. And remember, just because you’re now aware of it doesn’t change reality. It was that way before, you just didn’t realize it.” – Brent Beshore, CEO Permanent Equity
Remember that business is messy and no company has ever made investors a penny in profit because nothing went wrong, but despite something always going wrong.
FRT faces real fundamental risk, but the strongest balance sheet in the industry, combined with the best assets and best management team means it has what it takes to rise from the ashes of this recession and soar to new heights.
Valuation risk is very low right now, given the best valuation in 12 years.
However, volatility risk is something that all stocks face, because the lowest valuation in a decade might turn into the lowest of all time should the broader market rollover.
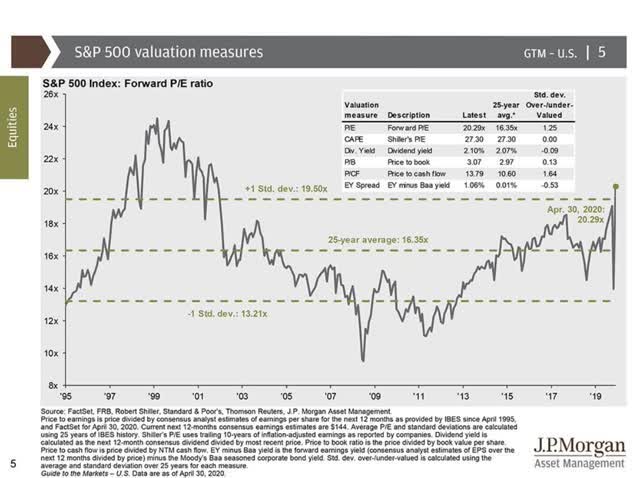 Stocks are now trading at 22.0 forward earnings, about 35% historically overvalued. That means there is about a 80% probability that stocks will fall in the coming months.
When, how much, and were they bottom is something no one knows, even if pundits on TV say otherwise.
 This is where a well-diversified and prudently risk-managed portfolio comes into play. As long as you remember that all stocks are risk assets, and maintain proper asset allocation, you can minimize the risk of becoming a forced seller.
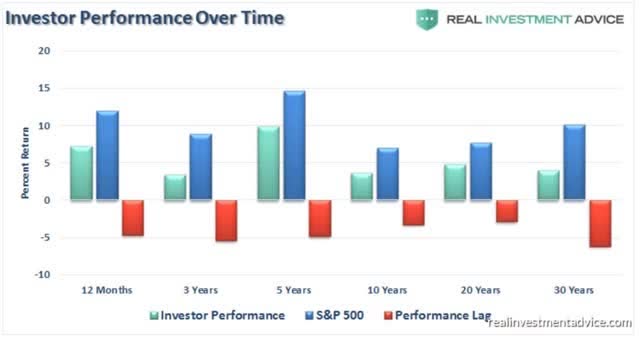
(Source: Dalbar, Lance Roberts)
75% of the reason investors do so terribly over time is improper asset allocation. This leads to either emotional or financial forced selling, such as not having sufficient cash/bonds to cover three to six years of expenses to ride out a bear market.
Dividends + pensions + social security need to be taken into account but you need to remember that no stock is a bond alternative.
 (Source: Ben Carlson)
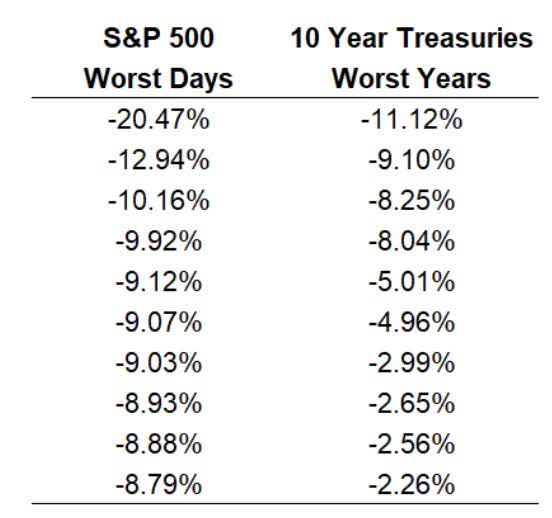
As Ben Carlson recently explained, a bad year for bonds is a bad day for stocks.
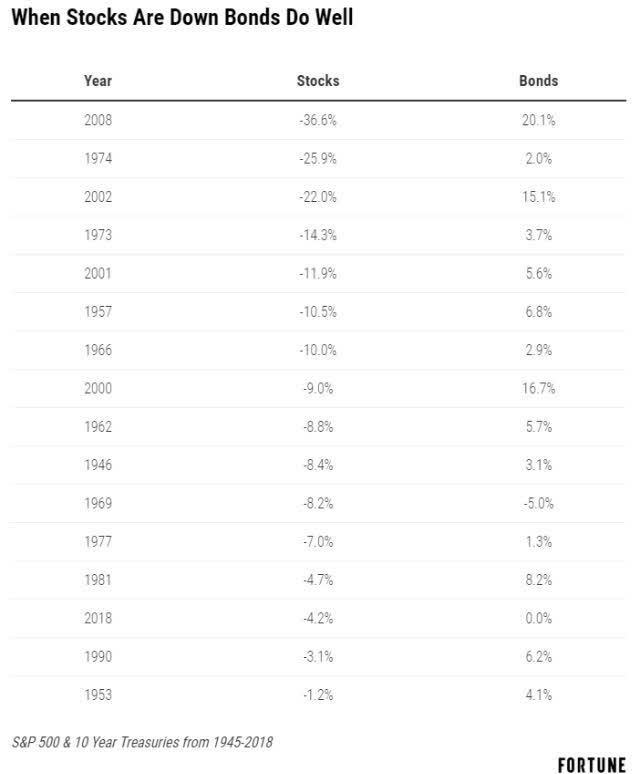 Bonds are NOT about income, they are about non-correlated assets that act as a store of value and a recession hedge.
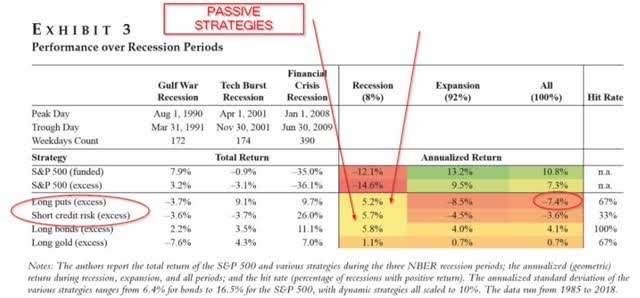 (Source: Duke University)
A study from Duke found that long bonds are the best passive hedging strategy, generating the same positive gains in recessions and the best positive returns in a growing economy.
Think about bonds in terms of protection, not yield. The stock market becomes more important when rates are on the floor but that doesn’t mean you can forsake bonds or cash altogether.
Most investors think about bonds in terms of yield or income. And why shouldn’t they? The vast majority of returns in bonds over time come from the starting yield, not price appreciation.
In a negative interest rate world, you have to change the way you think about bonds. Bonds always have acted as a shock absorber to stock market declines, but this becomes even more important when the yield is more or less taken out of the equation.
Bonds can provide dry powder to rebalance into the stock market or pay for current expenses when the stock market inevitably goes through a nasty downturn. Bonds keep you in business even if they don’t provide high returns as they have in the past.” – Ben Carlson
Rates might be very low right now, but that doesn’t change the fact that most people need to own some bonds and cash equivalents (like T-bills) to ensure they can ride out recessions like this one.
Just as Federal Realty has been able to deliver 52 consecutive years of growing dividends courtesy of a fortress balance sheet, so too must you make sure your SWAN portfolio has sufficient cash/bond buffers to last out this pandemic.
Bottom Line: Federal Realty Is Well Positioned To Survive The Worst Recession In 75 Years
There’s no denying that we’re witnessing history right now.
We can’t guarantee you that FRT will sail through this recession with ease, because no recession is easy and this is unlike any the world has seen.
Our diversified asset base is a major long-term asset…When a pandemic doesn’t shut down the whole world.” – Don Woods, FRT CEO
We don’t yet know how badly FRT’s tenants will suffer during a months-long restart process that will see some of its tenants fail.
Management says it will be one or two quarters until they can provide guidance and even that might not be possible this year.
However, the essence of long-term dividend growth investing is not avoiding a year of negative earnings/cash flow growth.
It’s about owning quality companies, great assets, run by competent and trustworthy management, and balance sheets capable of maintaining dividends even in negative growth years.
Every recession is different, and no crisis ever looks exactly the same. So while it’s true that no person has experienced a Great Lock Down recession before, and god willing never will again, betting on the strongest and safest names in any industry is a prudent long-term, high-probability decision.
Within a well-diversified and prudently risk-managed portfolio, a modest 2.5% or less position in FRT, from today’s most attractive valuation in 12 years, could deliver both generous and growing income as well as 17% to 25% CAGR long-term total returns.
Author’s note: Brad Thomas is a Wall Street writer, which means he’s not always right with his predictions or recommendations. Since that also applies to his grammar, please excuse any typos you may find. Also, this article is free: Written and distributed only to assist in research while providing a forum for second-level thinking.
We Created iREIT For The Do-It-Yourself Investor
For the DYI (do-it-yourself) REIT Investor, we make stock picking easier than ever, because we are days away from launching our iREIT Terminal product that sorts and screens for the best companies using our institutional-quality navigation tools. You do not want to miss the launch of our latest tools.

The FASTEST GROWING REIT Service on Seeking Alpha!
![]()
Disclosure: I am/we are long FRT. I wrote this article myself, and it expresses my own opinions. I am not receiving compensation for it (other than from Seeking Alpha). I have no business relationship with any company whose stock is mentioned in this article.
Be the first to comment