

traveler1116
Introduction
This article evaluates the progress and potential market impacts of what the Federal Reserve claims will be their largest Quantitative Tightening (QT) process in US history. Emphasis for this report is on the QT schedule unveiled by the Fed on May 4th and their current progress. We have had four prior QE programs to review for analysis. In addition, several tapering periods and the prior 2018 QT period will also be closely reviewed for market impacts.
Executive Summary
There have been four QE programs conducted by the Federal Reserve since the Global Financial Crisis through March 9th, 2022. We are currently in the first two months of the first QT period since 2018. So far the new “QT ramp 1” time period has been unusual and is included in the analysis that follows. The following average returns have been observed in each of the different periods:
- S&P 500 (SPY) returns during all 4 QE periods totaled +118.2% averaging +1.55% per month.
- S&P 500 returns after the conclusion of the 3 prior QE periods total +52.14% averaging +0.58% per month.
- S&P 500 returns during the 2018 QT ramp up period totaled -6.24% averaging -0.52% per month.
- S&P 500 returns during the 2019 QT removal period totaled +17.82% averaging +2.22% per month.
- In the recent period after QE 4 ended March 9th through the start of QT June 1st the S&P 500 was unchanged despite increasingly high volatility.
- In the current QT Ramp-1 period the S&P 500 is also nearly unchanged despite extremely high volatility.
VMBreakouts.com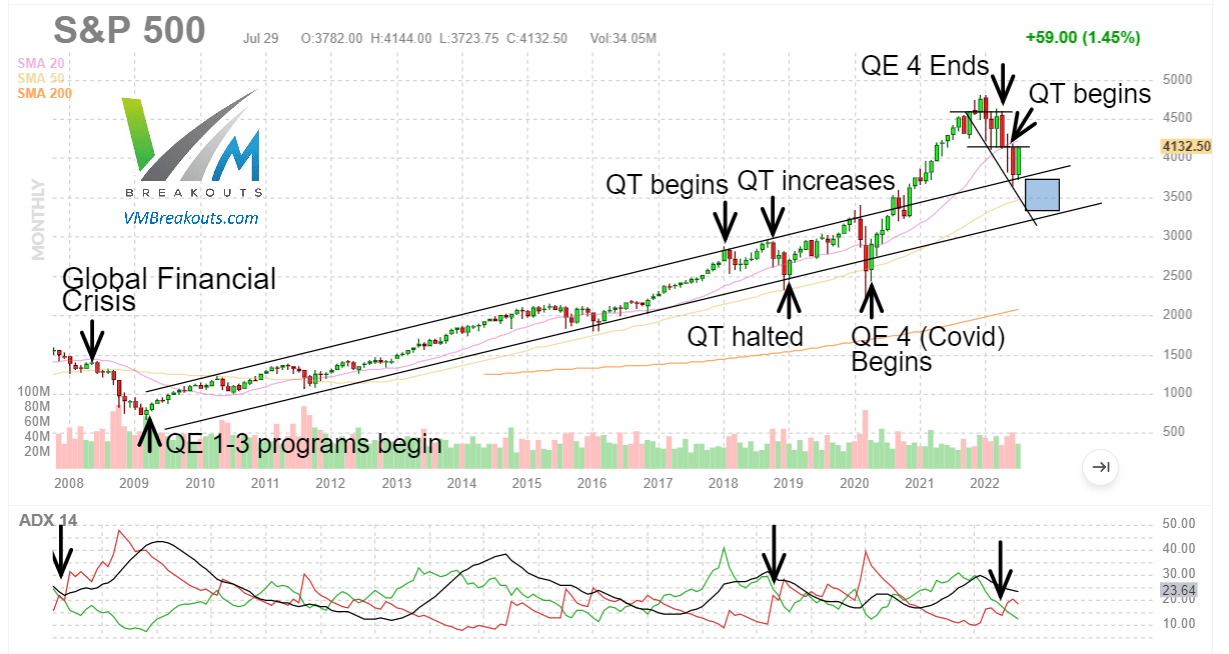
The S&P 500 chart above provides some context. We could still see a -15% decline in the S&P 500 without breaking the positive channel from 2009. We are in the second quantitative tightening program since the quantitative easing programs began after the Global Financial Crisis. June 2022 marks the first QT program since the Fed reduced their balance sheet in 2018. Prior market evidence and Fed emergency reactions to market corrections strongly suggests that QE programs improve market conditions while QT programs negatively impact the S&P 500 returns. This article expands on the analysis from the 2018 market cycle and the last update.
Analysis
Volatility in the post QE 4 stimulus period after March 9th 2022 is extremely high as illustrated below. The peak-to-trough volatility of the S&P 500 in the After QE4 Period was -18.1% back to an unchanged level of 0% for the index on June 1st. The QT Ramp-1 period volatility has been -13% back to an unchanged level of 0% after two months with August remaining until the Ramp-2 period begins.
FinViz.com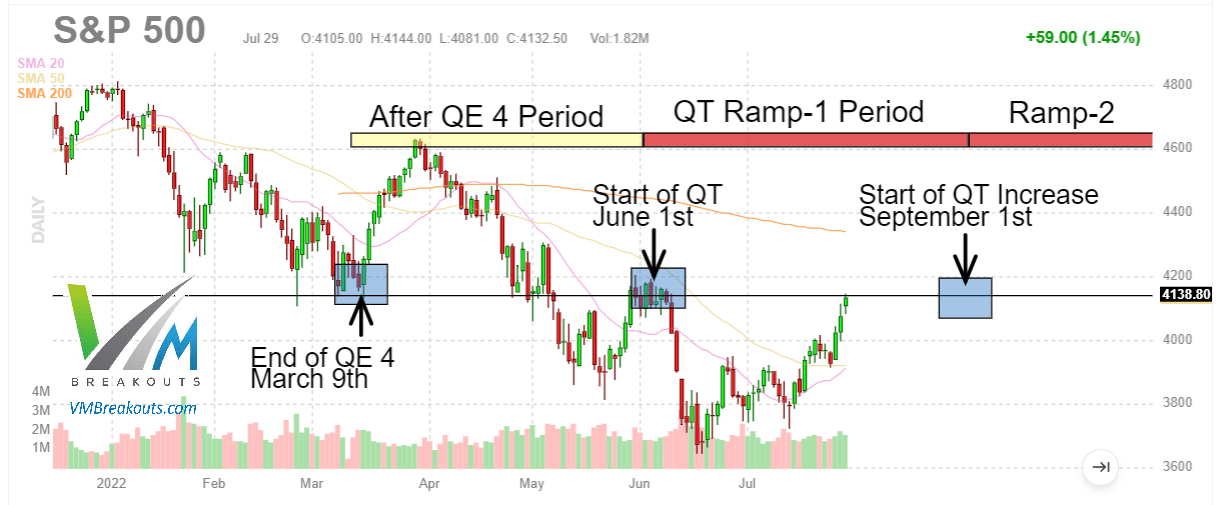
To put it into perspective, in just the two post QE 4 periods we have seen peak-to-trough combined moves of 31% on the S&P 500 confirming very high volatility that is likely to continue.
Fed Fund Rate Hikes
In the last rate hike regime the Federal Reserve hiked rates nine consecutive times from 2015 before halting at the market lows on December 19th, 2018. So far in 2022 the Fed has conducted four rate hikes to the highest levels since 2018. The rate hikes are now the sharpest increases in 22 years. Every prior rate hike regime since the 1980s has ended with lower highs than the initial target and with lower rates than the previous hiking program. Some attribute this pattern of declining rate peaks to the rising cost of carrying more debt and the inability of any Federal Reserve hiking regime to sustain higher rates that result in the government paying higher debt interest payments.
St. Louis Fed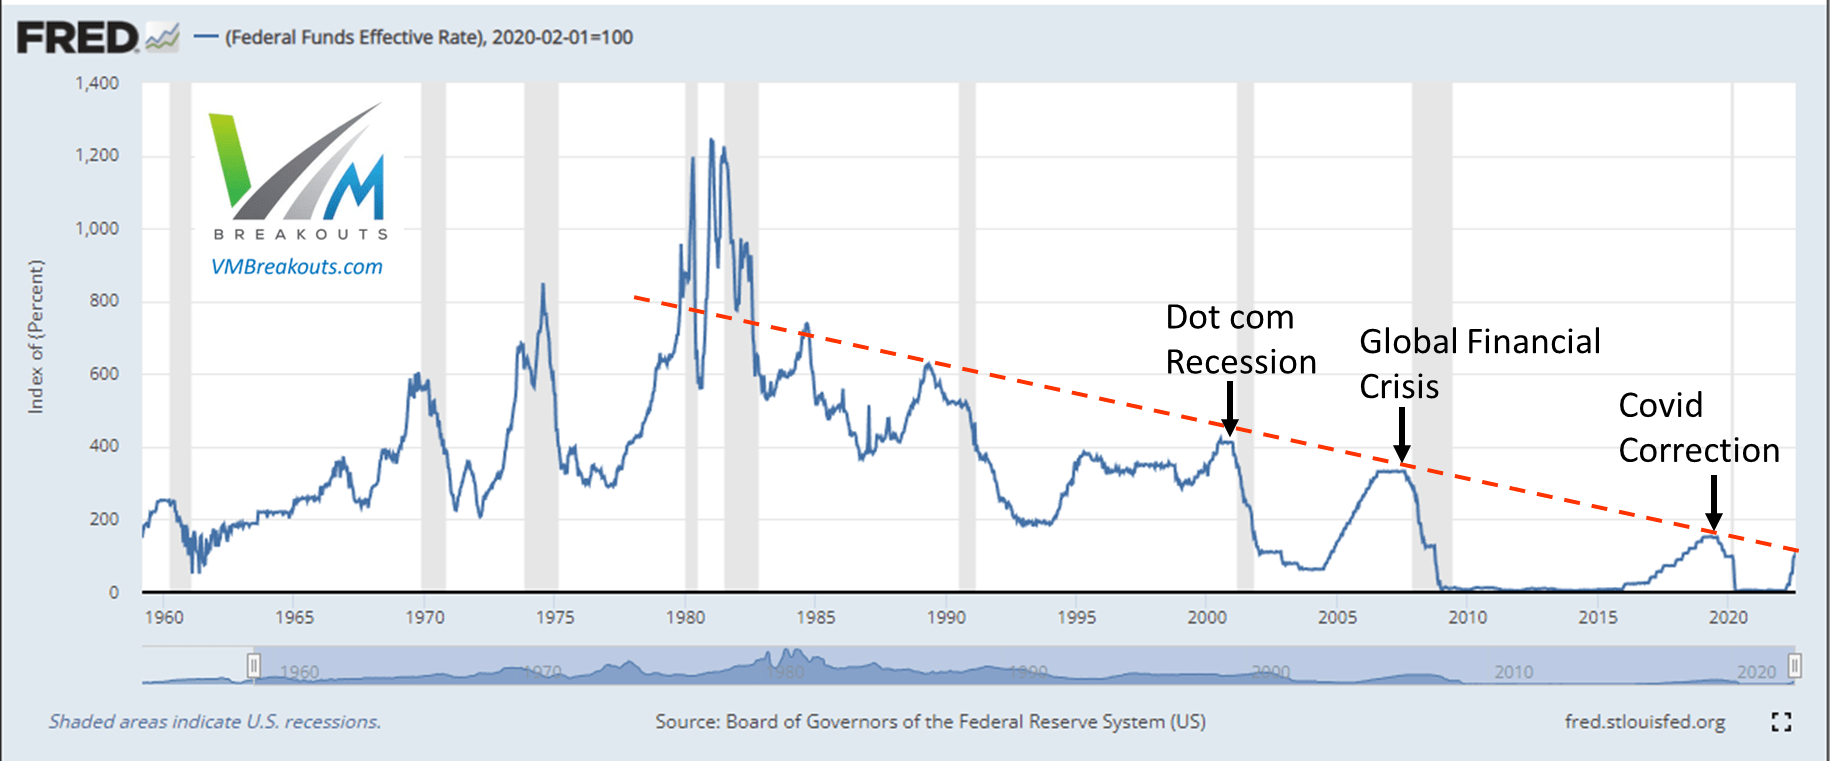
Every recession shown in gray above was preceded by a period of rising interest rates. For 2022 a recession has now been confirmed with two consecutive quarters of declining productivity. Historically, the Fed has reduced rates in nearly all the confirmed recessionary periods. However, this week Chairman Powell confirmed that the high inflation levels are of primary concern and interest rate hikes will continue.
We’re going to get our policy rate to level where we are confident inflation will come down to 2%.
~ Chairman Powell, July 27, 2022.
At least one analyst believes the Fed cannot move the Fed funds rate above 1% without serious economic impact. We are now at a target range of between 2.25% and 2.5% on the Fed funds rate well above the trendline from the 1980’s illustrated above and extended on the chart below.
Yardeni Research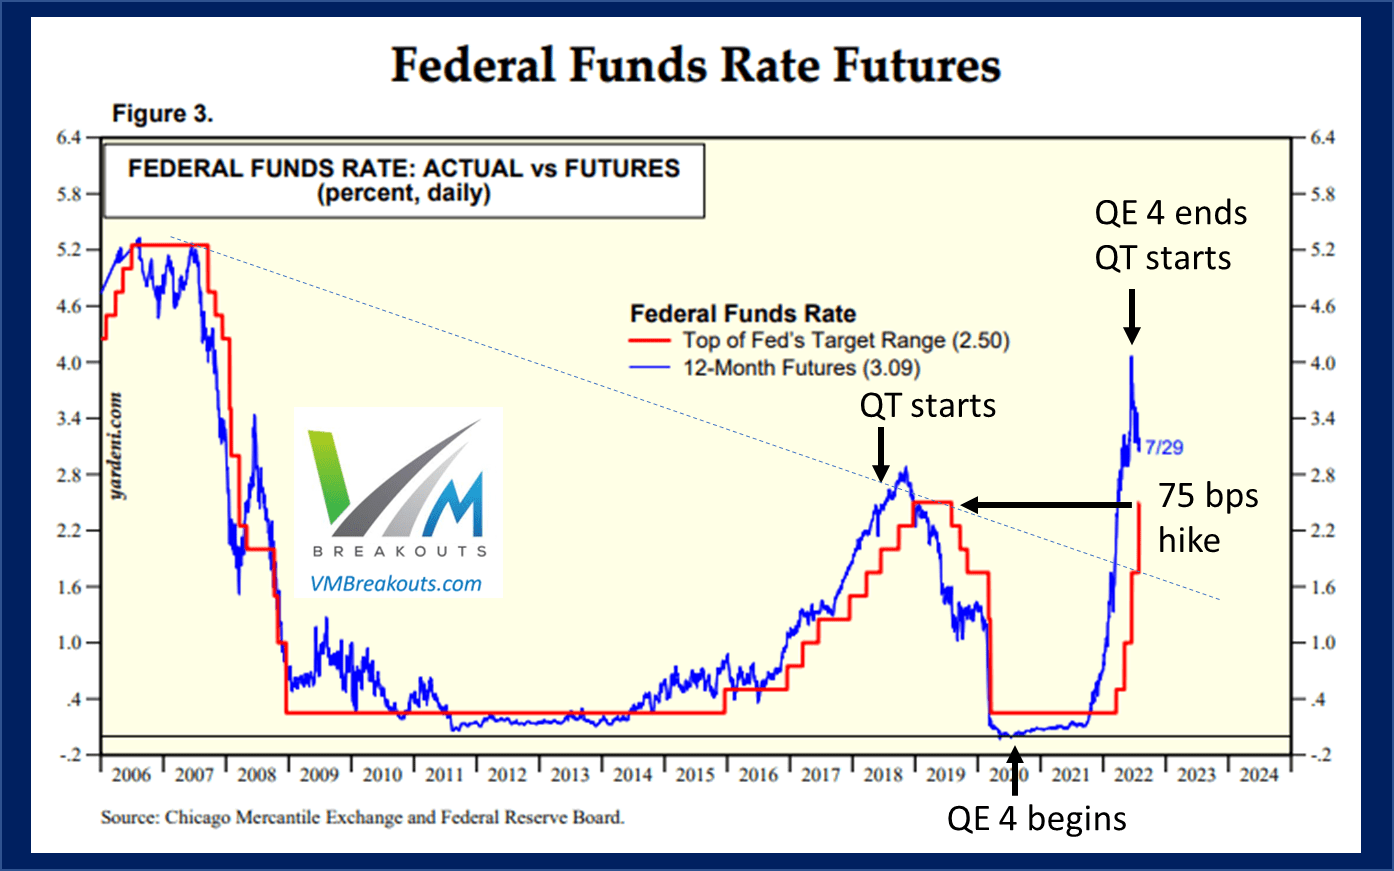
The correlation between rate hikes and S&P 500 returns indicates that it is not the number of hikes that impacts the market as it is the level of interest rates that suddenly trigger outflows from the market to cash and other securities. Rates at the highest levels since 2018 could trigger similar market reactions as Q4 2018 by the end of the year. However, I submit the larger concern will be the liquidity drain from the Federal Reserve’s quantitative tightening schedule.
Federal Reserve Program Analysis
Next we will look at the S&P 500 performance during each these periods as well as the time in between each of these accommodative periods of easing. The purpose is to provide a general forecast of what we might expect now that QE4 has ended and what may occur when the next quantitative tightening period begins in June. Once again I have added more events on the schedule as more information has been obtained.
| Federal Reserve Program | S&P 500 Return | Duration/Mo | Avg/Mo |
| QE1 (Nov 2008 – Mar 2010) | +20.72% | 17 months | +1.22% |
| After QE1 | +6.89% | 9 months | +0.76% |
| QE2 (Nov 2010 – Jun 2011) | +9.21% | 9 months | +1.02% |
| After QE2 | +7.10% | 15 months | +0.47% |
| QE3 (Sep 2012 – Oct 2014) | +43.47% | 26 months | +1.67% |
| After QE3 | +43.17% | 39 months | +1.10% |
| QT ramp 1 (Jan 2018 – Sep 2018) | +8.99% $30B/mo | 9 months | +0.99% |
| QT ramp 2 (Oct 2018 – Dec 2018) | -13.97% $50B/mo | 3 months | -4.65% |
| QT removal (Jan 2019 – Aug 2019) | +17.82% | 8 months | +2.22% |
| QE4 (Mar 2020 – Mar 2022) | +44.81% | 24 months | +1.87% |
| After QE4 | 0% | 4 months | 0% |
| QT ramp 1 (Jun 2022 – Aug 2022) | $47.5 Billion/mo | 3 months | 0% to Aug |
| QT ramp 2 (Sep 2022 – ?) | $95 Billion/month | ? months | ? |
| QT removal (?) | ? | ? months | ? |
- The largest average monthly returns for the S&P 500 occurred during accommodative Fed programs of QE and during the QT removal period.
- The QT removal period saw the largest interest rate reductions by the Fed and also much less tightening each month until no liquidity was being drained by the Fed.
- QE4 was by far the largest easing program and corresponds with the highest monthly S&P 500 average returns.
- QE1 and QE3 were of near equal levels of Fed intervention and both larger than QE2 and both also reflected higher S&P 500 returns than those during QE2.
- In all prior cases after each QE program ended the S&P 500 returns remained positive or non-negative.
We are currently in the June-August QT ramp 1 up to $47.5 billion per month liquidity drain from the Fed. What should we expect now that we know the Federal Reserve’s proposed QT schedule?
Forecasting the Market Impact
We are two months into the largest proposed QT schedule in US history and the S&P 500 is unchanged from June 1st despite extreme volatility. Incredibly the S&P 500 is also unchanged from March 9th, the end of the QE 4 program. What should we expect now?
- As expected the S&P 500 monthly average returns have become much more volatile since the end of QE4 and the start of QT in June.
- In the prior QT ramp in 2018 volatility was extreme and I tracked and traded leveraged funds very aggressively through the negative Momentum Gauge signals to the end of December.
- We have had only one quantitative tightening period in 2018 to evaluate and it corresponded to negative S&P 500 returns and very high market volatility.
In this update I will be looking more closely at the progress of the QT schedule and with comparisons to 2018 to try to anticipate how the reduction in market liquidity may impact markets in 2022. The prior QT schedule of Fed tightening in 2018 correlated strongly with the CBOE VIX volatility index as I wrote about frequently in those years. Members can review Section 10 of the Members’ Library for many more articles and charts.
| Federal Reserve Program | S&P 500 Return | Duration/Mo | Avg/Mo |
| QT ramp 1 (Jan 2018 – Sep 2018) | +8.99% $30B/mo | 9 months | +0.99% |
| QT ramp 2 (Oct 2018 – Dec 2018) | -13.97% $50B/mo | 3 months | -4.65% |
| QT removal (Jan 2019 – Aug 2019) | +17.82% | 8 months | +2.22% |
| QE4 (Mar 2020 – Mar 2022) | +44.81% | 24 months | +1.87% |
| QT ramp 1 (Jun 2022 – Aug 2022) | $47.5 Billion/month | 3 months | 0% to Aug |
| QT ramp 2 (Sep 2022 – ?) | $95 Billion/month | ? months |
August through the end of the year may deliver some record volatility as liquidity drains at rates never seen before.
System Open Market Account Holdings of Domestic Securities
The Federal Reserve System Open Market Account (SOMA) contains dollar-denominated assets acquired through open market operations. These securities serve several purposes. They are:
- collateral for U.S. currency in circulation and other liabilities on the Federal Reserve System’s balance sheet;
- a tool for the Federal Reserve’s management of reserve balances; and
- a tool for achieving the Federal Reserve’s macroeconomic objectives.
VMBreakouts.com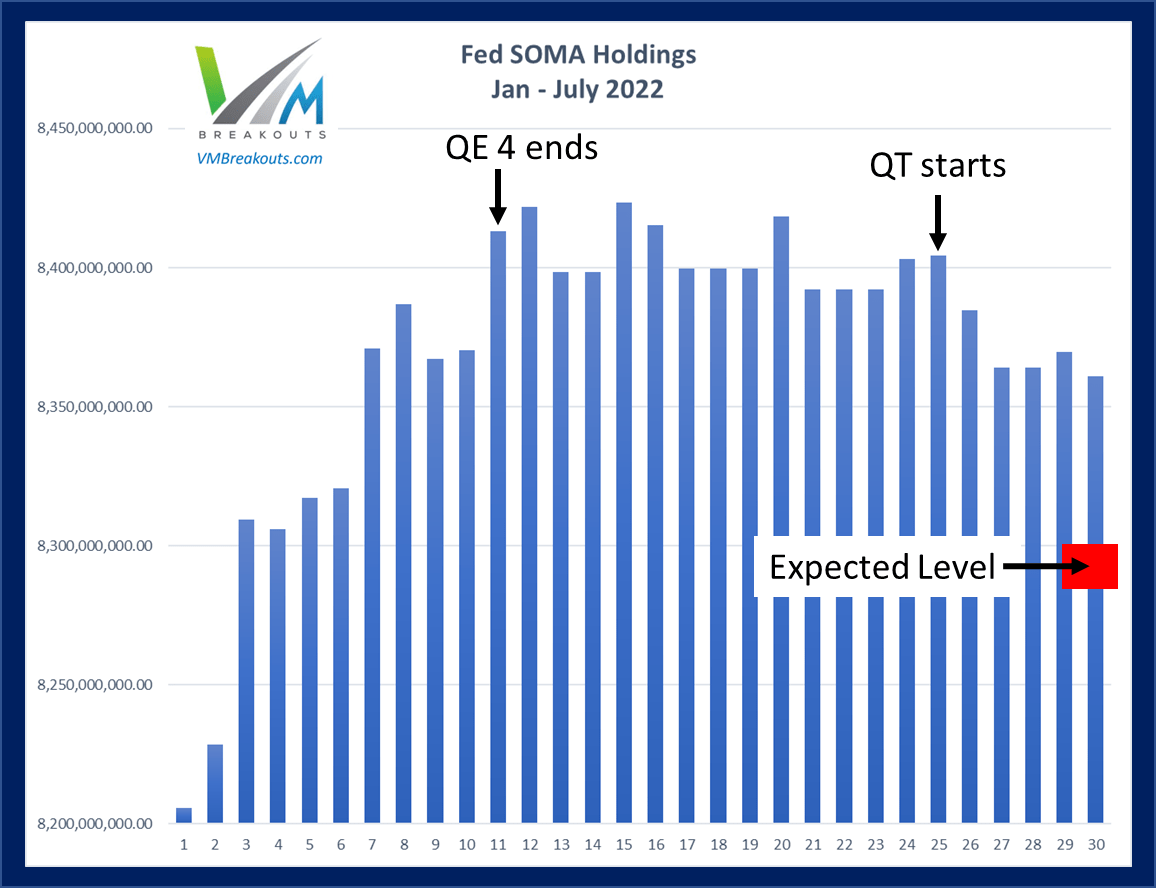
The chart of the Fed balance sheet of domestic securities shows the balances above the $8.2 trillion level from the first week of January 2022 for a better visual of the 30 weekly adjustments so far this year. Since the end of QE 4 in March the balance sheet has remained relatively flat until the start of the balance sheet reduction. Actual weekly reductions did not begin until Week 25 or the middle of June.
Balance sheet reduction is working fine, markets have accepted it, and should be able to absorb it.
~ Chairman Powell, June 27, 2022.
While Chairman Powell sounded optimistic this week about continuing reductions, the Fed has actually been moving very slowly and well behind schedule. According to the Fed’s proposed schedule we would see up to -$47.5 billion monthly reductions in their balance sheet between June and August. While the -$47.5 billion is a cap that the Fed does not have to hit, since the start of June we have only seen a total reduction of -$31.2 billion in two months. In other words, the Fed has accomplished roughly 22% of the stated reduction with $111.3 billion reduction left to go for August if they intend to hit the monthly caps before the September scheduled increase. The current expected level at the start of August is just below $8.3 trillion shown in red on the chart above.
Balance sheet reduction will be picking up steam.
~ Chairman Powell, July 27, 2022.
Questions at the Fed press conference on Wednesday did not get into the details of what “picking up steam” would look like for August. We do know that the Fed indicated a -$95 billion monthly increase in the tightening starting in September. This doubling of the balance sheet reduction along with the highest Fed fund rates since 2018 could mark a moment of stress for the markets as it did four years ago with the QT Ramp-2 in the October time frame at -$50 billion reductions per month.
No one can be sure on whether we can achieve a soft landing.
~ Chairman Powell, July 27, 2022.
As prior charts and those shown below of the 2018 correction indicate, there was not a soft landing in the 2018 QT program. In fact the effort had to be halted abruptly in December along with a sharp reduction in fund rates much sooner than the Fed originally planned. We have only one prior data point to consider and while there are many similarities to 2018 there are major differences as well.
S&P 500 and VIX volatility 2018 review
A move by the VIX above 32 back in 2018 was considered “Volmageddon” and it knocked out volatility funds into delisting. Moving from 12 to 20 on the volatility index was a very big deal in 2018. The VIX is based on derivatives of the S&P 500 and correlates strongly with S&P 500 price movement.
VMBreakouts.com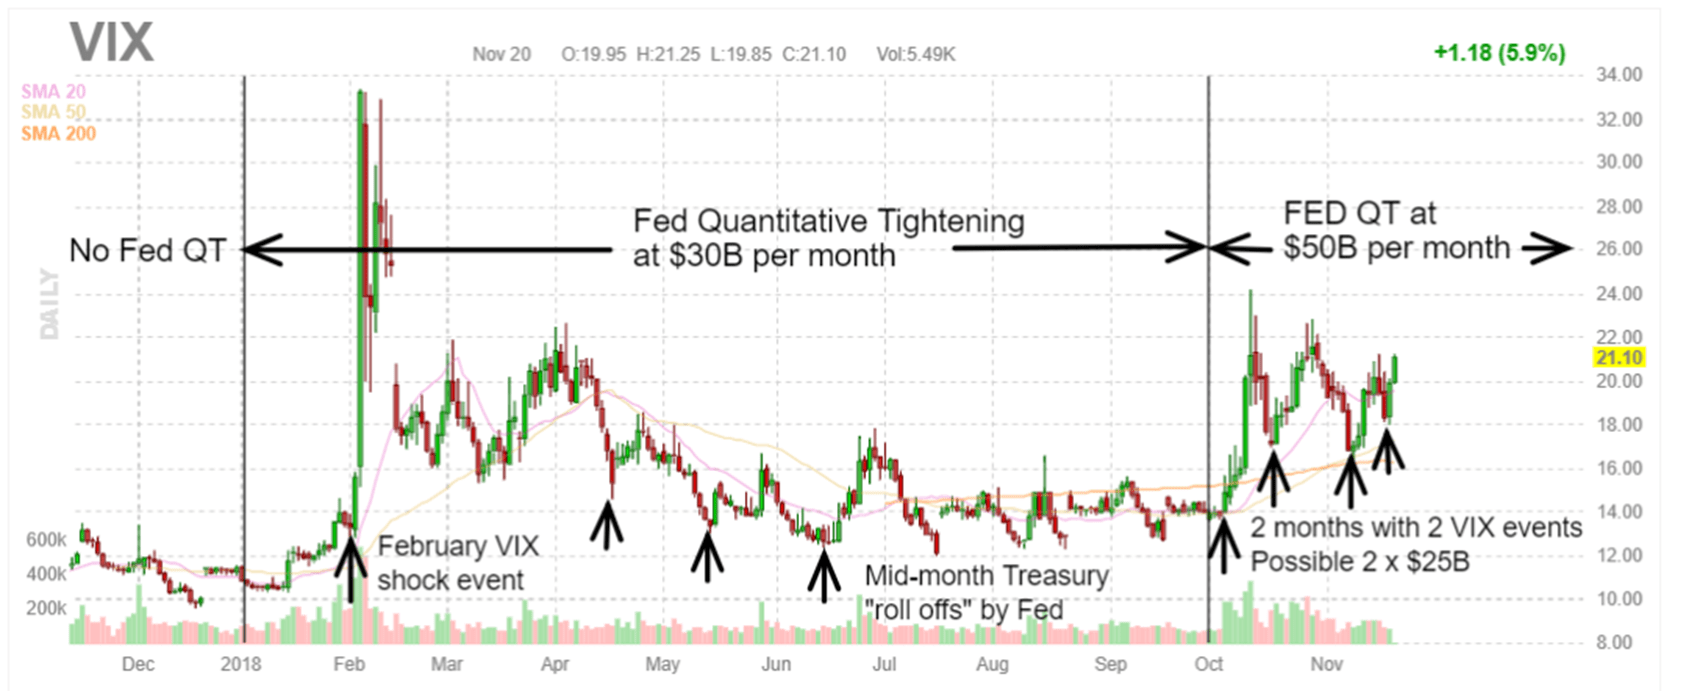
After the huge initial shocks in February, the S&P 500 weathered the first round of quantitative tightening well until October. The ramp from -$30 billion to -$50 billion suddenly became too much for the markets to bear. This selloff also corresponded to the highest rate hikes in the Fed’s 2018 tightening program. Coincidentally, we are now at those same Fed fund rates in July 2022 with more hikes indicated in the months ahead to fight off inflation.
VMBreakouts.com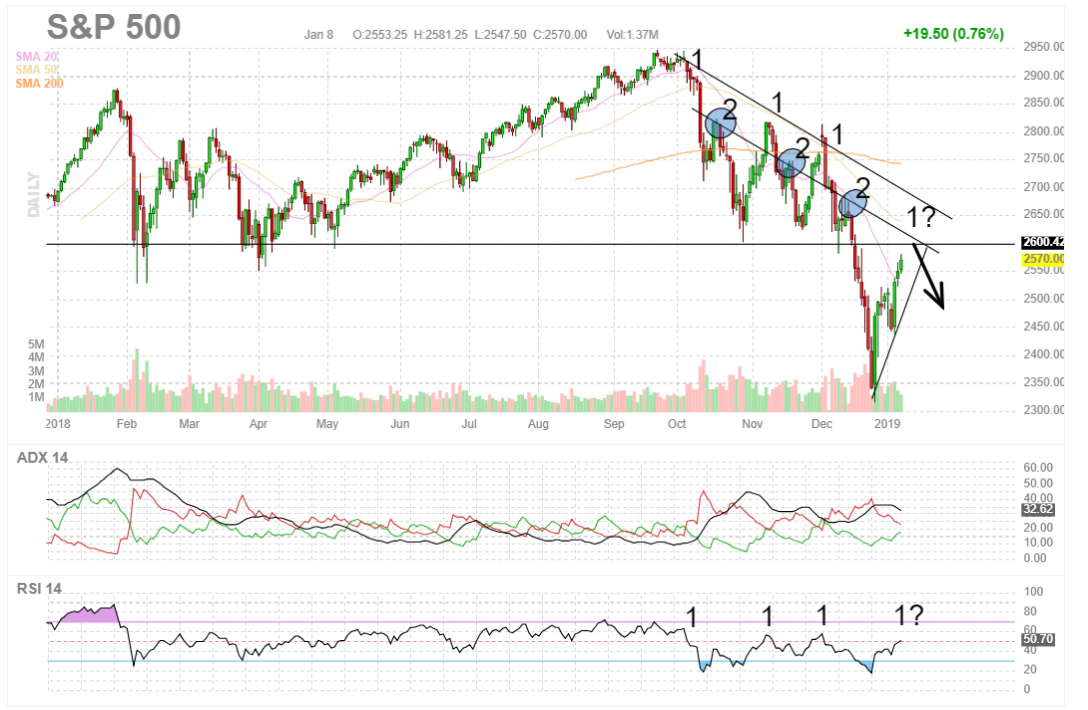
Related to this period of tightening in 2018, I conducted a study comparing the VIX volatility to the size of the reduction in treasury securities held by the Federal Reserve. The analysis detailed in articles linked above basically illustrates that the more the Fed reduced asset holdings, the higher the market volatility became:
VMBreakouts.com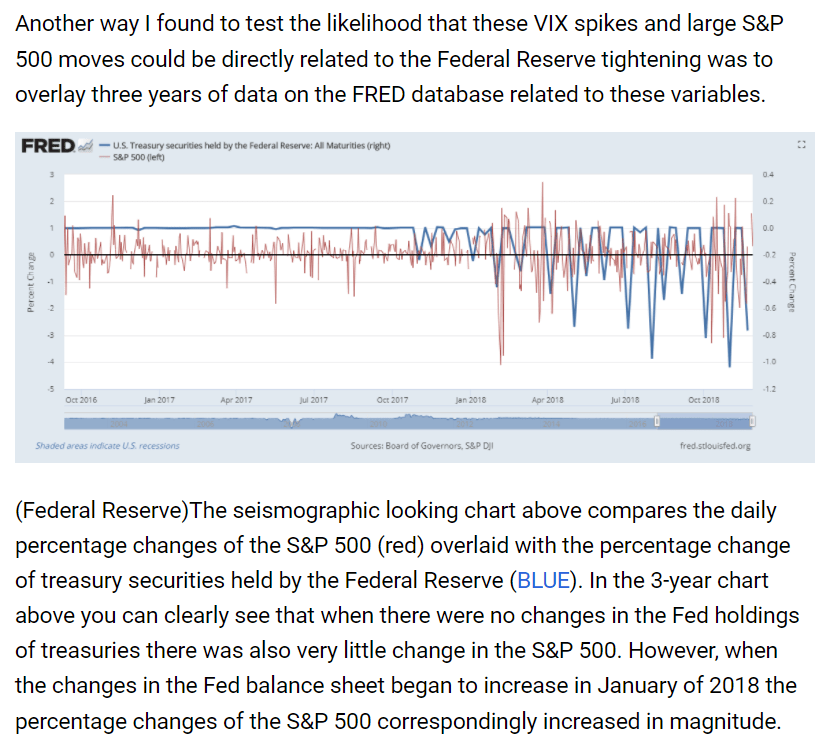
Currently the Fed holds a large percentage of the treasury market now estimated at over 25% into 2022. This high balance shown below from record amounts of QE4 purchases increases the risk that future tightening events may be longer and more severe than we experienced in 2018. The Fed remains committed to achieving their goals and as Chairman Powell indicated again this week,
Getting down to new balance sheet equilibrium could take 2 – 2.5 years.
Refinitiv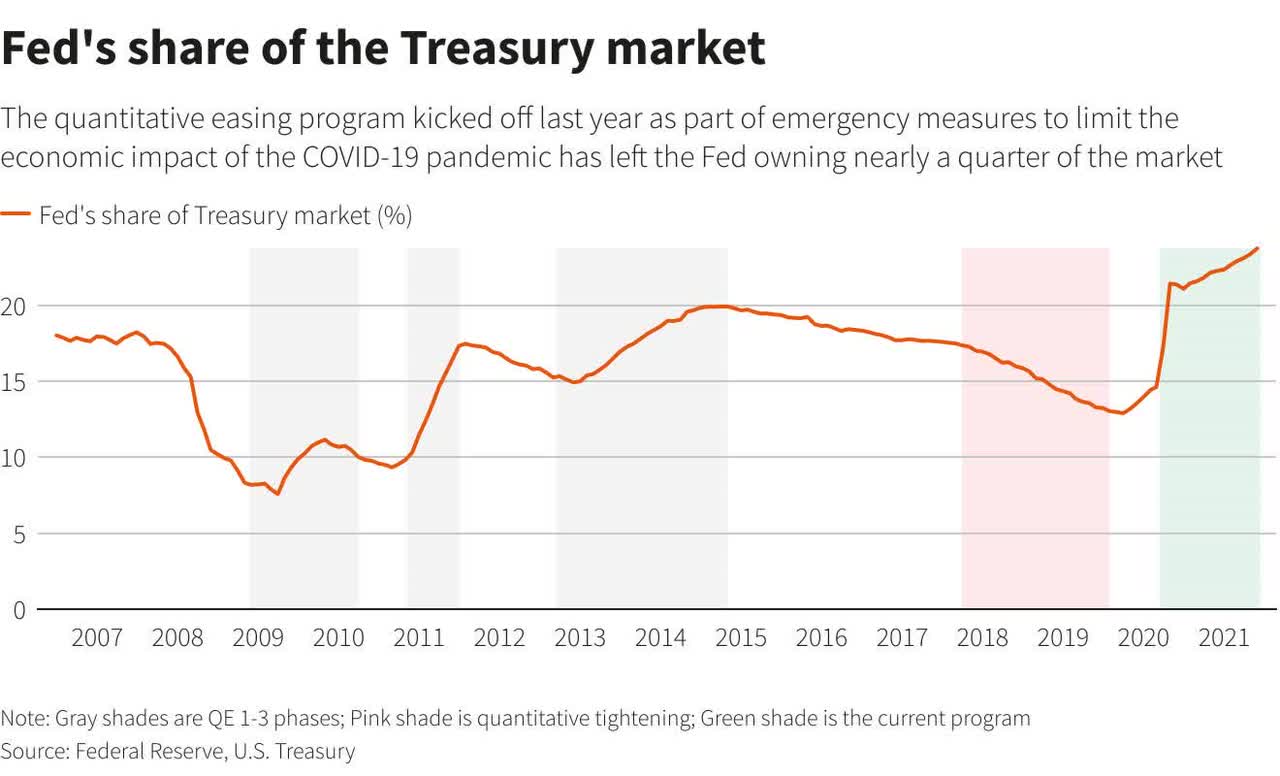
Conclusion
The next most important phase for the markets will be this new “picking up steam” phase of the QT asset reduction program. There are no shortage of major economic factors that will continue to impact the market performance for 2022 and beyond. Inflation measures are at the highest levels in 40 years. The US GDP missed estimates in Q1 and Q2 moving further into recessionary conditions and Congress has again approved more stimulus to help the economy.
Many factors may affect the analysis shared here today. The purpose of this article is to provide some guidance about what the end of the largest QE program in U.S. history and the start of the largest QT program may mean to investors. It is likely that market returns will decline in the coming months with the proposed programs taking their full effect. The information above is intended to provide readers with additional insight into the potential market reactions in the coming year.
Thanks for reading and all the best in your investing decisions!
JD Henning, PhD, MBA, CFE, CAMS
Be the first to comment