

bodnarchuk
Introduction
The Toronto-based Alamos Gold (NYSE:AGI) released its second quarter of 2022 results on July 27, 2022.
Note: This article is an update of my article published on May 3, 2022. I have followed AGI on Seeking Alpha since August 2017.
1 – 2Q22 results Snapshot
The company posted revenues of $191.2 million in 2Q22 and a net income of $6.4 million or $0.02 per share. Revenues were down 2% from the 2Q21.
AGI declared a quarterly dividend of $0.025 per share (annualized rate of $0.10). Below is shown the 2Q22 highlights:
AGI Presentation 2Q22 Highlights (Alamos Gold)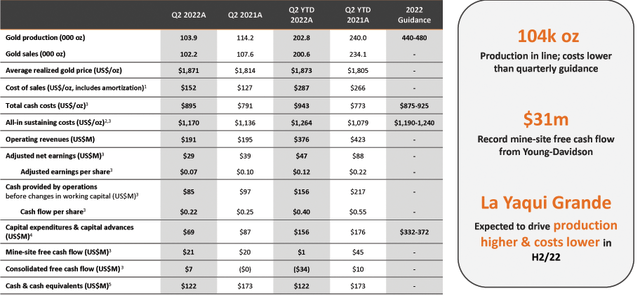
The quarterly production was 103.9K Au ounces, a 9% drop from the second quarter of last year. A solid performance at Island Gold could not offset the lower production at Mulatos mine and Young Davidson.
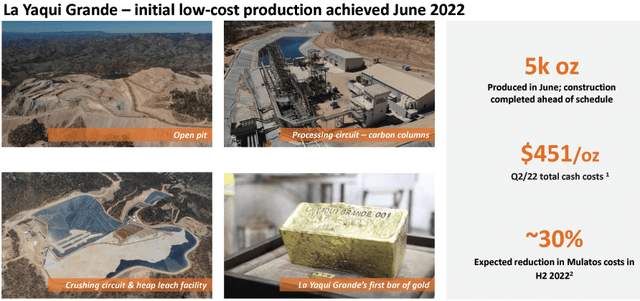
AGI Quarterly gold production per mine (Fun Trading) La Yaqui Grande achieved initial gold production in June 2022, following the completion of construction ahead of schedule. La Yaqui Grande construction was completed, with total capital spending on the project of $161 million. La Yaqui Grande produced 5k Au Oz in June. AGI La Yaqui Presentation (Alamos Gold)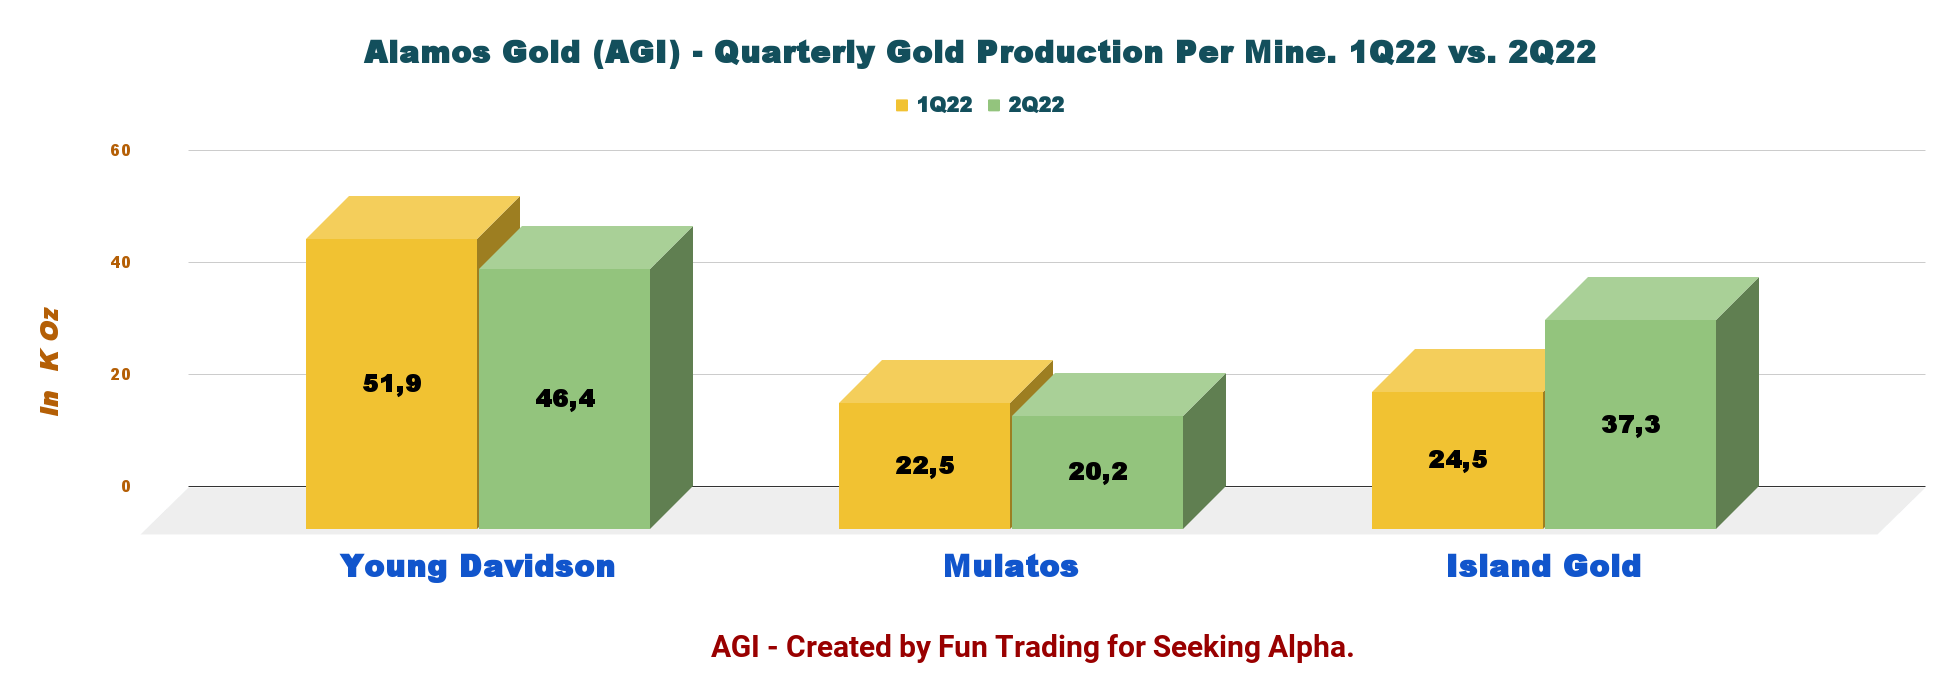
Alamos Gold also owns two other ongoing projects at the moment. Gold production is expected to increase significantly by 2025.
- The Island Gold expansion Phase III Ontario, Canada. With 2,400 TPD by 2026.
AGI Island Gold (Alamos Gold Presentation)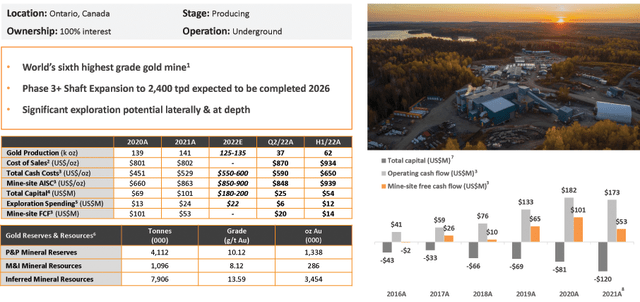
On June 28, 2022, the Company reported the results of the Phase 3+ Expansion Study conducted on its Island Gold mine. The P3+ Expansion Study was an update to the Phase 3 Study released on July 14, 2020.
The new study indicates higher production, with average annual gold production of 287K Au ounces starting in 2026 upon completion of the shaft.
Third quarter activities will include completion of site clearing and preparation of the shaft area, with the pre-sink of the shaft expected to begin in August 2022. AGI spent $15.3 million in growth CapEx in 2Q22.
- The Lyne Lake project with construction decision expected in H2 2022 (EIS approval & construction decision). The average annual production expected is 143K Au ounces over a 10-year mine life at an average mine-site AISC of $745 per ounce.
AGI Lynn Project (Alamos Gold Presentation)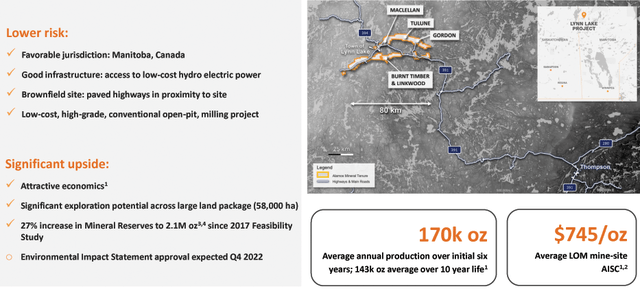
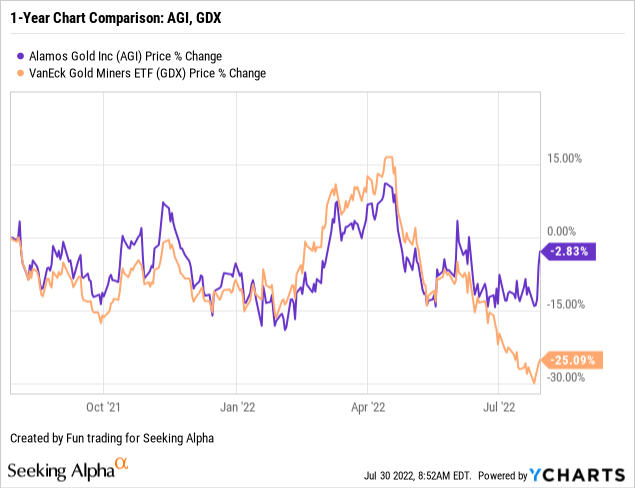
2 – Stock Performance
AGI is outperforming the VanEck Gold Miners ETF (GDX) and is now down 3% on a one-year basis.
John A. McCluskey, President and Chief Executive Officer, said in the conference call:
We had a good second quarter on multiple fronts, meeting our short-term operational targets while also delivering on 2 key growth initiatives, including achieving first production at La Yaqui Grande and announcing a larger and more profitable Phase III expansion of Island Gold. Both have solidified our strong outlook supporting growing production and declining costs.
3 – Investment Thesis
The investment thesis continues to be the same as indicated in my preceding articles. Alamos Gold is an excellent company with excellent financials, no debt, and solid cash.
The Yaqui Grande is now producing. The recently reported results of the Phase 3+ Expansion Study conducted on the Island Gold mine demonstrate a significant growth potential for the next few years, reinforcing the rationale for a long-term investment.
Furthermore, it is a gold producer with assets exclusively in the Americas.
Thus, I recommend AGI as a perfect candidate for long-term investment and use the recent weakness to build up a position.
Gold trend up from a recent selloff on the news. The gold price recovered last week after the FED decided to hike interest another 75-point. Inflation is a concerning issue for the global economy, and it is increasingly evident that we are sliding into a recession in 4Q22. This outlook makes an investment in gold miners even more appealing.
AGI GOLD SILVER comparison 1 Year chart (Fun Trading)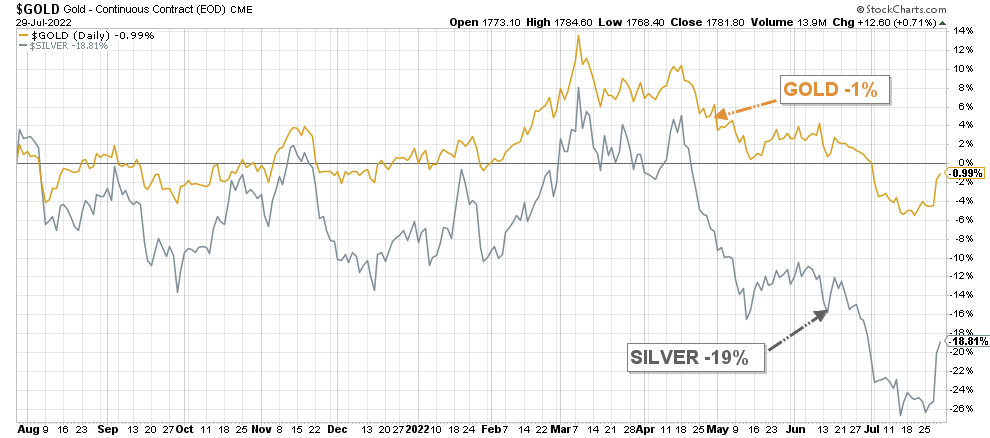
Alamos Gold – Financial Snapshot 2Q22 – The Raw Numbers
| Alamos Gold | 2Q21 | 3Q21 | 4Q21 | 1Q22 | 2Q22 |
|
Total Revenues $ million |
195.1 | 198.0 | 203.1 | 184.5 | 191.2 |
| Quarterly Earnings $ million | -172.5 | 25.10 | 29.5 | -8.5 | 6.4 |
| EBITDA $ million | -129.9 | 100.0 | 88.0 | 70.9 | 45.9* |
| EPS (diluted) $ per share | -0.44 | 0.06 | 0.07 | -0.02 | 0.02 |
| Cash from Operating Activities $ million | 86.7 | 82.4 | 88.1 | 46.5 | 75.7 |
| CapEx in $ | 86.9 | 89.2 | 119.0 | 87.3 | 69.0 |
| Free Cash Flow | 3.2 | -6.8 | -30.9 | -40.8 | 6.7* |
| Total cash $ million | 256.3 | 234.3 | 196.4 | 145.2 | 144.0 |
| Total LT Debt in $ million | 0 | 0 | 0 | 0 | 0 |
| Dividend $/ share (semi-annual) | 0.025 | 0.025 | 0.025 | 0.025 | 0.025 |
| Shares Outstanding | 392.8 | 395.9 | 392.3 | 391.9 | 394.5 |
Source: Company press release
* Estimated by Fun Trading
Gold Production Details
1 – Second Quarter of 2022 Revenues
AGI Quarterly Revenues history (Fun Trading)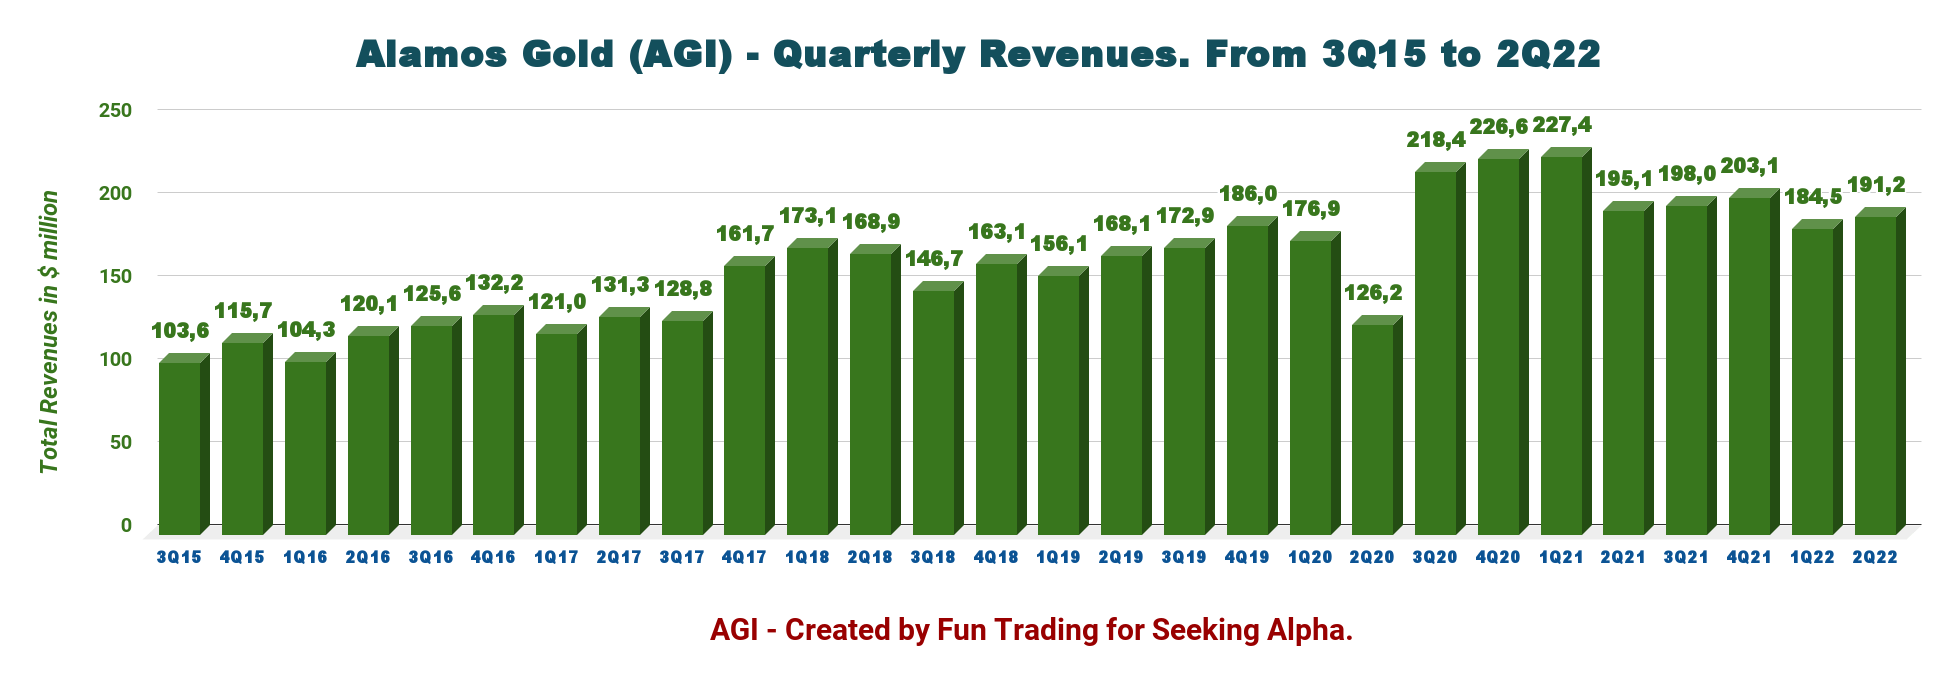
The company indicated a net income of $6.4 million, or $0.02 per share, up from a loss of $172.5 million or $0.44 per share in 2Q21.
Mining and processing costs were $89.2 million, 9% higher than the prior year. The increase was primarily related to higher processing costs at Mulatos associated with stockpiled ore.
2 – Free cash flow was estimated at $6.7 million in 2Q22
AGI Quarterly Free cash flow history (Fun Trading) Trailing 12-month free cash flow was a loss of $71.8 million, and the company posted an FCF of $6.7 million in 2Q22. After completing the La Yaqui Grande mine, I expect more free cash flow in the next few quarters.
3 – The company is debt-free (net cash) and had total cash of $144 million in 2Q22
AGI Quarterly Cash versus Debt history (Fun Trading)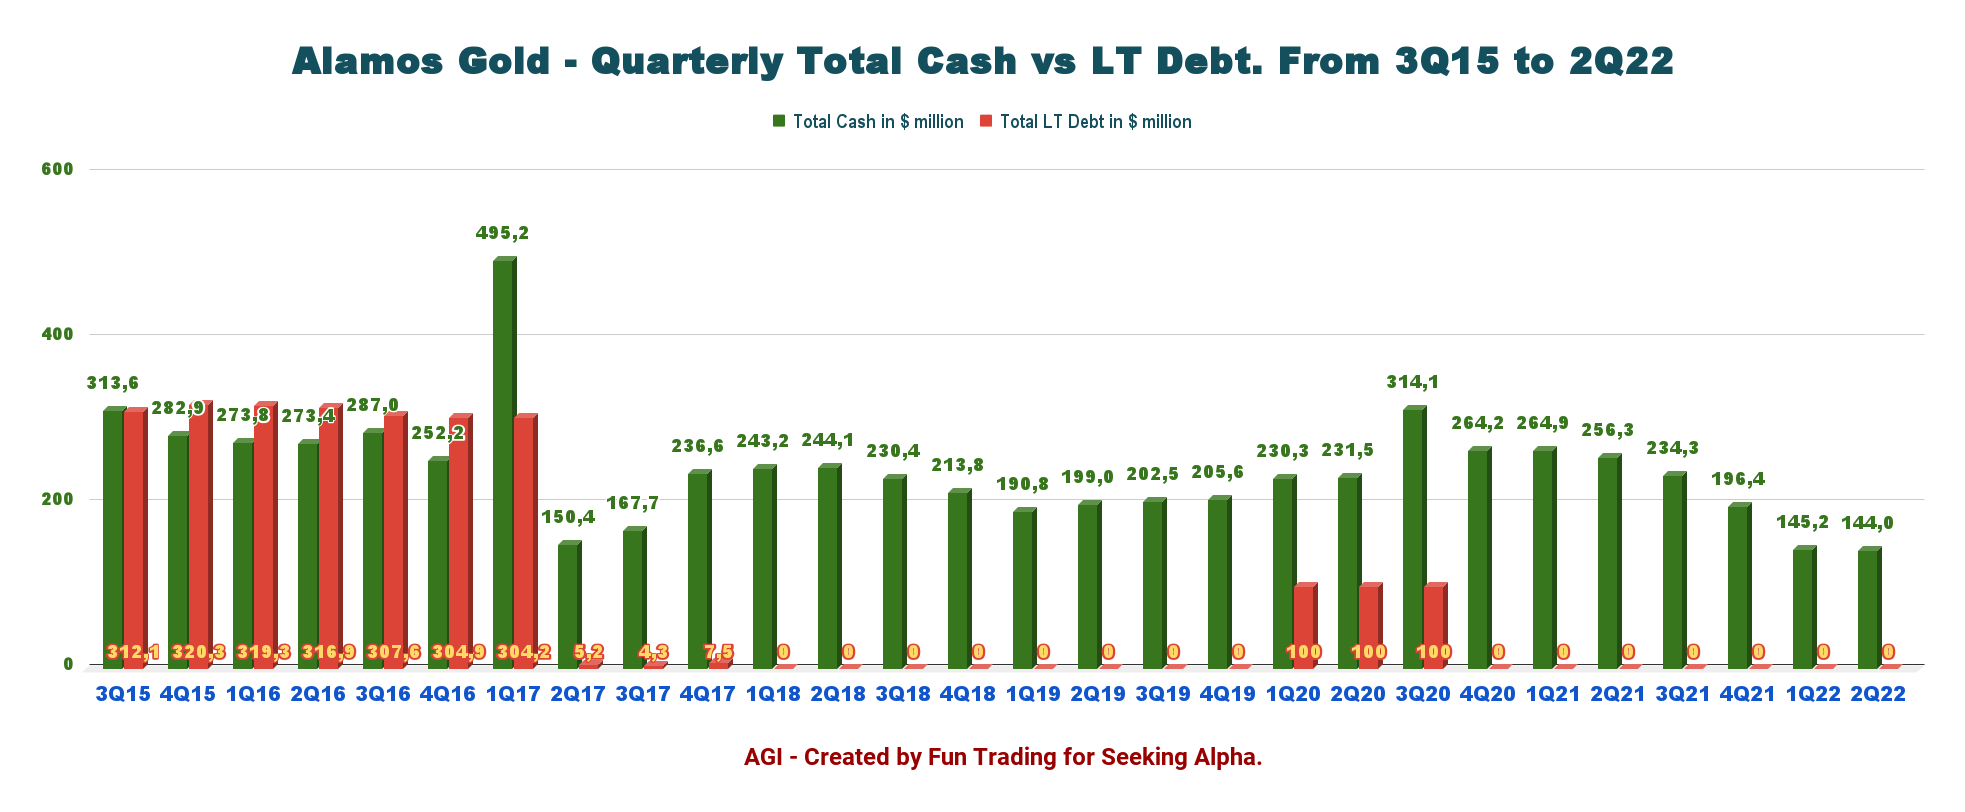
The company has no debt and $144.0 million in cash and cash equivalent. Total liquidity is now $622 million.
AGI Balance sheet (Alamos Gold)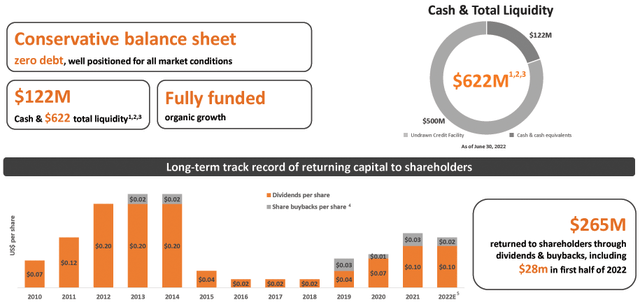
4 – Total Quarterly Production was 103.9K Au ounces and sold 102.164K Au ounces
AGI Quarterly Gold production history (Fun Trading) Alamos Gold said it sold 102,164 ounces of gold in the second quarter at an average realized price of $1,871 per ounce for revenues of $191.2 million.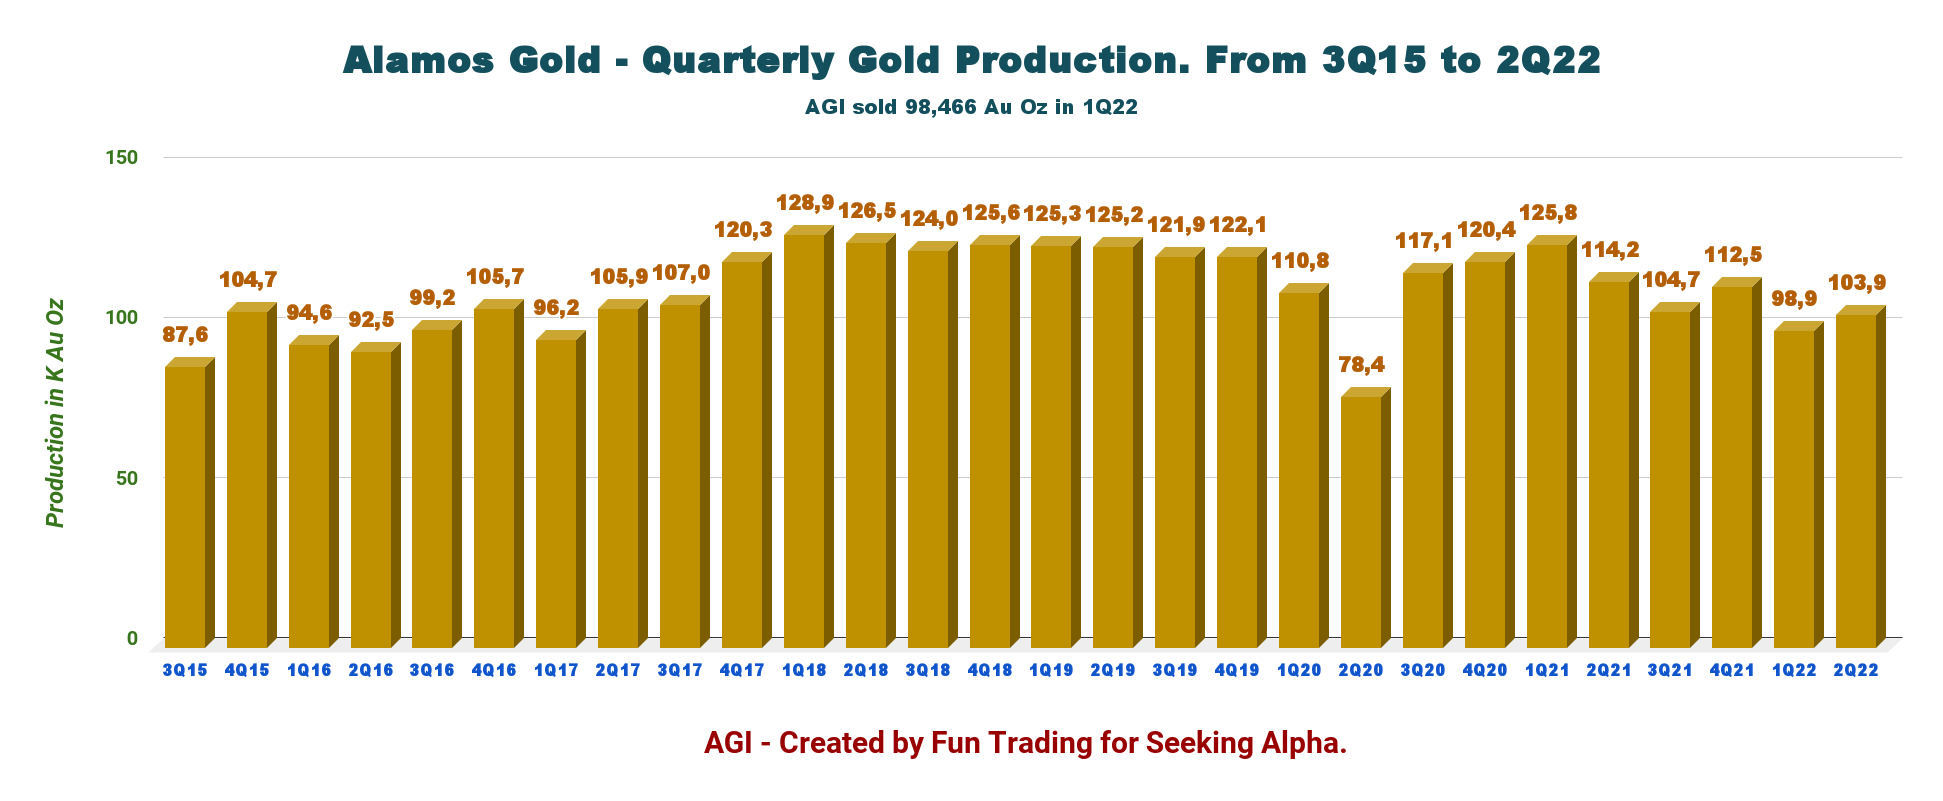
Alamos Gold posted second-quarter production of 103,900 ounces,
Below is the 2Q22 production per mine.
AGI Quarterly Gold production per mine 2Q22 (Fun Trading)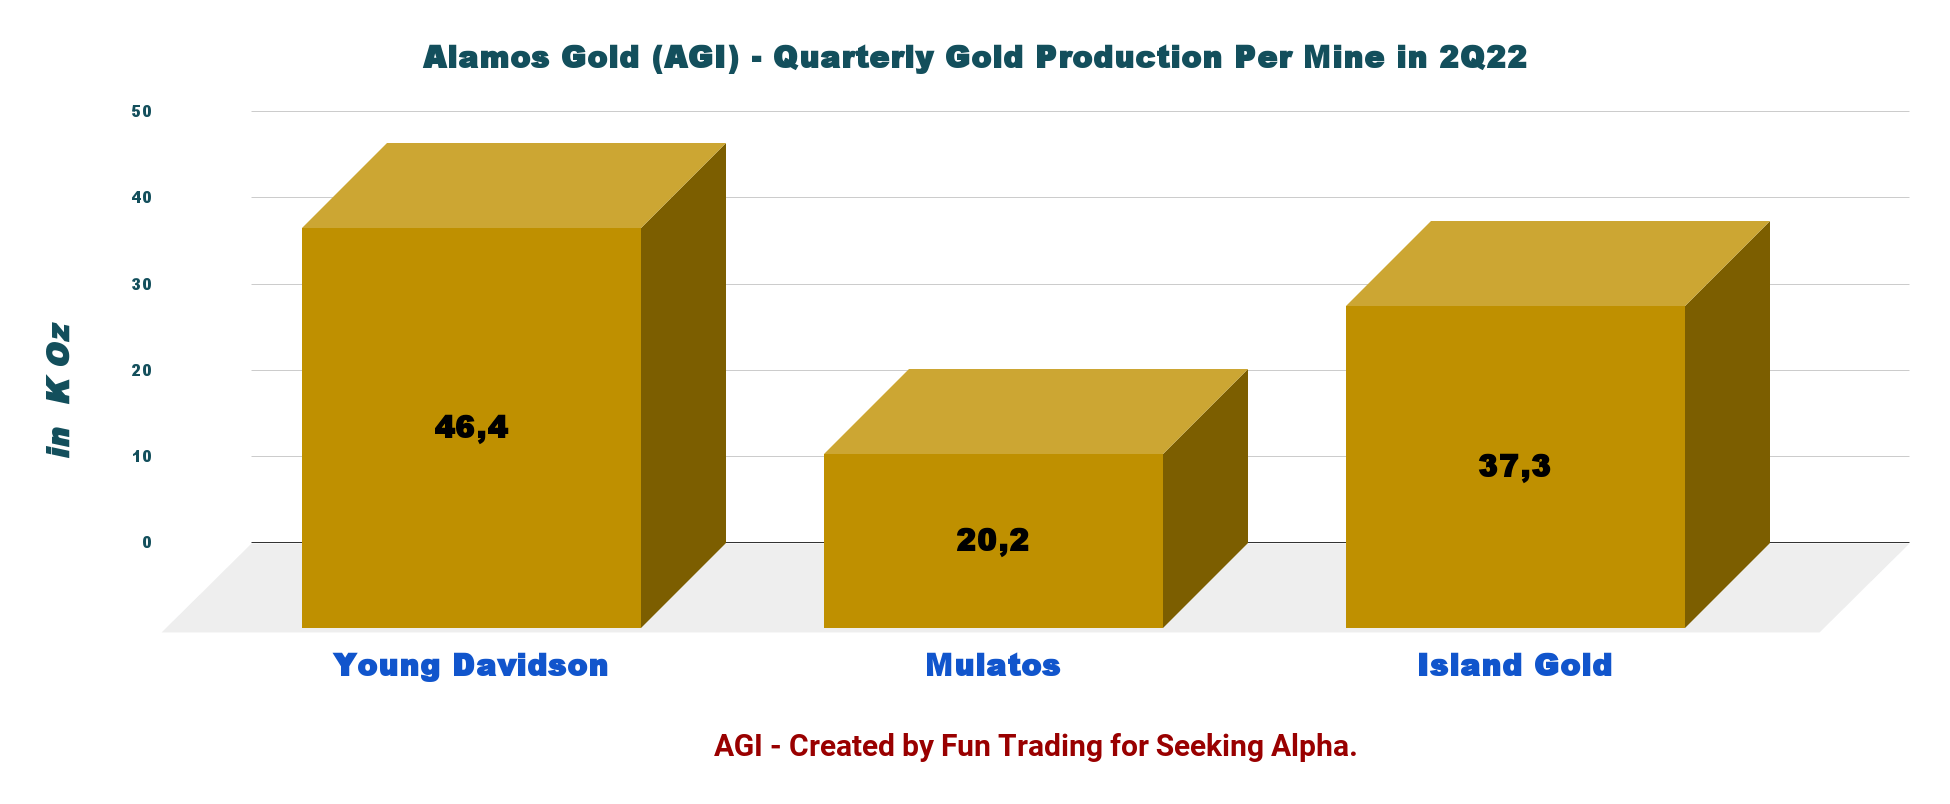
The price of gold realized for the fourth quarter was $1,871 per ounce.
AGI Quarterly Gold Price realized history (Fun Trading)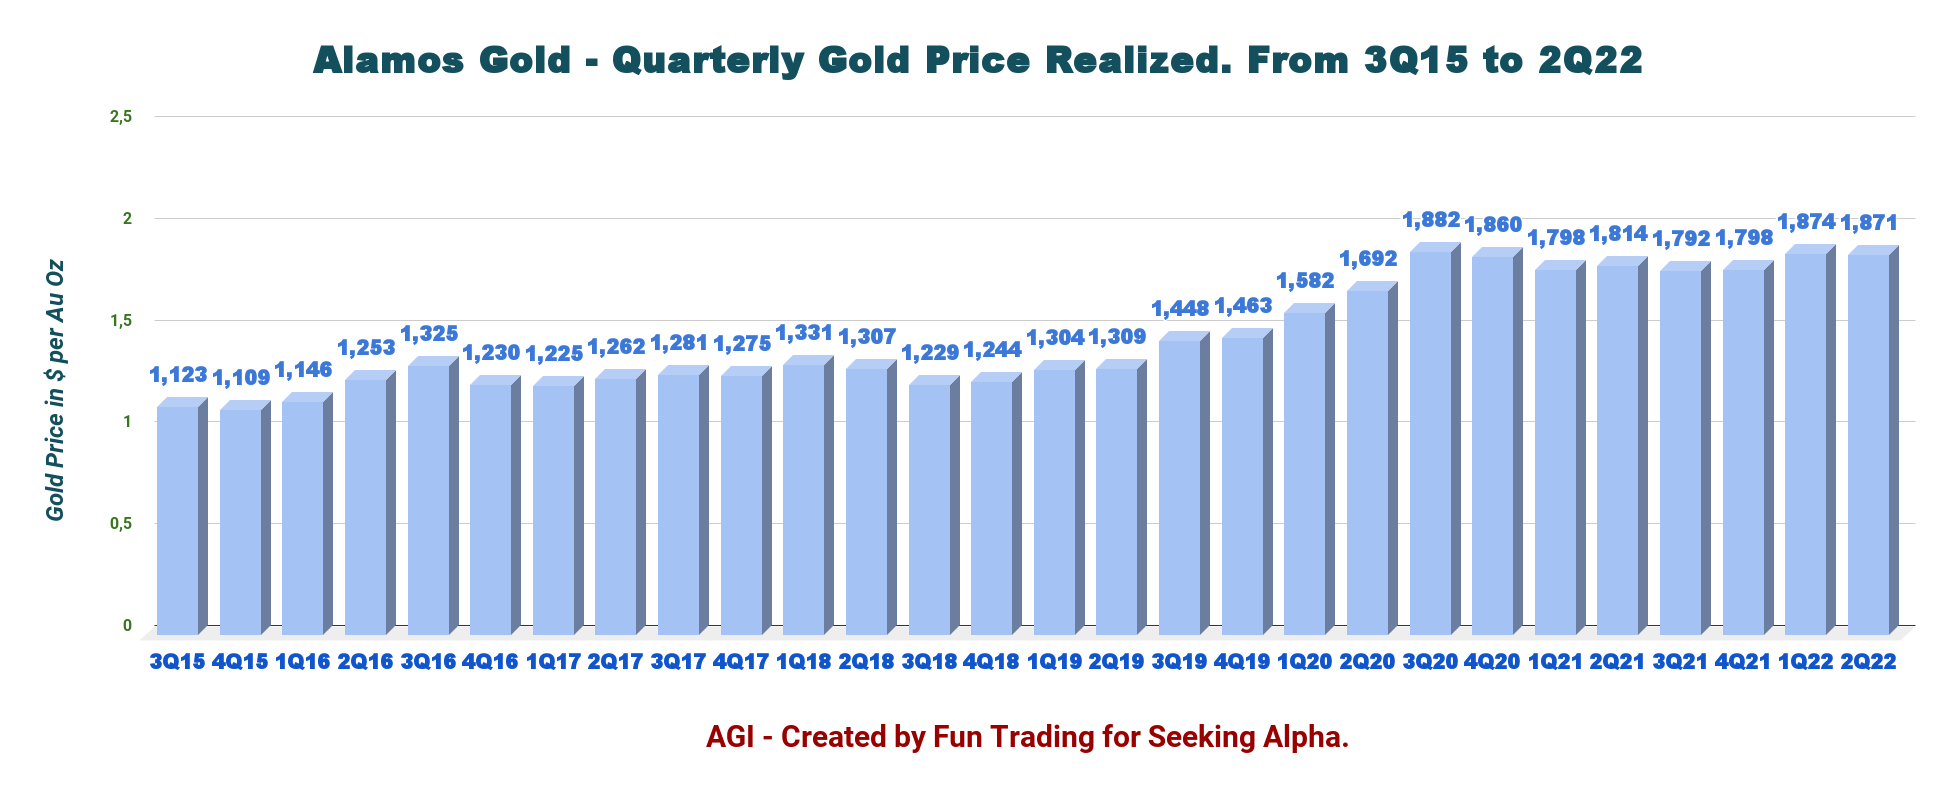
All-in sustaining costs, AISC, were lower this quarter at $1,170 per ounce. Despite inflationary pressure, the company significantly reduces its AISC this quarter.
AGI Quarterly AISC history (Fun Trading)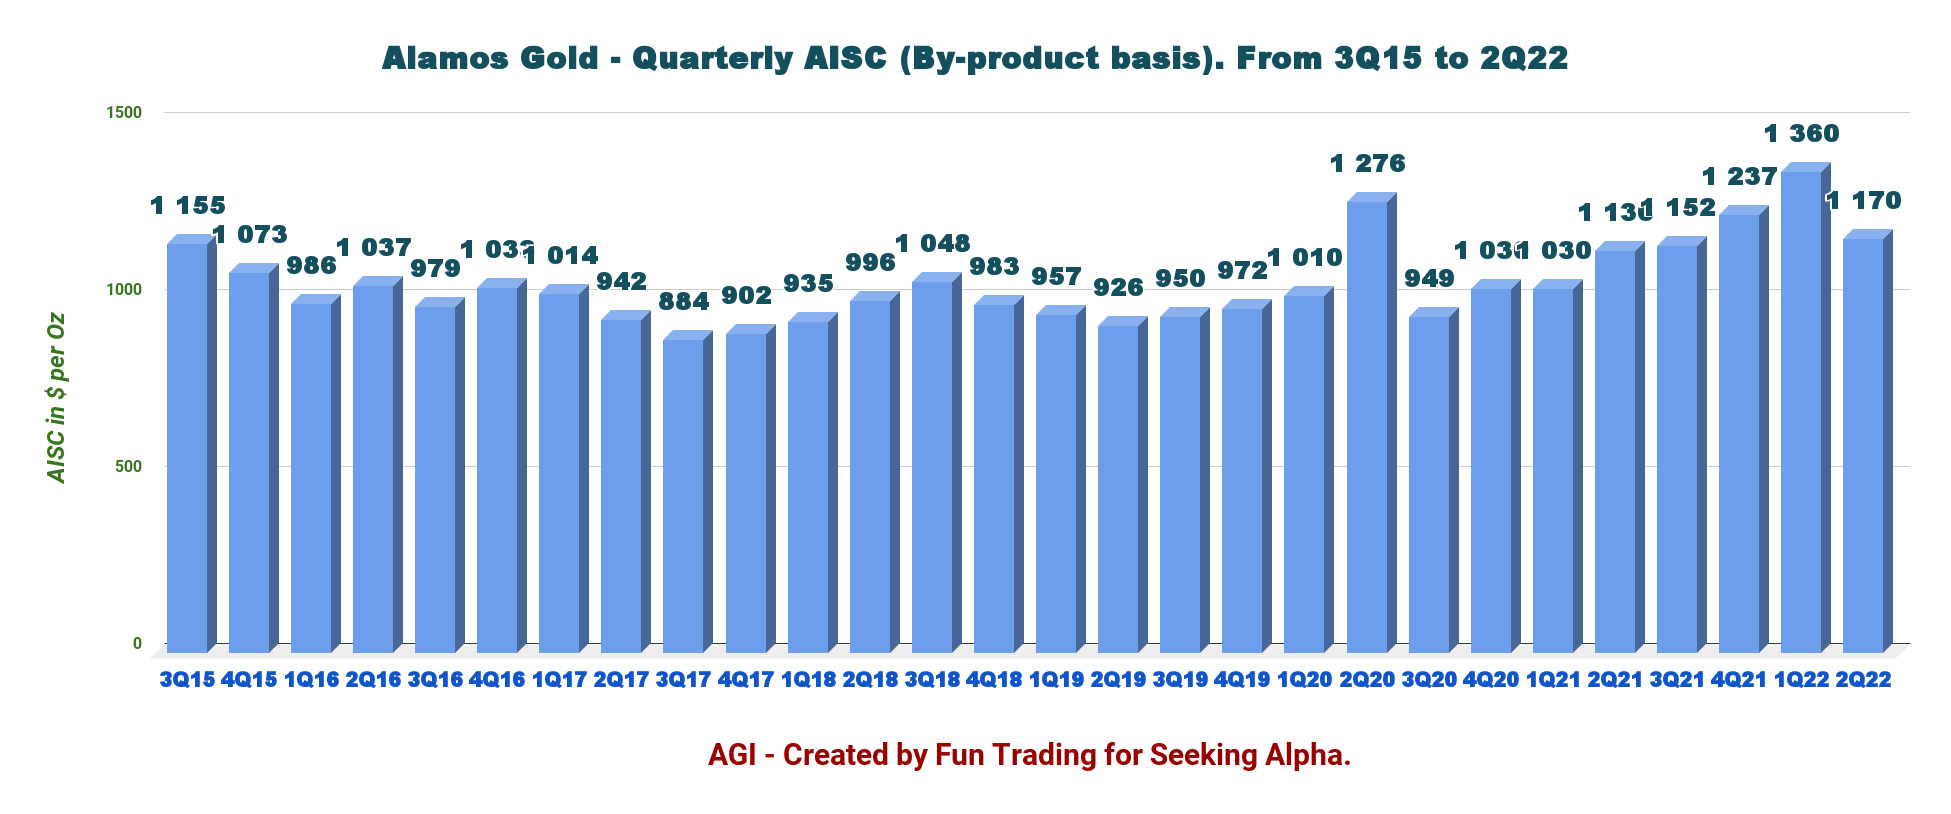
Note: No progress with Kirazlı (Çanakkale, Turkey). Alamos Gold incurred $1.3 million in the second quarter related to ongoing holding costs and legal costs to progress the Treaty claim.
5 – Guidance 2022 and Beyond
As indicated in my previous article, Alamos expects stable production in 2022, with a 4% growth expected in 2023.
Production is expected between 440K oz and 480K oz in 2022 and an increase of 4% (mid-point of guidance) to between 460K and 500K oz in 2023 and 2024.
AGI 2022 Guidance (Alamos Gold) The company’s all-in sustaining costs guidance is expected to be $1,190 to $1,240 per ounce in 2022, improving to $950 to $1,050 per ounce in 2024.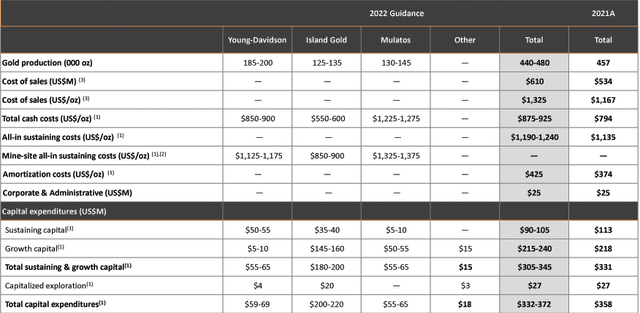
AISC is expected to decrease approximately 18% from 2022 to 2024 (based on the mid-point of guidance), reflecting lower costs at Mulatos and Island Gold.
Technical Analysis (Short Term) And Commentary
AGI TA chart short-term (Fun Trading) Note: The chart has been adjusted for the dividend.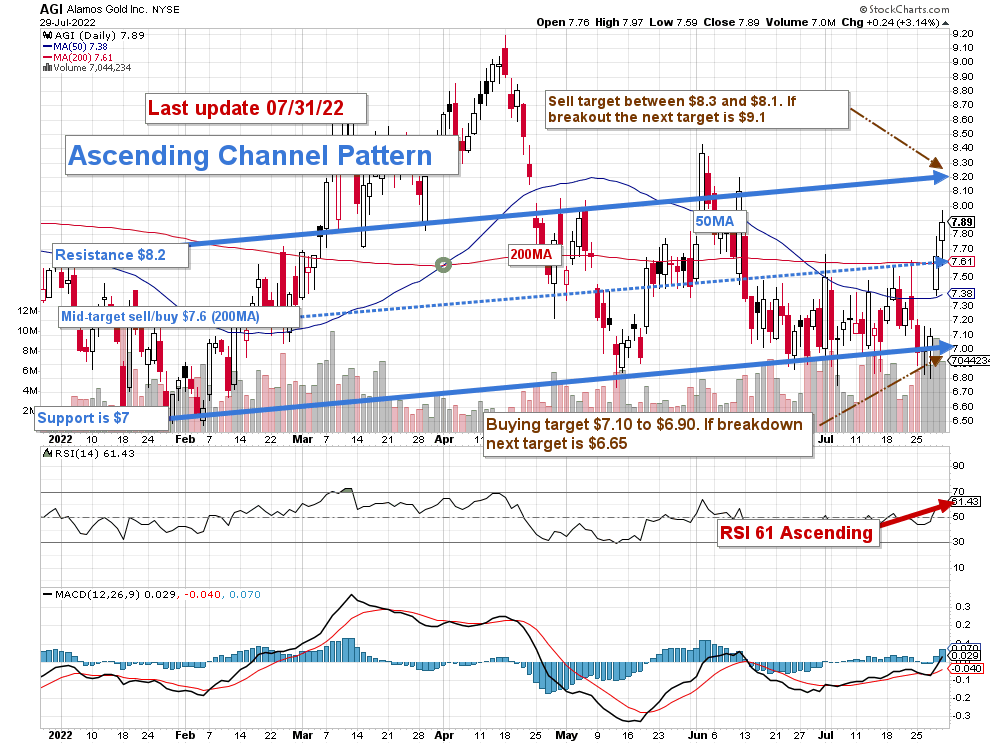
AGI chart shows an ascending channel pattern with resistance at $8.20 and support at $7.
The general strategy I usually promote in my marketplace for AGI is to keep a core long-term position and use about 30%-40% to trade LIFO while waiting for a higher final price target for your core position between $11 and $12.
I suggest selling about 30%-40% of your position between $8.10 and $8.30.
I believe it is safe to accumulate AGI below $7.1. However, depending on the FED’s future decisions, AGI could retest $6.65, which is an excellent price for long-term investors.
I highly recommend keeping a core long-term position and using about 30%-40% to trade LIFO while waiting for a higher final price target for your core position between $11 and $12.
Watch the gold price like a hawk.
Note: The LIFO method is prohibited under International Financial Reporting Standards (IFRS), though it is permitted in the United States by Generally Accepted Accounting Principles (GAAP). Therefore, only US traders can apply this method. Those who cannot trade LIFO can use an alternative by setting two different accounts for the same stock, one for the long term and one for short-term trading.
Warning: The TA chart must be updated frequently to be relevant. It is what I am doing in my stock tracker. The chart above has a possible validity of about a week. Remember, the TA chart is a tool only to help you adopt the right strategy. It is not a way to foresee the future. No one and nothing can.
Author’s note: If you find value in this article and would like to encourage such continued efforts, please click the “Like” button below as a vote of support. Thanks.
Be the first to comment