

FinkAvenue
Investment Thesis
The 3.44%-yielding Fidelity High Dividend ETF (NYSEARCA:FDVV) had an excellent year, outpacing the iShares Russell 1000 ETF (IWB) by 15%. While most high-dividend ETFs were successful, FDVV differentiates itself by selecting several more mega-caps than peers like the Schwab U.S. Dividend Equity ETF (SCHD) and iShares Core High Dividend ETF (HDV). Therefore, you might be more comfortable with its top holdings, namely Apple (AAPL), Microsoft (MSFT), and Exxon Mobil (XOM). However, I recommend patience until FDVV’s Index reconstitutes next month. One of the most significant risks is not knowing more about Fidelity’s proprietary methodology. Electric Utilities are FDVV’s largest exposure area, and as I will demonstrate in this article, they may need to be the first to go to ensure FDVV’s future success.
FDVV Overview
Strategy and Performance History
One downside to FDVV is that its strategy isn’t entirely transparent. The Fidelity High Dividend Index uses a proprietary selection process, but we know it’s based on three factors:
- Trailing Twelve-Month Dividend Yield (70%)
- Trailing Twelve-Month Dividend Payout Ratio (15%)
- Trailing One-Year Dividend Growth (15%)
Fidelity calculates composite scores for each Russell 1000 security relative to their sector peers. However, another downside is that the screens are backward-looking. Furthermore, with such a large weighting assigned to dividend yield, investors should expect a portfolio of beaten-down stocks. On the plus side, the Index only reconstitutes once yearly at the beginning of February, allowing time for the strategy to play out. Other ETFs reconstitute more frequently to ensure a high yield, sometimes not giving selections enough time to realize their potential.
Since its launch in September 2016, FDVV gained an annualized 10.13% compared to 8.42% and 11.19% for the iShares Russell 1000 Value ETF (IWD) and the iShares Russell 1000 ETF. Considering how high-dividend and value strategies overlap, some might call this a success. However, if the intent was to select the best value stocks per sector, FDVV failed. The ALPS Equal Sector Weight ETF (EQL) delivered a 10.57% annualized return, outperforming FDVV in every bull market year. In 2018 and 2022, FDVV led by 4.85% and 6.53%, so FDVV seems best equipped for bear markets. We just had one, and the Russell 1000 Index has yet to experience two consecutive negative years since the early 2000s.
Portfolio Visualizer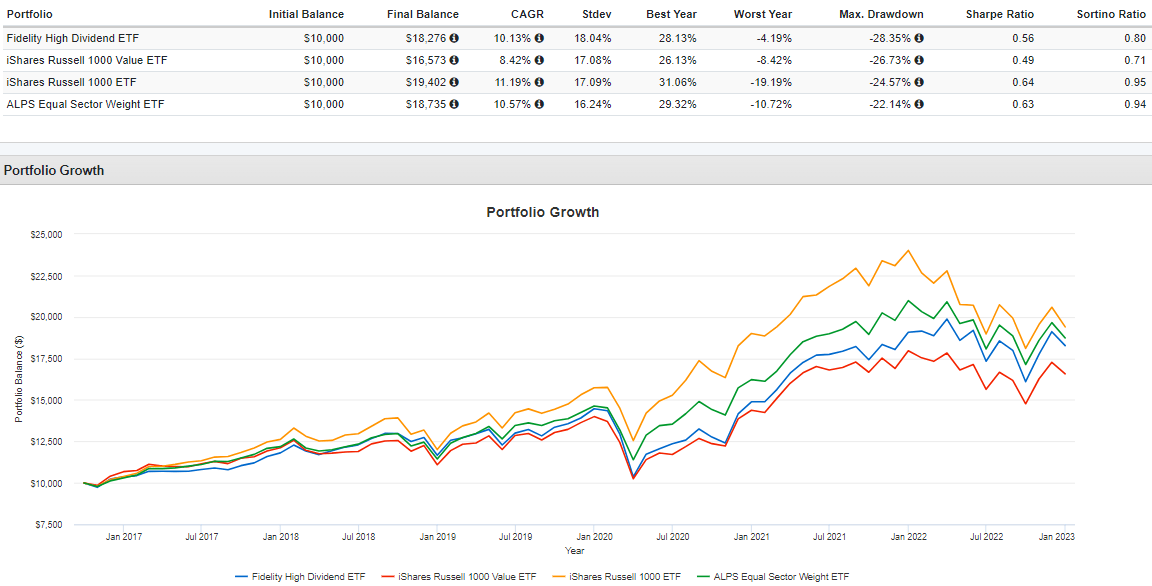
Total returns aside, an obvious appeal is the high dividend yield. FDVV’s is 3.44% on a trailing twelve-month basis, but its “B” Seeking Alpha Dividend Grade is only average. The 4.47% five-year dividend growth rate is low compared to most peers, and dividends were flat over the last three years.
Seeking Alpha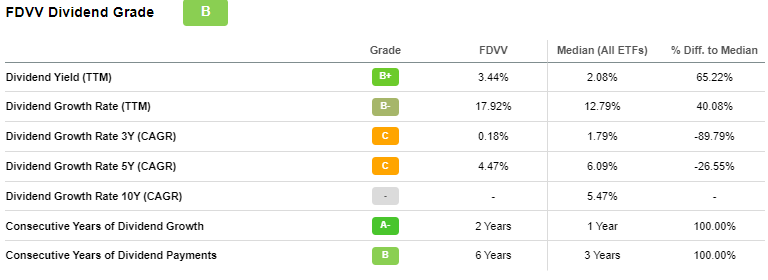
We can see this visually by looking at the portfolio income generated on a $10,000 investment in January 2017. In 2022, income was $593 assuming all dividends were reinvested ($491 without reinvestments). SCHD caught up in 2020 and has outpaced FDVV since. Meanwhile, HDV was less consistent, but its 4.73% five-year dividend growth rate was slightly better than FDVV’s.
Portfolio Visualizer
Sector Exposures and Top Ten Holdings
FDVV’s sector exposures are below, alongside IWD, SCHD, and HDV. It looks well-balanced, with five sectors having double-digit weightings and none above 20%. Still, the negligible exposure to Consumer Staples is surprising. I expected Tobacco stocks like Altria Group (MO) and Philip Morris (PM) would qualify, given how they yield 8.23% and 5.02%, well ahead of the 1.98% sector average.
Morningstar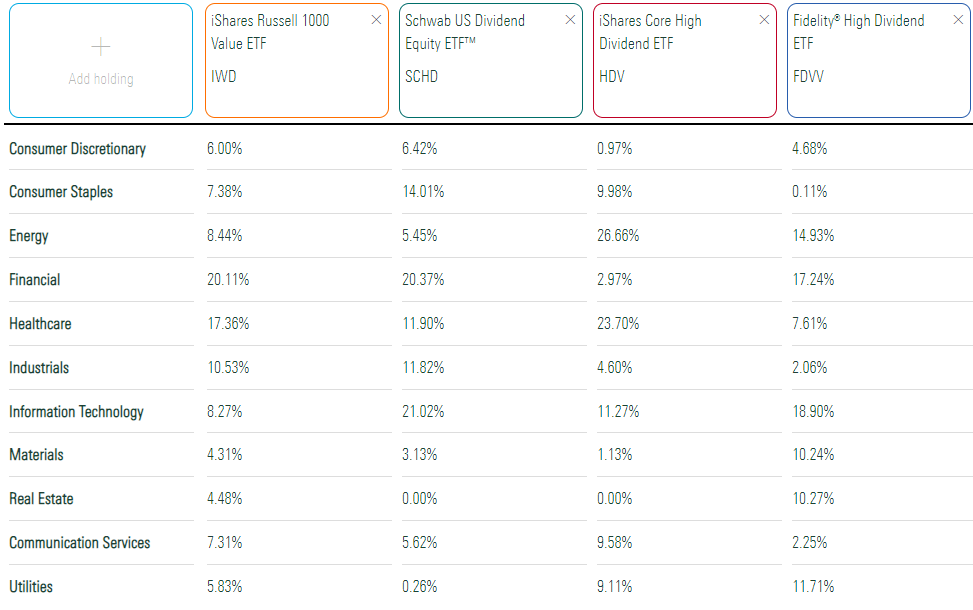
FDVV mainly holds North American stocks, with some Australian and UK holdings. The top ten, shown below, include Apple, Microsoft, Exxon Mobil, and Chevron (CVX). FDVV also has one short position.
Fidelity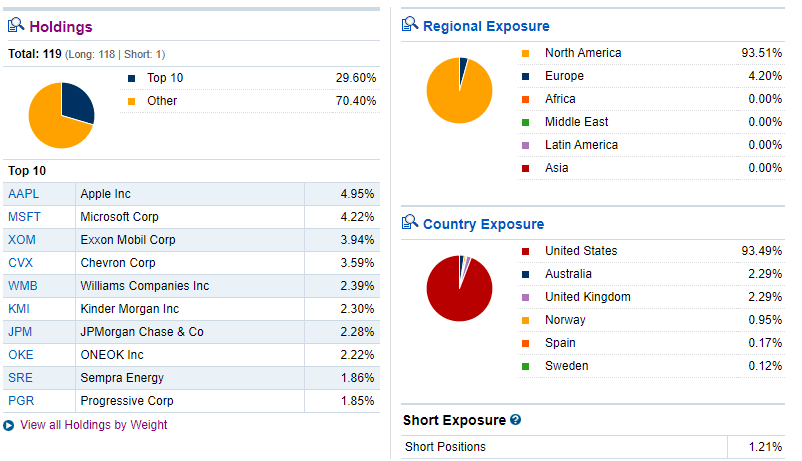
FDVV Analysis
FDVV’s portfolio is 10.43% Electric Utilities, a change from the previous year, when the Index favored Consumer Staples and Diversified Banks. I wrote several times about the Utilities sector in 2022, arguing they wouldn’t underperform because Treasury yields were rising. As it turns out, Utilities performed as usual in a downturn, declining by just 0.52% over the last year (excluding dividends). FDVV’s Electric Utilities stocks averaged a 1.19% gain, ranging between -6.78% and 7.72%, so they were relatively safe. Adding them to your portfolio is one of the most efficient ways to de-risk.
State Street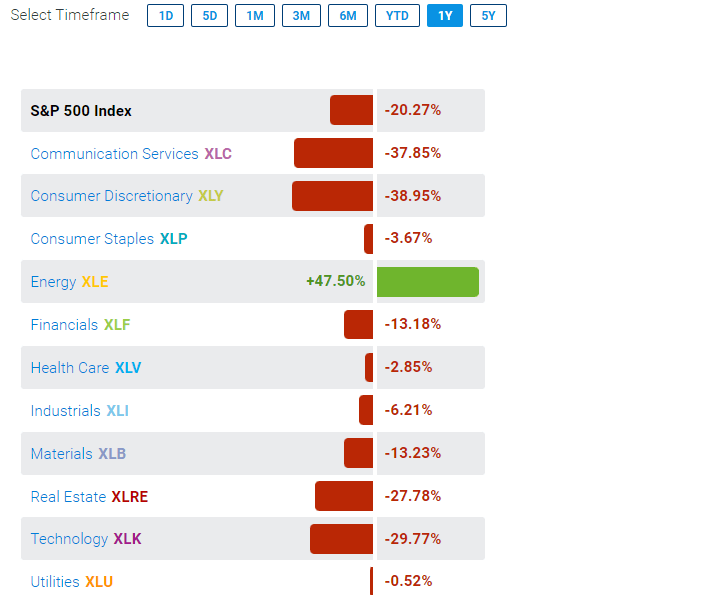
FDVV’s industry fundamentals are listed below alongside SCHD’s and HDV’s. The design is unique and resembles a barbell portfolio. You have less-volatile Electric Utilities, Biotechnology, and Pharmaceutical stocks on one end and riskier Energy and Diversified Banks on the other.
The Sunday Investor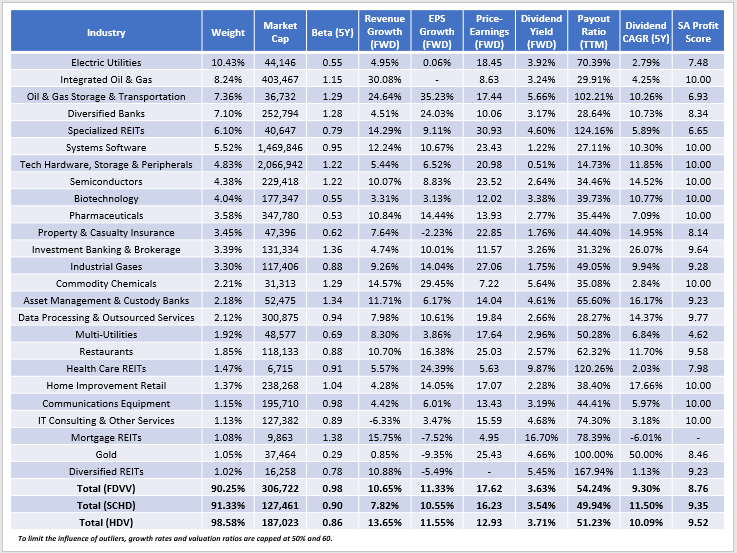
Another unique feature is FDVV’s $306 billion weighted-average market capitalization, caused by high weightings in big-tech stocks like Apple and Microsoft. It’s unusual for a high-dividend ETF, but it does offset the low growth offered by its defensive holdings. Again, this suggests a barbell approach. It’s difficult to imagine this wasn’t Fidelity’s intent.
The estimated gross dividend yield is 3.63%, and after accounting for FDVV’s 0.29% expense ratio, the net is 3.34%. That’s less than what you’ll net with SCHD and HDV, and since dividend growth appears worse, it isn’t a very attractive dividend ETF.
FDVV has an estimated 10.65% and 11.33% sales and earnings growth rate, between what SCHD and HDV offer. However, it trades at 17.62x forward earnings, the highest of the three, and the worst Seeking Alpha Profitability Score (8.76/10). The primary contributors are Utilities stocks, and the valuation/growth combination could be better for that sector. GARP investors can divide the estimated growth rate (4.38%) into the forward price-earnings ratio (21.12) and return a 4.82 PEG (price-earnings-growth) ratio. That’s the highest of any sector.
The Sunday Investor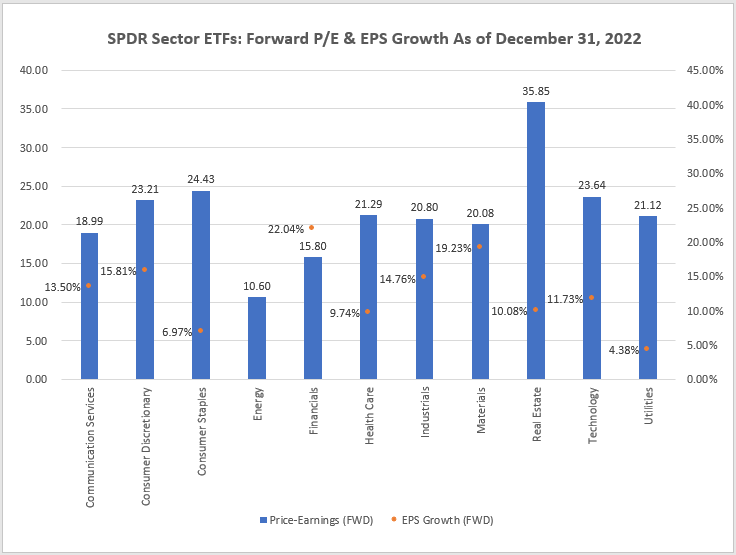
Finally, the Utilities Select Sector SPDR ETF (XLU) has yet to outperform the SPDR S&P 500 ETF (SPY) in consecutive years since its four-year win streak between 2005-2008. In 2011, XLU beat by 17.73% and then lost by 14.95% in 2012. XLU outperformed by 15.27% in 2014, then lagged by 6.16% in 2015. The same pattern occurred in 2016-2017 and 2018-2019, so it will be prudent to take some profits at some point.
Investment Recommendation
FDVV had a terrific year because it overweighted Utilities and Energy stocks, the two best-performing sectors in 2022. The barbell approach seems intentional when analyzing the ETF’s factors at the industry level and is how FDVV differentiates itself from high-dividend peers like SCHD and HDV. Furthermore, it has a reasonable, but not unusual, 17.62x forward earnings valuation and a decent 3.34% estimated dividend yield.
The most considerable risk today is next month’s reconstitution. FDVV’s latest annual turnover rate is 38%, meaning the Index has a history of some significant changes. Last year worked out as the Index moved into Utilities and lowered exposure to Consumer Staples and Diversified Banks. This year, it’s difficult to say because the methodology is proprietary. Therefore, I suggest waiting one month. I will provide a reconstitution recap then, but in the meantime, I’d be happy to answer any questions in the comments section.
Be the first to comment