

KeithBinns/E+ via Getty Images
(This article was co-produced with Hoya Capital Real Estate)
Introduction
With the turmoil in Europe and as a follow-up to my VGK: An ETF To Own If You Only Want Europe’s Developed Country Exposure article, which presented investors which a unhedged/hedged view of the Developed European market. This article focuses on the First Trust Dynamic Europe Equity Income Fund (NYSE:FDEU) and whether a Closed-End-Fund, which its yield-enhancing strategy, delivers compared to a basic index-based ETF like the Vanguard FTSE Europe ETF (NYSEARCA:VGK). The comparison, for non-hedging investors, is forego the extra yield FEDU provides and invest with VGK instead.
Understanding the First Trust Dynamic Europe Equity Income Fund
Seeking Alpha describes this Closed-End-Fund as:
First Trust Dynamic Europe Equity Income Fund is a close ended equity mutual fund launched and managed by First Trust Advisors L.P. The fund is co-managed by Henderson Global Investors (North America) Inc. and Henderson Investment Management Limited. It invests in the public equity markets of Europe. The fund seeks to invest in stocks of companies operating across diversified sectors. It primarily invests in equity securities of European companies of any market capitalization. First Trust Dynamic Europe Equity Income Fund was formed on September 25, 2015 and is domiciled in the United States.
Source: seekingalpha.com FDEU
FDEU has $215m in assets and currently yields 5.76%, about The managers charge 193bps in fees; slightly high even for a CEF using leverage.
ftportfolios.com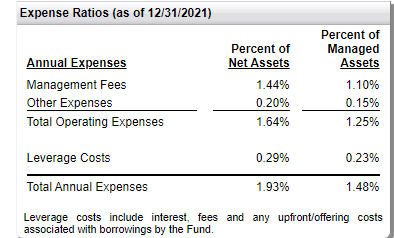
This statement was included in the last Annual Report:
Assuming that the Fund’s leverage costs remain at 92bps, the annual return that the Fund’s portfolio must experience (net of expenses) in order to cover its leverage costs would be 0.21%.
Source: FDEU 2021 Annual Report
Since FDEU is a CEF and does not invest based on an underlying index, they have the ability to add strategies that the VGK ETF can or does not include. Some critical ones include:
- The Fund utilizes financial leverage by borrowing in both U.S. Dollars and Euros. During the period, the Fund maintained its borrowing level to take advantage of attractive investment opportunities available. During 2021, financial leverage had a positive impact on the Fund’s performance. At the end of 2021, leverage stood at 23%.
- The Fund utilized a British Pound currency hedge to offset some of the exposure to the Pound Sterling, and with the currency depreciating over the period the hedge was in place, this was a positive contributor to performance.
- To generate additional income, the Fund may write (or sell) call options on portfolio equity securities and certain broad-based securities indices in an amount up to 40% of the value of its Managed Assets. During the 12-month period ended December 31, 2021, the options portfolio management team overwrote approximately 30% of the Fund’s Managed Assets. The option strategy was executed on the broad-based Euro Stoxx 50 Index, selling one to three-month call options, approximately at-the-money to slightly out-of-the-money. The option strategy subtracted from the total return of the Fund during the period as the overwritten index, the Euro Stoxx 50, traded higher in price during the same period.
While not a strategy for FDEU, buying it at the best discount is.
cefconnect.com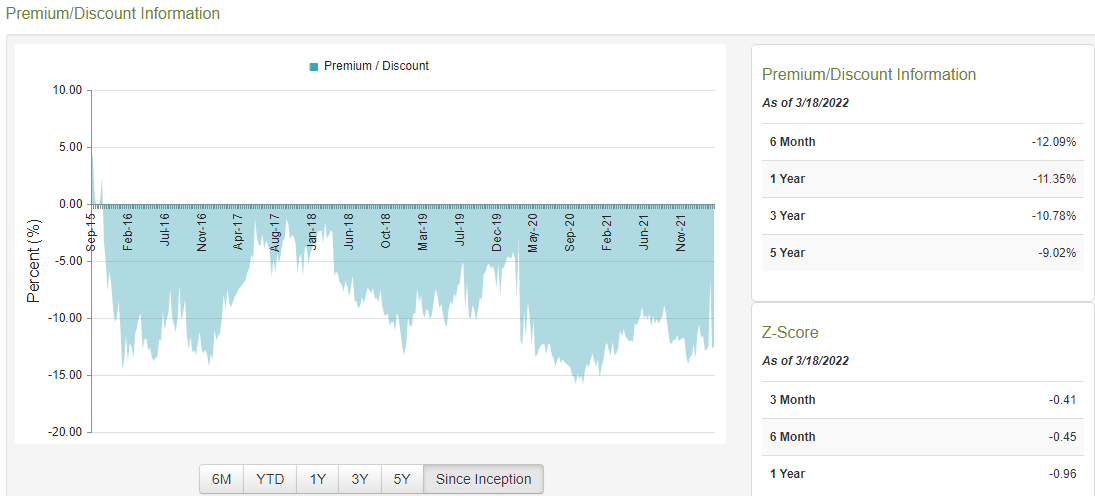
At 12.6% discount, FDEU is slightly deeper than the 6 and 12-month average. With the deepest discount ever less than 3% more, this would indicate a good entry point, assuming FDEU is worth owning.
FDEU Holdings review
ftportfolios.com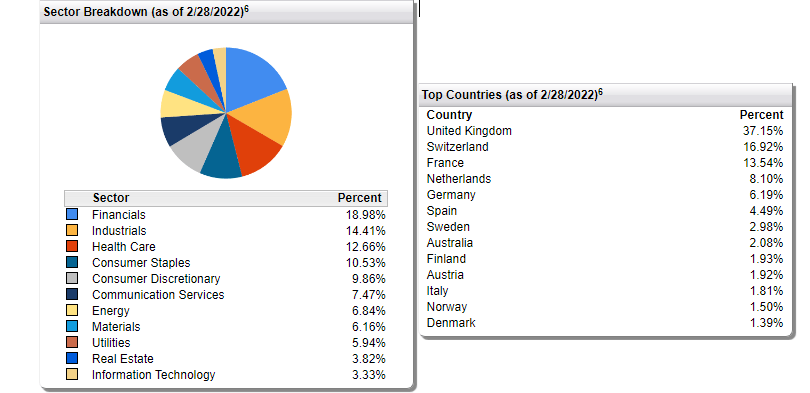
The overwhelming exposure to UK stocks explains the hedging of the British Pound to protect the performance from movement of the GBP against the USD. While Switzerland is listed second, their currency, the Swiss Franc (17%), places third behind the 38% exposure to the Euro. There is also minor exposure to several other currencies.
Top holdings
ftportfolios.com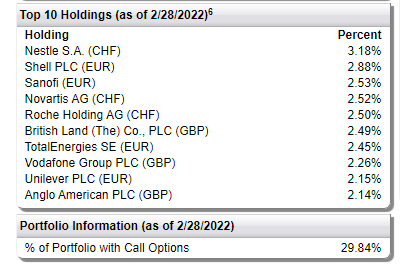
The Top 10 represent 25% of the portfolio, with the currency exposure of each stock listed. While FDEU is permitted to cover up to 40% of the asset with Call options, at the end of February they were slightly under 30% covered. While I could not find recent option exposure, the 12/31/21 contracts were available, and represented 1% of the total assets.
FDEU 2021 Annual Report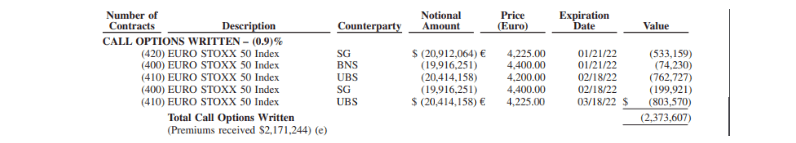
All of those contract probably became profitable when they expired as the Stoxx 50 Index is down 10% YTD. Notice they reduce their counterparty risk by using three different firms: BNS-Bank of Nova Scotia; SG-Societe Generale; UBS-Union Bank Switzerland). As of this date, their option positions were underwater by $200k.
FDEU Distribution review
seekingalpha.com FDEU DVDs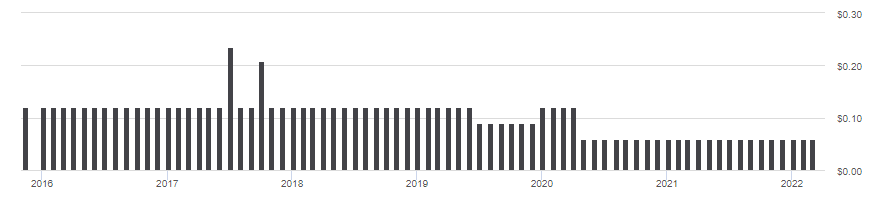
FDEU uses a Managed Distribution policy like many CEFs, and the Annual Report provides this description:
The Board of Trustees of the Fund has approved a managed distribution policy for the Fund (the “Plan”) in reliance on exemptive relief received from the Securities and Exchange Commission that permits the Fund to make periodic distributions of long-term capital gains as frequently as monthly each tax year. Under the Plan, the Fund currently intends to continue to pay a recurring monthly distribution in the amount of $0.06 per Common Share that reflects the distributable cash flow of the Fund. A portion of this monthly distribution may include realized capital gains. This may result in a reduction of the long-term capital gain distribution necessary at year end by distributing realized capital gains throughout the year.
Source: ftportfolios.com FDEU Annual Report
As per most funds that execute an options writing strategy, net gains from those trades become Return-of-Capital when distributed to investors.
Fidelity.com FDEU DVDs
Understanding the Vanguard FTSE Europe ETF
Seeking Alpha describes this ETF as:
Vanguard FTSE Europe ETF is an exchange traded fund launched and managed by The Vanguard Group, Inc. It invests in public equity markets of European Developed region. It invests in stocks of companies operating across diversified sectors. It invests in growth and value stocks of companies across diversified market capitalization. It seeks to track the performance of the FTSE Developed Europe All Cap Index. VGK started in 1990.
Source: seekingalpha.com VGK
VGK has $21b in assets and provides investors with a 3.5% yield. Vanguard charges 8bps in fees, very reasonable for an ETF holding international stocks.
Examining the Index used
FTSE describes their Index as:
The FTSE Developed Europe All Cap Index is a market-capitalization weighted index representing the performance of large, mid and small cap companies in Developed European markets, including the UK. The index is derived from the FTSE Global Equity Index Series (GEIS), which covers over 7,400 securities in 47 different countries and captures 98% of the world’s investable market capitalization.
Source: research.ftserussell.com Index
Basic information on the Index includes:
research.ftserussell.com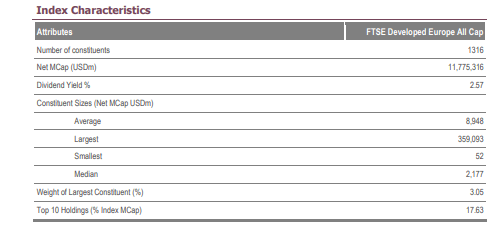
I did not find a specific Methodology PDF for this index, but they have one that explains the FTSE index series it is a part of: Index Methodology PDF.
VGK Holdings review
investor.vanguard.com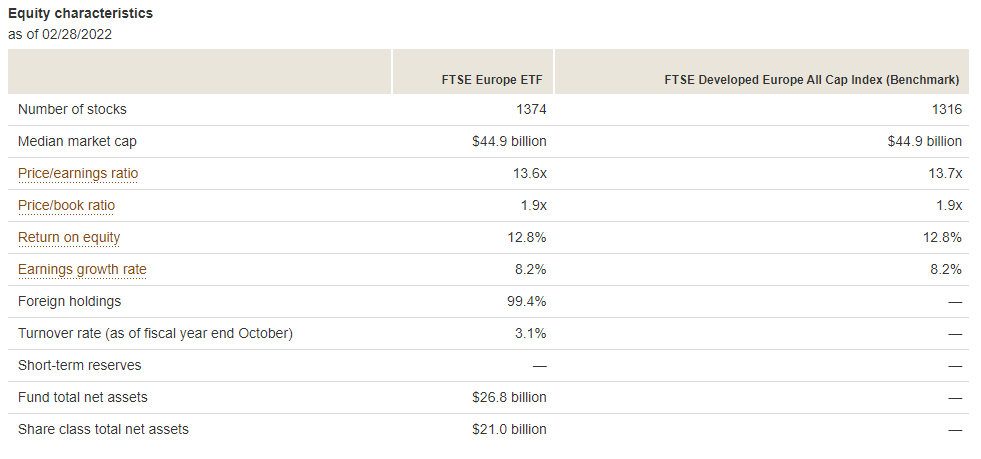
Morningstar has more statistical data:
morningstar.com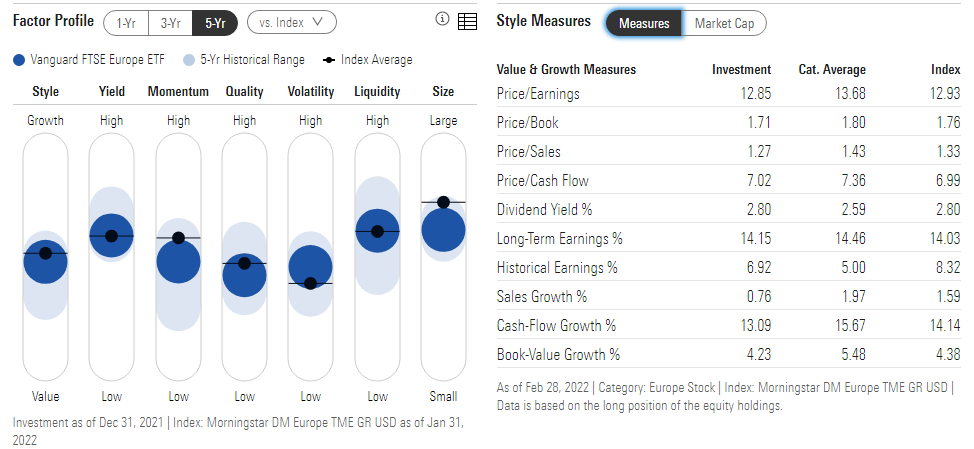
The VGK ETF, on the various factor scales, basically is in the middle, which isn’t surprising for a broad-based-index ETF. While earnings growth is respectable, Sales growth is anemic. The market-cap allocations runs smaller than the Index with VGK average MC at $39b versus the Index’s $54b. VGK underweights the largest stocks and overweights Mid- and Small-Cap stocks.
morningstar.com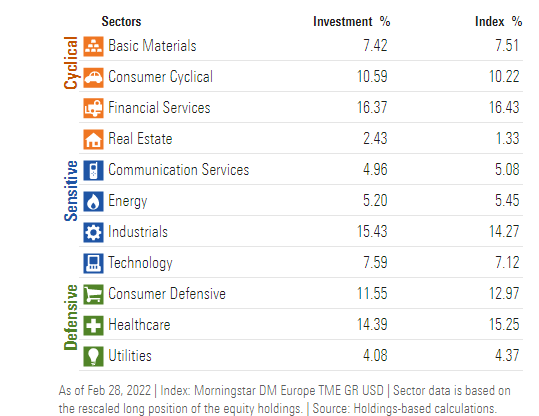
VGK varies by 1% from the Index in several sectors but not be enough to really effect its performance via the Index. Financials, Industrials, and Healthcare are the Top 3 sectors, accounting for 46% of the portfolio. Pharmaceuticals, Banks and Insurance companies are the top industry exposures, all with 5-10% exposures.
Data from multiple sources; compiled by Author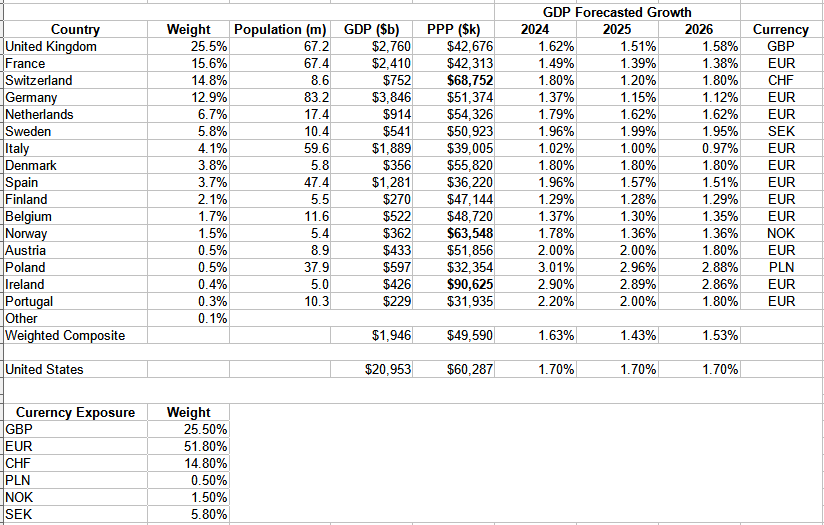
Using data from www.theglobaleconomy.com, I added basic country data, plus IMF GDP growth forecast for 2024-26. I included the United States for comparison purposes. While the average Purchasing Power Parity, labeled “PPP”, is below the USA for the ETF, three countries are higher.
Since I did not see that VGK does any currency hedging, I listed the currency exposure levels the ETF has. How the USD moves against these currencies, especially the Euro and the British Pound, will affect the ETF’s return to US investors and differently for overseas investors.
Top 10 holdings
vanguard.com VGK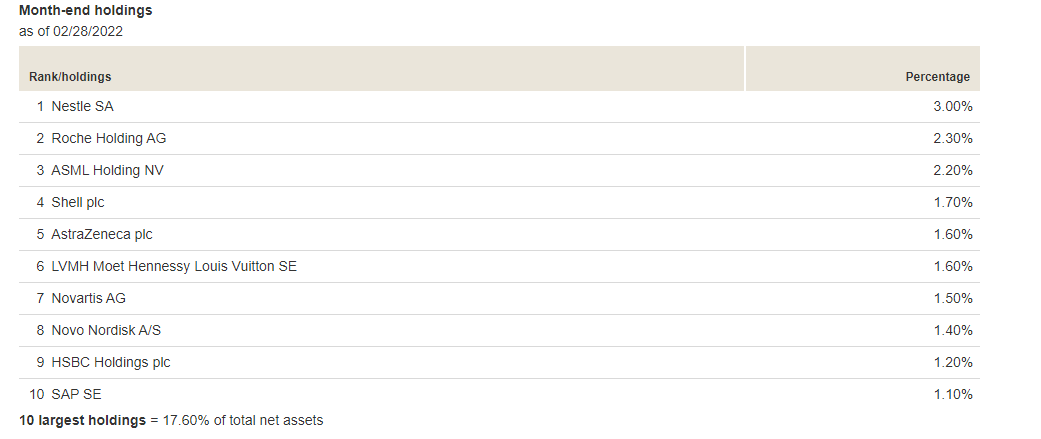
Well known, Large-Cap stocks dominate the list as expected, so much so that the Top 10 are almost 18% of the assets, despite VGK holding over 1360 stocks. The full holdings list indeed shows no currency-hedging assets.
VGK Distribution review
seekingalpha.com VGK DVDs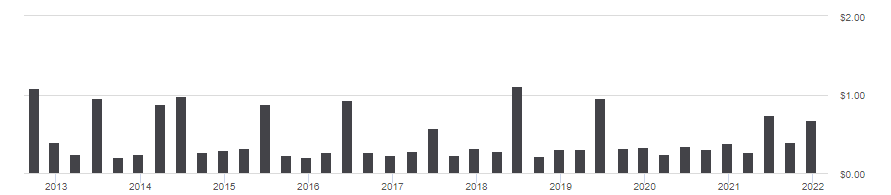
Over the past decade, a pattern of an extra-large payout at year-end has developed. Unfortunately, the yearly amounts paid are not growing. Seeking Alpha provides a dividend scorecard for ETFs and gives VGK a “B”, apparently on the strength of their yield and consecutive payment record.
seekingalpha.com DVD scorecard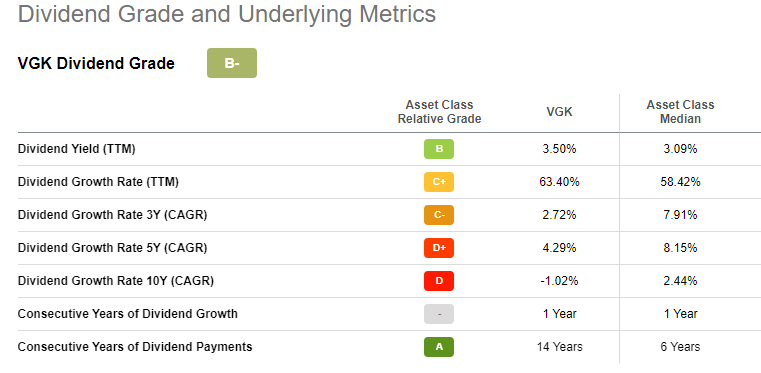
Side by Side look at the Funds
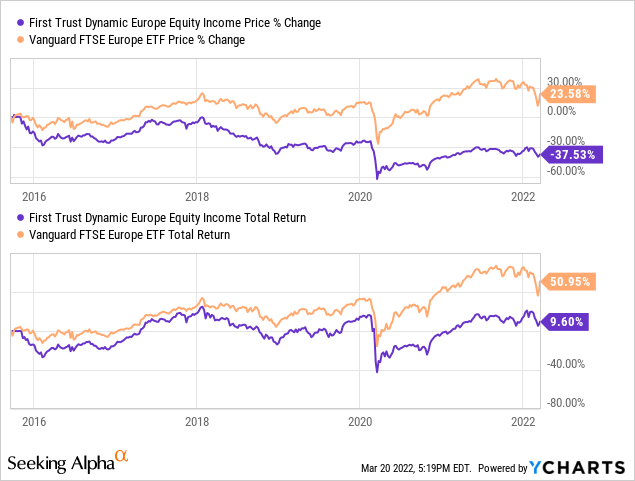
Since FDEU started in late 2015, VGK has provided better returns, both on price and total return. Even when using dividendchannel.com to include non-reinvestment of payouts to the price return, VGK is better by over 6% annually. While part of FDEU’s poor results comes from capping the upside by writing Call options close to the current index price, the following portfolio allocations, if consistent, also could play a part.
Compile by Author from multiple sources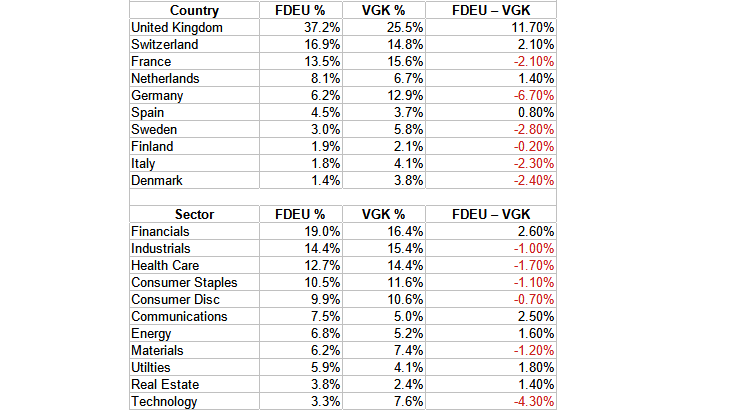
There currently are major allocation differences by countries and smaller differences at the sector level. Believers that the UK will come out of BREXIT stronger and Germany’s energy dependence on Russia and their high costs are negatives, might look favorably on FDEU even though its record to-date is poor.
Portfolio Strategy
Upon comparing these two funds, it is another reminder to income investors to look beyond yield to what the fund’s total return is. This is can be even more important if the investor’s investment strategy is to take the payouts to cover their living costs.
Why Europe now?
While investors should always consider worldwide equity exposure, is Europe a good place to be increasing to one’s exposure? Here are some reasons why this should be a good time:
- I believe Baron Rothschild, the famous financer, would be an investor at this time due to the pessimistic view of many because of the situation in Ukraine and its unknown outcome. While SPY up over the past month, FDEU is down 5.5% and VGK down 3.6%.
- Except for a small allocation to Poland in VGK, neither of the funds covered here are exposed to any Eastern European stocks, which should lower the investment risk.
- With the Fed, but not ECB raising interest rates, the USD should strengthen against the major European currencies. This should help European exporters by making their goods more competitive against USD exports.
- According to Goldman Sachs, historically European equities have delivered positive returns when the Fed hikes rates. The MSCI Europe’s high concentration of cyclical sectors, lead us to believe these indices may do well in this environment.
- When comparing equity ratios between Europe-focused and US-focused ETFs, the values are clearly in Europe’s favor. With the Fed trying to fight inflation by slowing the US economy, that could make US values seem even more extreme. Currently, corporate earnings expectations are rising faster in Europe than in the US.
- Investors around the world become increasingly aware of the importance of incorporating ESG issues into investment decisions, European companies generally lead in the ESG rankings and the region is well positioned to benefit from fund flows as this trend continues upward.
- Europe-focused funds don’t depend on a few Mega-stocks for their performance. The largest allocation in either fund is 3%, whereas the SPDR S&P 500 Trust ETF (SPY) has 3 holdings greater than 3%. SPY’s Top 10 accounts for 29%; both of these funds are less.
Be the first to comment