

Overview
winhorse
Exxon Mobil Corporation (NYSE:XOM) and PetroChina Company Limited (OTCPK:PCCYF) are two of the largest oil and gas companies in the world with operations extending across the globe.
XOM is ranked 2nd in the world in MV (Market Value) behind only Saudi Aramco (ARMCO). PetroChina is ranked 7th and combined they represent more than $575 billion in market value.
Their revenues are also huge with Exxon’s annual revenue at $387 billion and PetroChina’s at $448 billion.
Both companies explore for oil, produce oil, refine oil, produce chemicals such as ethylene and polyethylene and have thousands of retail outlets.
Looking at the global stretch of these two behemoths shows that Exxon is spread pretty evenly around the world while PCCYF’s operations tend to be concentrated in Asia and Africa.
Africa is another dividing line between the two with Exxon leaving Africa while PetroChina is expanding in Africa.
Another interesting comparison is the daily share volume which shows a huge gap between the two with XOM averaging 20 million shares traded a day while PCCYF only averages about 70,000 shares on the OTC Pink Sheets. However, PetroChina does trade over 100 million shares a day on the Hong Kong stock exchange.
In this article, I will discuss that while these two companies have many similarities, they have stark differences in risks and thus the apples-to-oranges comparison.
Financial metrics
When we look at the financial metrics comparing the two companies on a TTM (Trailing Twelve Month) basis, several metrics should be noted. The first one is the Price/Sales ratio (Line 3) which shows PCCYF with a ratio 1/4th of XOM’s ratio. This could imply that PCCYF is a much better value than Exxon.
The Gross Margin % (Line 5) for both companies is about the same. But based on GM to Market Value Percentage (Line 8), PCCYF’s margin is also much higher than XOM’s 112% to 27%. Again, this may indicate that Exxon is a better value based on market value.
The same thing occurs with the P/E Ratio (Line 11), PCCYF looks much better with a P/E Ratio of 4.0 compared to XOM’s much higher ratio of 7.9.
Another interesting data point is net debt (Line 12) where PCCYF is actually negative, which means they have more cash on hand than debt.
However, on EBITDA (line 13) and FCF (Line 15), XOM is much higher than PCCYF.
The price-to-free cash flow ratio (Line 16) shows PCCYF is lower at 5x versus XOM’s much higher at 7.8x.
Seeking Alpha and author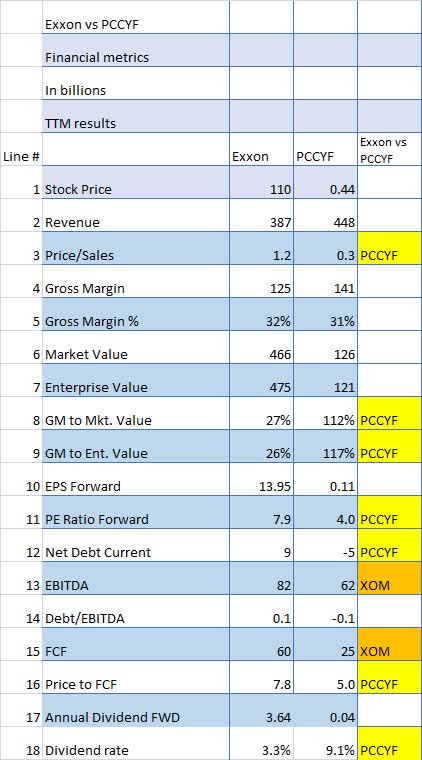
And finally, the dividend rate (line 18) is higher for PCCYF at 9.1% compared to XOM’s 3.3%.
When looking at the Financial Metrics in total, PetroChina looks to be vastly undervalued but there may well be good reasons for that due to PCCYF being a Chinese company.
Wall Street analyst ratings show both Exxon and PCCYF are well-liked
Wall Street analysts appear to have relatively strong feelings for Exxon, with Wall Street plus Seeking Alpha analysts combined showing 21 Buys and only 1 Sell. PCCYF is about the same, with 16 Buy recommendations and only 2 Sells.
Note that PCCYF does not have any ratings available on SA, so I used ratings from the Wall Street Journal instead.
Seeking Alpha and Wall St Journal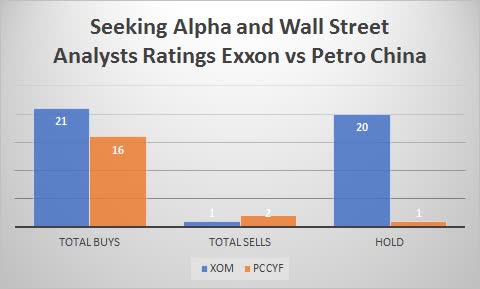
Seeking Alpha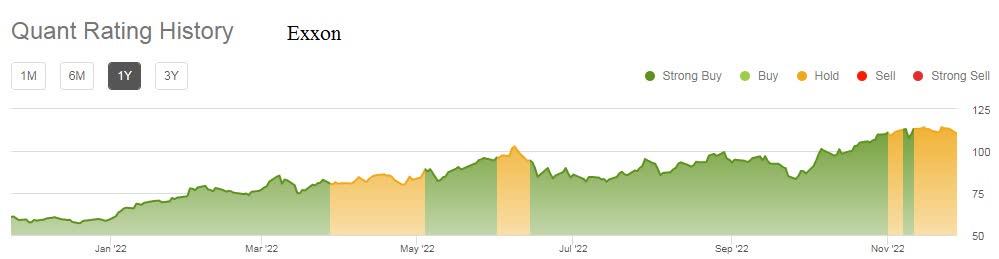
There were no Quant ratings available for PCCYF.
Dividends, stock buybacks, and net debt
Exxon has raised its dividend for 20 years in a row, a commendable record. Looking at the 5-year dividend chart below, we can see that Exxon has raised its dividend from $.75 to $.91 per quarter, an increase of 21%.
Seeking Alpha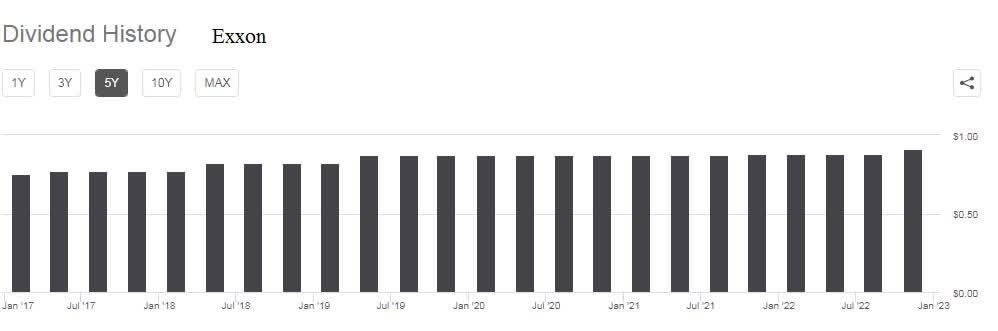
On the other hand, PCCYF has done even better, raising its dividend by 400% over the same 5-year period although payments were sometimes in a fraction of cents.
Seeking Alpha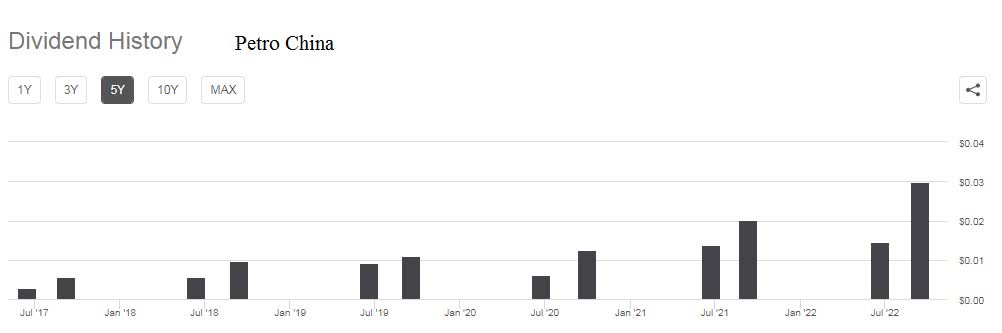
An important factor for investors to consider in PCCYF’s dividend is that it is subject to adjustment to account for the difference between the value of the Chinese Yuan and the US dollar. In recent years, that adjustment has generally been negative to US owners of PCCYF stock as can be seen by the ups and downs in the dividend over time.
xe.com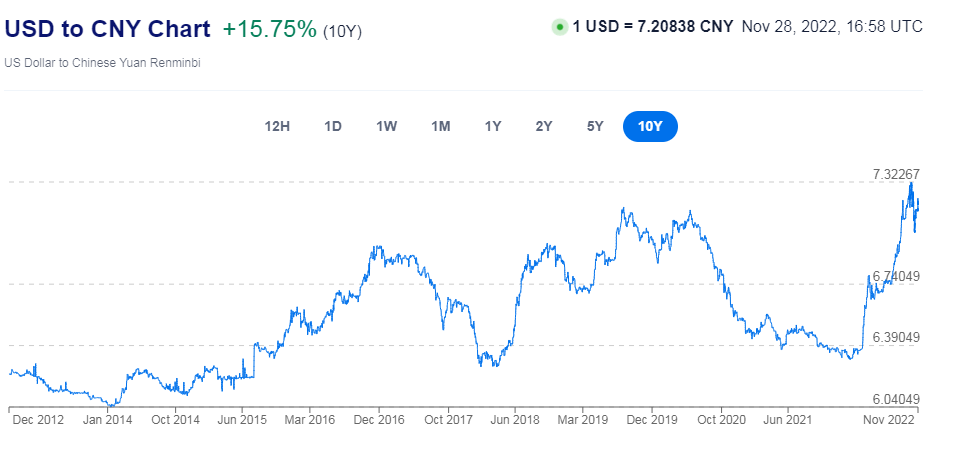
Even though the unpredictable nature of the exchange rate makes PCCYF’s dividend variable on a quarter-to-quarter basis, it has increased at a faster rate than Exxon’s dividend over the last 5 years. And, of course, in future years, the exchange rate may turn in China’s favor, which case PCCYF’s dividend would rise faster.
Another key factor to look at for dividend-paying stocks is the Net Debt to EBITDA ratio. The lower this ratio, the more likely the company will have the ability to keep paying the dividend.
Seeking Alpha and author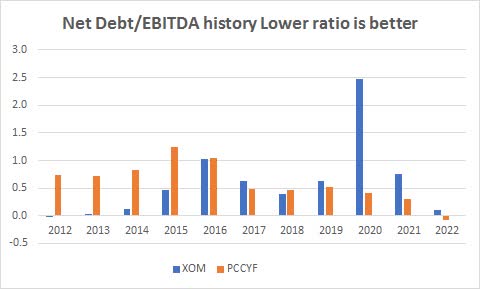
In this particular case, both stocks have shown wide variability over the last 10 years, but over the last 3 years have come down significantly, so both are in good shape for the Net Debt/EBITDA ratio test.
When it comes to share buybacks, Exxon is in the midst of a current $30 billion buyback and had bought back more than 8% of its shares over the last 10 years.
The dividend, net debt, and share buyback advantage go to Exxon.
PetroChina’s unique risks
As might be guessed from the above, PetroChina is a much riskier investment. Some but not all of PCCYF’s risks are as follows:
1. The omnipresent, controlling Chinese government risk is what I call the “China discount” and it is always lurking in the background. Who knows what the Chinese government is going to do next week let alone next year? I wrote about it in an article where I compared Amazon (AMZN) to Alibaba (BABA) “Amazon Vs. Alibaba: In The Battle Of The Giants, Who Wins? “.
2. Relative to number 1, approximately 90% of the shares in PetroChina are held by the government or state entities AKA “State-owned Legal Person”:
PetroChina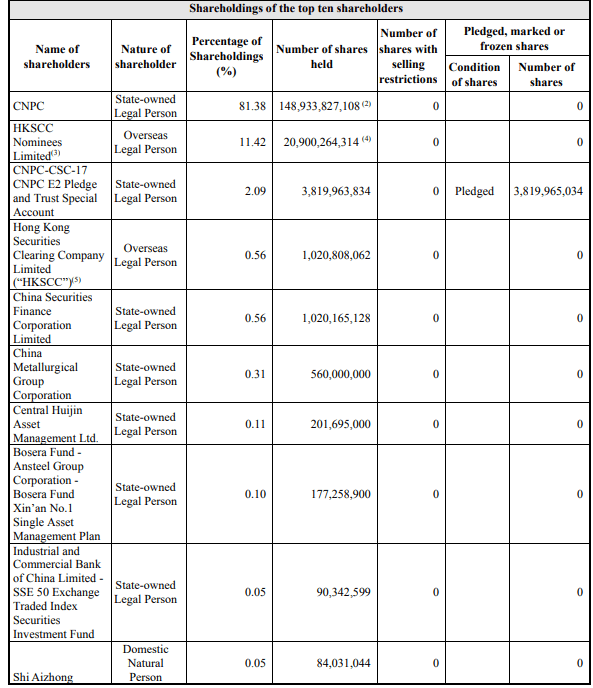
3. PetroChina voluntarily delisted from the NYSE in October because of multiple disputes with the US and “the relatively limited trading volume of the ADSs as compared to the trading volume of the H Shares on a worldwide basis,”.
4. PCCYF trades like a penny stock with a current price of about 40 cents. There are many risks between the low price and the low trading volume. Using the average trading volume of 70,000 shares a day and a price of $.40, you have an average daily trading value of $28,000.
5. The exchange rate risk between the US dollar and the Chinese Yuan/Renminbi can cause more price volatility.
General investment risks
Large, capital-intensive companies like oil companies typically have problems with debt piling up as they expand their business to cover such costs as expanding current production and finding new sources of oil. This often affects both the price of the stock and the dividend payments as they attempt to pay down the capital expended as the new services and products come on board but sometimes there is a time lag between the two.
However, in the current ESG environment the world finds itself in, that problem has by and large disappeared at least for the foreseeable future. Oil companies worldwide are cutting back on CAPEX and returning much more cash to shareholders via dividends and share buybacks.
Having said that, oil prices have historically been very volatile and that in turn is reflected in oil stock prices, so if volatility makes you nervous, oil stocks are not the way to go.
In a volatile environment like we’re facing now, cash is also a viable alternative. CD rates are now in excess of 4%, a number we haven’t seen literally in years.
In addition, there could be a recession coming or even a depression according to several economists. That may make profits elusive at best and provide losses at worst.
So please do your own due diligence on every investment option.
Conclusion
Looking at these two companies, I see PCCYF as being better on the financial metrics, mainly because of a lower P/E ratio, lower Debt/EBITDA ratio, higher margins, lower-Price/FCF, and higher dividend rate.
But due to the risks and potential volatility issues related to PetroChina, I cannot recommend it as anything but a Sell at this point.
Exxon is a Hold mainly due to the big runup it has already seen. But long term, Exxon should be very profitable for investors.
Be the first to comment