

hanhanpeggy/iStock via Getty Images
Article Thesis
The global energy crisis results in a compelling business outlook for the supermajors that produce and sell oil, natural gas, LNG, and refined products. In this article, we’ll pitch two of them, BP (NYSE:BP) and Exxon Mobil (NYSE:XOM), against each other. We’ll highlight the advantages and disadvantages of both companies to see which stock is better suited for different types of investors.
Benefitting From A Global Energy Crisis
Prices for natural gas, oil, diesel, gasoline, and even coal and electricity have been soaring around the world in 2022. Europe is most exposed due to its former reliance on Russian oil and natural gas, but even in the US, prices have risen considerably versus where they stood last year.
That’s harsh for consumers that suffer from multi-decade-high inflation that is at least partially driven by high energy prices. But at the same time, some profit from this environment, and supermajors such as BP and Exxon Mobil certainly belong to those beneficiaries. They are receiving higher prices for the oil and natural gas they produce. They benefit from very high natural gas prices in Europe and Asia via their LNG projects, and high crack spreads make their refining operations more profitable.
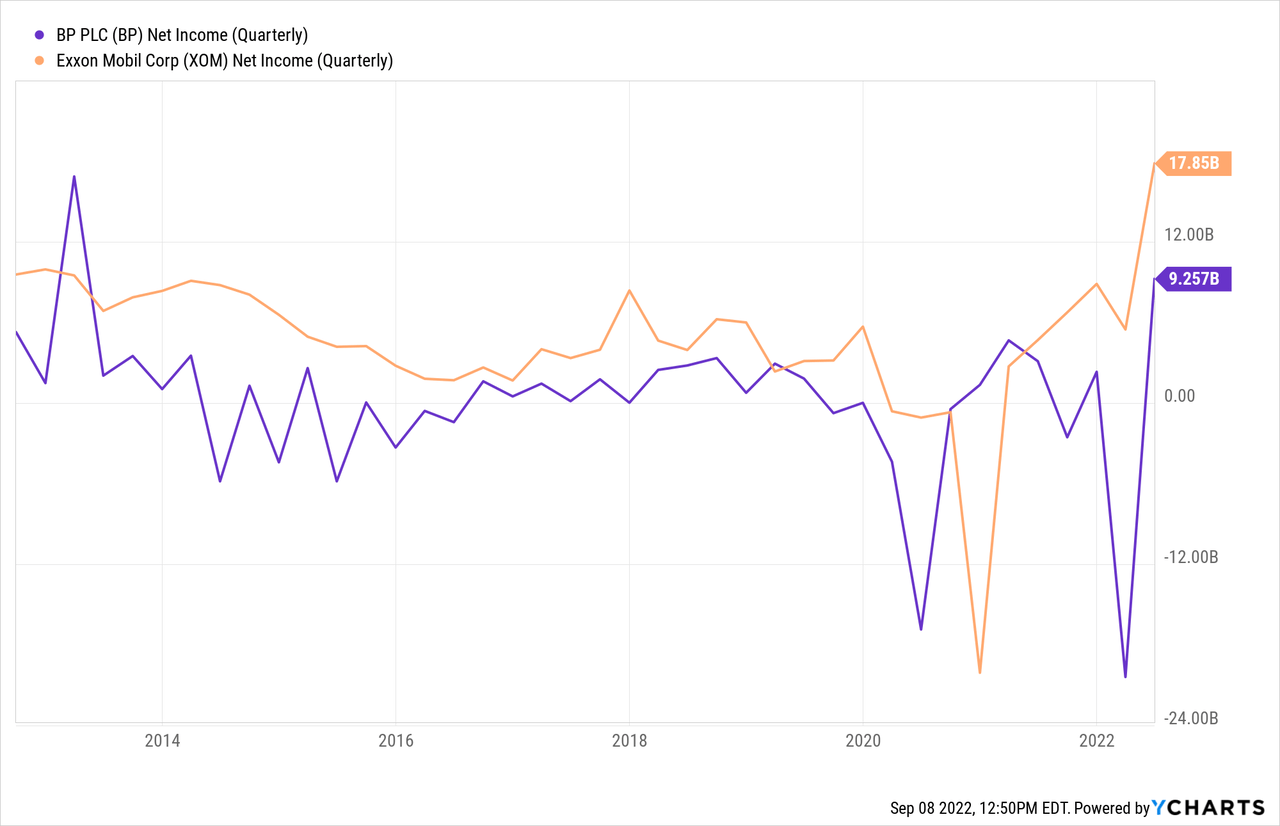
Net income for both companies has hit multi-year highs during Q2, as can be seen in the above chart. XOM’s profits were the highest in more than a decade, at $18 billion, while BP generated $9.3 billion in net earnings during the period, the highest over the last nine years.
The macro environment thus is very beneficial for both companies, but there are some important differences between these supermajors when it comes to valuation, strategy, shareholder return programs, and so on.
Strategy: XOM Versus BP
Both companies are focused on hydrocarbons right now. And those assets should continue to deliver sizeable profits for many years, as rising demand in China, India and other fast-growing countries makes for a solid macro demand picture. At the same time, supply isn’t growing much, which is why energy prices could be “higher for longer”. Still, these two companies have differing longer-term strategies when it comes to new investments.
Exxon Mobil is primarily focused on profitable, low-cost hydrocarbon projects such as its Guyana assets and US shale. The company seeks to invest in these areas to drive future cash flows, even in case oil prices drop considerably from the current levels. In fact, the company plans to be profitable with oil prices of less than $40 thanks to its investments in low-cost assets.
XOM presentation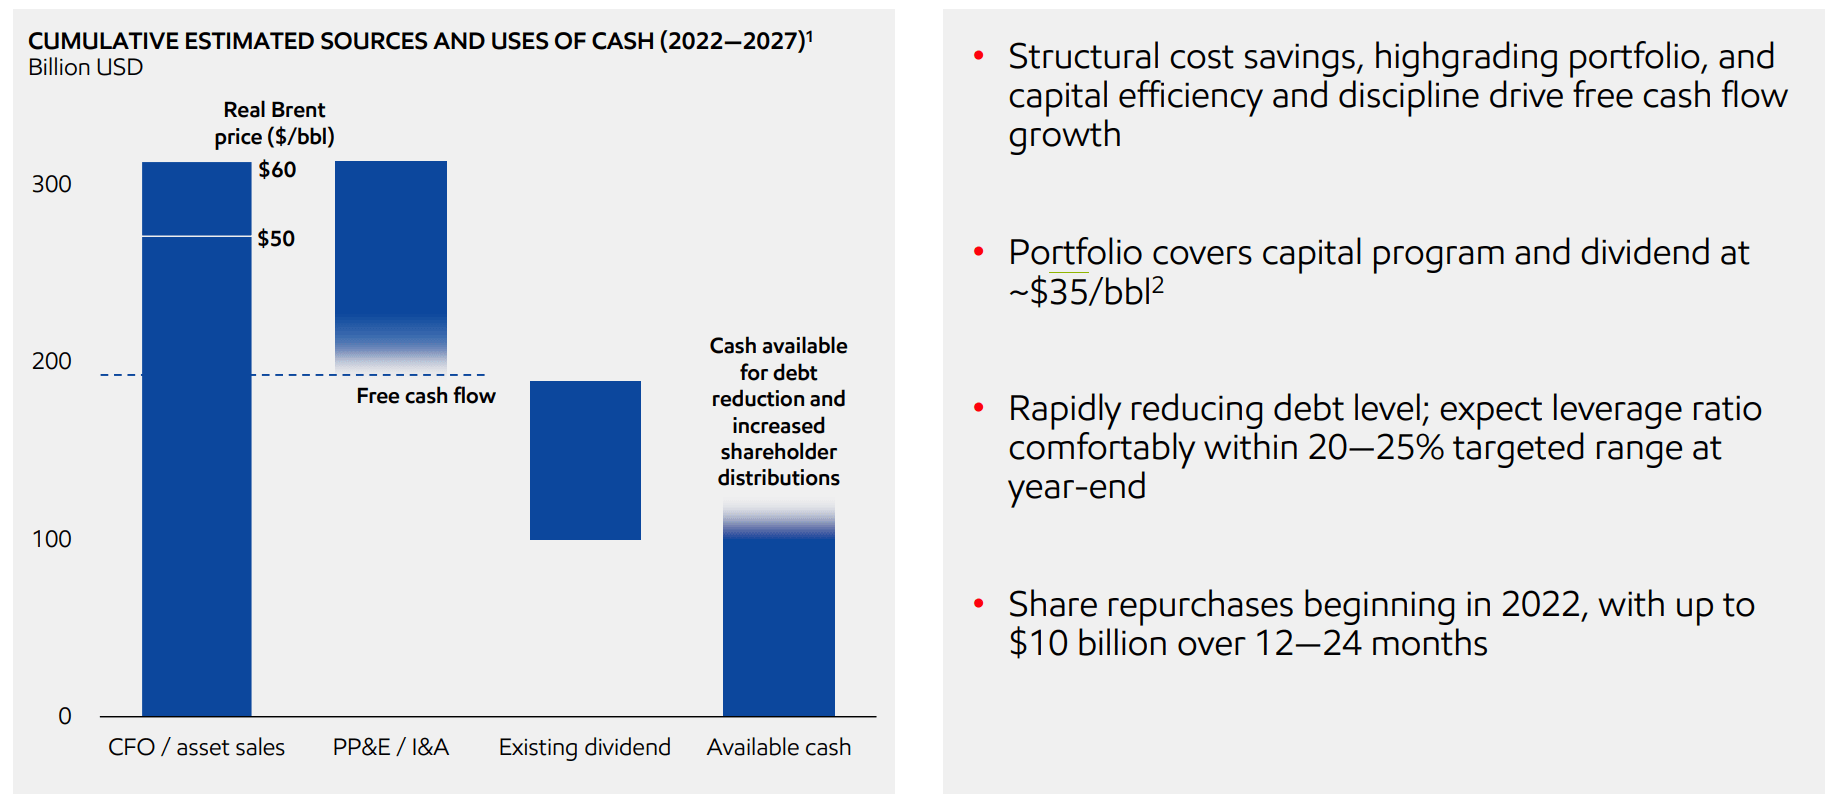
The above slide shows that XOM plans to generate a massive $200 billion in free cash through 2027 if oil prices average $60 in that time frame — massively below current price levels.
The company also plans to become a huge player in the carbon capture space, which is its favored way to play the green economy. It is not yet known whether those projects will become economically viable on a large scale eventually, but XOM’s investments in this area might pay off.
BP, on the other hand, is more focused on “traditional” green energy/green economy assets such as windparks, solar parks, electricity grid assets, EV charging stations, and so on. It will continue to generate the majority of its profits from its hydrocarbon portfolio over the next couple of years, but its investments in new oil and gas projects will not be as large as those of Exxon Mobil. Instead, BP plans to invest more in its renewable or green business, relative to what XOM plans to do. BP’s future investments will roughly be split 50-50 between green investments and traditional hydrocarbon investments. Despite these lowish investment volumes in the oil and gas space, BP plans to keep its hydrocarbon profits stable going forward, as cost efficiencies and portfolio highgrading will allow BP to generate strong profits in this space even when its production volumes decline slightly going forward. According to the company’s plans, its green businesses, called “Convenience and mobility” and “Low carbon energy” will generate EBITDA of around $12 billion in 2030. If that comes true, BP’s green business would become a pretty sizeable profit source over time. One could argue that these green businesses alone could then be worth $120+ billion at the end of the current decade, putting a 10x multiple on the forecasted EBITDA. Of course, there is no guarantee that BP will hit its profit targets, but even if it somewhat underperforms its current goals, it seems clear that the green business will eventually be worth a sizeable sum of money once sufficient scale has been reached. Of note, green electricity generating assets such as wind parks and solar farms are ultra-profitable in Europe today, thanks to enormously high electricity prices on the continent.
When it comes to strategy, XOM will stay closer to its core and focus on hydrocarbons, as it has done in the past. BP will move to a more hybrid approach of continuing some investments in oil and gas, but BP will shift a significant portion of its capital expenditures to green investments over the years.
Shareholder Returns And Balance Sheet Strength
Energy names generally aren’t traditional growth investments. Many investors are in these stocks for their shareholder return potential. Both BP and XOM look pretty solid on that front.
XOM currently offers a dividend yield of 3.7%, while BP’s dividend yield stands at 4.7% today. XOM has the better dividend growth track record, however, having raised its dividend for decades, whereas BP reduced its dividend during the pandemic. A case can be made for both companies, depending on whether one values current yield or dividend consistency higher. The dividends of both companies look very sustainable at current prices, as the payout ratios based on current estimates are just 28% for Exxon Mobil and an even lower 17% for BP.
Thanks to healthy profits in 2021, and especially in H1 of 2022, both companies have cleaned up their balance sheets considerably in the recent past:
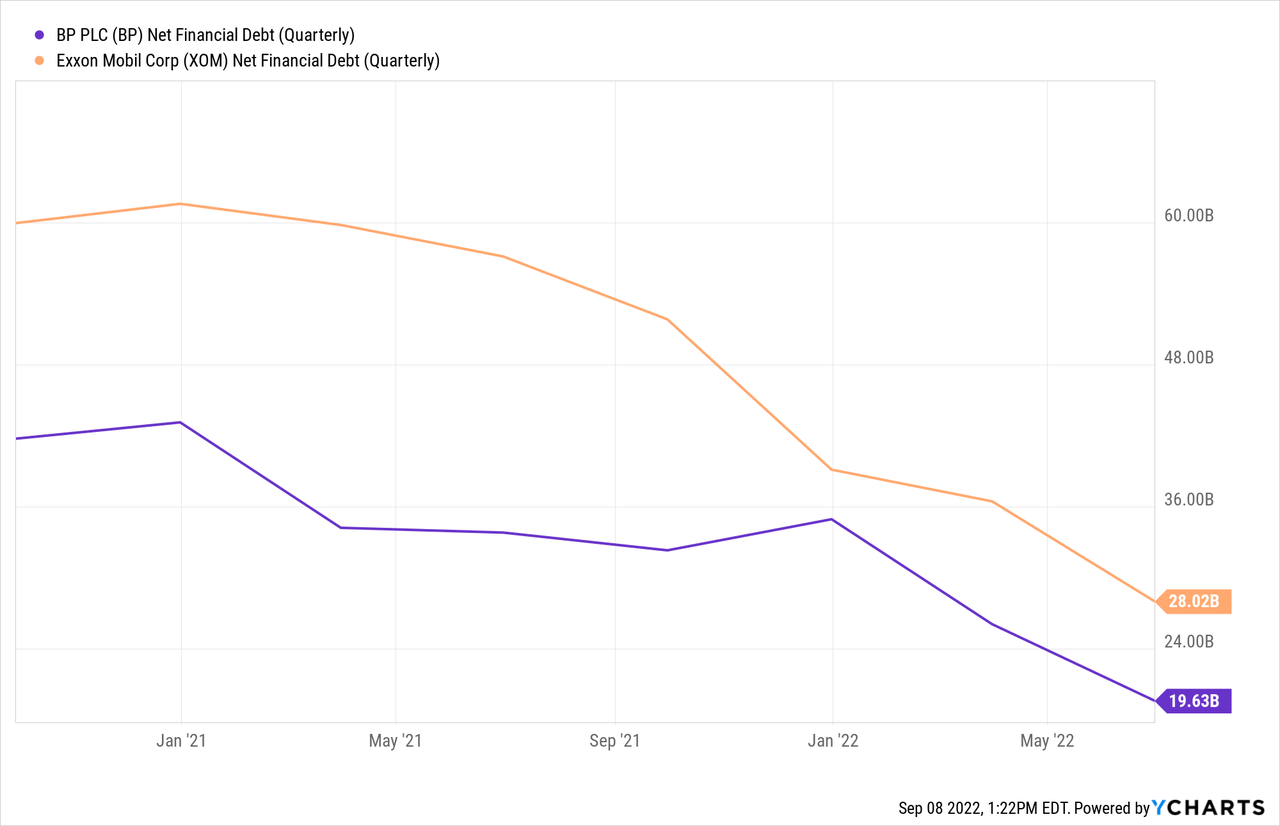
Net debt has dropped to $28 billion for XOM and $20 billion for BP, respectively. That’s less than half the net debt level from two years ago, during the midst of the pandemic. Debt levels are not looking threatening at all for either company, as both profits and cash flows have soared at the same time net debt has dropped. On a net debt to EBITDA basis, both companies employ pretty low leverage of around 0.3. Nevertheless, both companies seem eager to reduce debt levels further. I don’t think that’s necessary, but it also isn’t a bad strategy as it shifts value from debt holders to equity holders over time and as it reduces risks further, in case there is a sudden downturn in commodity prices (a scenario that I do not see as likely).
Both companies also employ share repurchases, as their free cash flows are high enough to pay dividends and reduce debt, and there’s still cash left over. XOM has recently announced a $30 billion buyback program, which is enough to buy back 8% of the company at current prices. BP’s buybacks are even more aggressive, or, one could say, even more value-creating. The company has announced a $3.5 billion buyback program for the current quarter, which is equal to 3.7% of the company’s market capitalization — on an annual basis, that makes for a buyback yield of around 15%. And thanks to BP’s very low valuation and strong cash generation, it is able to pursue buybacks at this pace easily. Its free cash flows totaled $8 billion in Q2 alone, which means that free cash flow after dividends and the announced $3.5 billion in quarterly buybacks was still at a level of more than $3 billion that was available for debt reduction.
Valuation
Possibly the biggest difference between XOM and BP stock emerges when we look at how these two supermajors are valued:
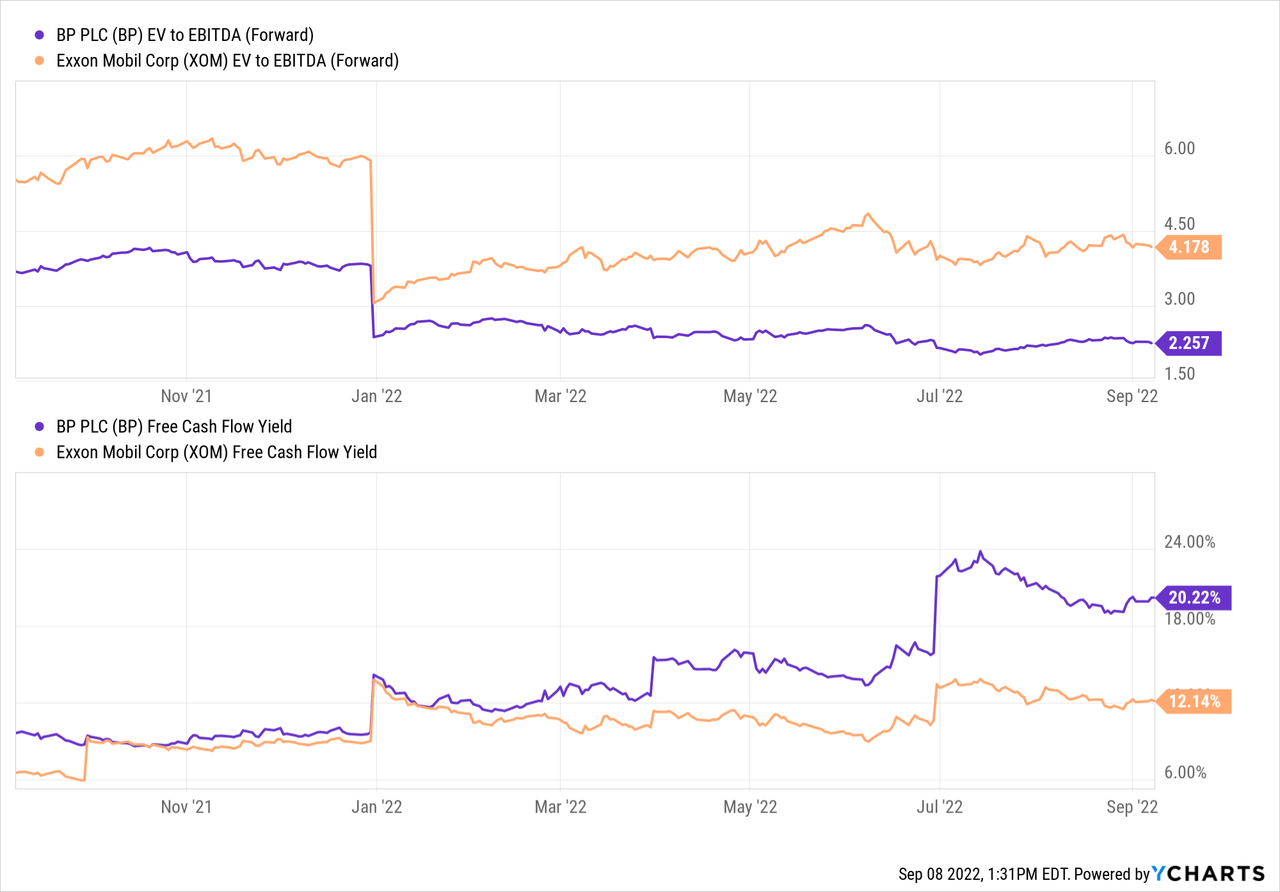
BP’s current enterprise value to EBITDA multiple of 2.3 is a little more than half as high as that of XOM. That doesn’t mean that XOM is expensive — it’s relatively inexpensive as well. BP is just an even bigger bargain. The same holds true when we look at free cash flows: Exxon Mobil’s trailing free cash flow yield of 12% is attractive, for sure, but BP’s trailing FCF yield of 20% is even better. Free cash flow yields should improve further in H2 2022, as H2 2021 is lapped.
To some degree, BP’s lower valuation makes sense. There are larger uncertainties when it comes to its future business model due to the more aggressive shift towards green energy. BP also is more exposed to windfall profit taxation in Europe. But at the same time, it seems questionable to me whether these uncertainties justify a valuation discount of close to 50%. The UK’s new prime minister Liz Truss has just announced a more hydrocarbon-friendly stance, which should reduce regulatory risks for BP. To me, it thus seems questionable whether BP should trade at a valuation this low, relative to its US-based supermajor peers.
Takeaway
Both XOM and BP are making a lot of money right now. Both should be solid investments at current prices, I believe, as the longer-term supply-demand picture for oil and gas is very solid for producers.
Whether one favors BP or XOM depends on one’s investment approach and goals. BP is cheaper, offers a higher yield, bigger buybacks, but is slowly shifting away from its hydrocarbon core business. XOM’s strategy is more focused on where the company came from, but its yield is lower, and it’s not as much of a bargain as BP. For some investors, BP will be the better choice, while others will favor XOM for its qualities and strategy. To me, both seem good, with BP likely a little ahead thanks to its much lower valuation — the discount does not seem entirely justified.
Be the first to comment