

JHVEPhoto/iStock Editorial via Getty Images
Investment Thesis
- Exxon Mobil (NYSE:XOM) has strong competitive advantages that contribute to the company’s growth: it has strong financials (EBIT Margin of 14.06% and an Aa2 credit rating by Moody’s), large economies of scale and a global and broad diversified product portfolio.
- The company currently receives my buy rating: this is underlined by the attractive overall rating as according to the HQC Scorecard (the company receives 60/100 points) and the excellent result of the Seeking Alpha Quant Ranking, in which it is placed 3rd out of 4715.
- Exxon Mobil has increased its dividend by almost 3% per year on average over the last five years and the company’s current payout ratio is just 35.67%, leaving enough scope for future dividend enhancements.
- However, I would buy the stock in different tranches and not all shares at the same time due to the fact that historically, the valuation of the stock is not particularly low.
Exxon Mobil’s Competitive Advantages and Growth Drivers
Exxon Mobil has several strong competitive advantages that I expect will contribute to its future growth:
Exxon Mobil’s Financial Strength
In 2021, Exxon Mobil generated a revenue of $276,692M and an EBIT of $26,780M. In the last twelve months, the company’s revenue has been $352,196M while it has generated an EBIT of $49,898M in the same period. Exxon Mobil’s financial strength is underlined by an Aa2 credit rating by Moody’s. At the current stock price of $101.45, the company’s Free Cash Flow Yield [TTM] is 11.14%. This amount of Free Cash Flow can be used to pay the dividend to its shareholders and also to buy back the company’s own shares. In January 2021, Exxon Mobil started a $10 billion share-repurchase program, which it plans to complete over the following two years. These numbers are evidence of the enormous financial strength of the company.
Exxon Mobil’s Economies of Scale
Exxon Mobil’s economies of scale are one of its competitive advantages. Economies of scale are cost advantages that occur when a company raises its level of output. The cost advantages are a result of a lower per-unit fixed cost when increasing the quantity of output. Exxon Mobil’s economies of scale result in a strong competitive advantage in comparison to smaller companies from the Integrated Oil and Gas Industry.
Exxon Mobil’s Global and Diversified Product Portfolio
Exxon Mobil’s business units are divided into Upstream, Downstream and Chemical. In 2021, the company’s earnings after income taxes were $15.775M in its Upstream business unit, $2.105M in its Downstream unit, and $7.796M in its Chemical unit. Regarding its crude oil and natural gas liquids production, Exxon Mobil distinguishes among the following regions: United States, Canada/Other Americas, Europe, Africa, Asia and Australia/Oceania. While 36.96% is produced in the United States, 31.12% is produced in Asia, 18.48% in Africa and 9.97% in Canada/Other Americas. These numbers provide strong evidence for the global and broad diversified product portfolio, which gives Exxon Mobil an additional competitive advantage over its rivals.
Exxon Mobil’s competitive advantages contribute to my current buy rating on its stock.
XOM Stock Valuation
Discounted Cash Flow [DCF]-Model
I have used the DCF Model to determine the intrinsic value of Exxon Mobil. The method calculates a fair value of $108.46 for the company. Its current stock price of $101.45 gives Exxon Mobil an upside of 6.9%.
My calculations are based on these assumptions as presented below (in $ millions except per share items):
|
Exxon Mobil |
|
|
Company Ticker |
XOM |
|
Tax Rate |
31% |
|
Discount Rate [WACC] |
8.00% |
|
Perpetual Growth Rate |
3% |
|
EV/EBITDA Multiple |
6.0x |
|
Current Price/Share |
$101.45 |
|
Shares Outstanding |
4,168 |
|
Debt |
$46,883 |
|
Cash |
$18,861 |
Source: The Author
Based on the above, I have calculated these results for Exxon Mobil:
Market Value vs. Intrinsic Value
|
Exxon Mobil |
|
|
Market Value |
$101.45 |
|
Upside |
6.9% |
|
Intrinsic Value |
$108.46 |
Source: The Author
Internal Rate of Return for Exxon Mobil
The Internal Rate of Return [IRR] is defined as the expected compound annual rate of return earned on an investment. Below you can find the Internal Rate of Return as according to my DCF Model. I assume different purchase prices for the Exxon Mobil stock.
At Exxon Mobil’s current stock price of $101.45, my DCF Model indicates an Internal Rate of Return of approximately 10% for the company. (In bold you can see the Internal Rate of Return for Exxon Mobil’s current stock price of $101.45.) Please note that the Internal Rates of Return below are a result of the calculations of my DCF Model and changing its assumptions could result in different outcomes.
|
Purchase Price of the Exxon Mobil Stock |
Internal Rate of Return as according to my DCF Model |
|
$80.00 |
17% |
|
$85.00 |
15% |
|
$90.00 |
13% |
|
$95.00 |
12% |
|
$100.00 |
10% |
|
$101.45 |
10% |
|
$105.00 |
9% |
|
$110.00 |
8% |
|
$115.00 |
6% |
|
$120.00 |
5% |
|
$125.00 |
4% |
|
$130.00 |
3% |
Source: The Author
Exxon Mobil’s Fundamentals
In the following I will compare Exxon Mobil’s fundamentals to some of its competitors, such as Chevron (NYSE:CVX), Shell (NYSE:SHEL) and TotalEnergies (NYSE:TTE).
It can be highlighted that, with a market capitalization of $413.39B, Exxon Mobil has a higher market capitalization than Chevron ($313.46B), Shell ($183.36B) and TotalEnergies ($131.75B). In addition to that, Exxon Mobil is larger than those competitors in terms of revenue: while it generates a revenue of $354.96B, the one of Chevron is $206.10B, Shell’s is $329.59B and TotalEnergies’ is $238.76B.
These numbers underline Exxon Mobil’s market power and its global and diversified portfolio.
Exxon Mobil’s Return on Equity [ROE] is 23.05%, which is higher than that of Chevron (ROE of 20.24%), Shell (20.16%) and TotalEnergies (18.66%), demonstrating that the company uses shareholder’s equity even more efficient than its competitors in order to generate income.
Exxon Mobil also has a higher Average EBIT Growth Rate over the last three years (39.18%) than its competitors Chevron (28.83%), Shell (14.00%) and TotalEnergies (33.30%), indicating that the company is growing its profits at a higher rate than its opponents from the Integrated Oil and Gas Industry.
In addition to the above, Exxon Mobil also has the highest EBITDA ($69.71B) when compared to Chevron (EBITDA of $47.28B), Shell ($64.38B) and TotalEnergies ($55.35B), which indicates that the risk of investing in Exxon Mobil is lower than the risk of investing in the aforementioned competitors.
When comparing Exxon Mobil’s fundamental data to its competitors Chevron, Shell and TotalEnergies, we get further evidence that the company is an excellent choice for investors.
|
Exxon Mobil |
Chevron |
Shell |
TotalEnergies |
||
|
General Information |
Ticker |
XOM |
CVX |
SHEL |
TTE |
|
Sector |
Energy |
Energy |
Energy |
Energy |
|
|
Industry |
Integrated Oil and Gas |
Integrated Oil and Gas |
Integrated Oil and Gas |
Integrated Oil and Gas |
|
|
Market Cap |
413.39B |
313.46B |
183.36B |
131.75B |
|
|
Profitability |
EBIT Margin |
14.06% |
15.13% |
13.43% |
17.54% |
|
ROE |
23.05% |
20.24% |
20.16% |
18.66% |
|
|
Valuation |
P/E GAAP [FWD] |
8.23 |
8.79 |
4.25 |
4.47 |
|
Growth |
Revenue Growth 3 Year [CAGR] |
9.27% |
10.45% |
-4.35% |
8.87% |
|
Revenue Growth 5 Year [CAGR] |
10.01% |
12.03% |
4.03% |
11.38% |
|
|
EBIT Growth 3 Year [CAGR] |
39.18% |
28.83% |
14.00% |
33.30% |
|
|
EPS Growth Diluted [FWD] |
NM |
NM |
– |
106.90% |
|
|
Dividends |
Dividend Yield [FWD] |
3.50% |
3.52% |
3.89% |
5.22% |
|
Dividend Growth 3 Yr [CAGR] |
1.36% |
6.09% |
– |
-0.57% |
|
|
Dividend Growth 5 Yr [CAGR] |
2.98% |
5.33% |
– |
0.90% |
|
|
Consecutive Years of Dividend Growth |
19 Years |
34 Years |
0 Years |
0 Years |
|
|
Income Statement |
Revenue |
354.96B |
206.10B |
329.59B |
238.76B |
|
EBITDA |
69.71B |
47.28B |
64.38B |
55.35B |
|
|
Balance Sheet |
Total Debt to Equity Ratio |
25.41% |
16.97% |
43.10% |
52.69% |
Source: Seeking Alpha
Exxon Mobil’s Dividend Projection
Exxon Mobil has raised its dividend by 2.98% per year on average in the past five years. Its payout ratio is currently 35.67%, showing potential for future dividend enhancements. Assuming that the company would continue to raise its dividend by about 3% per year in the next 30 years, we would get the following results concerning its yield on cost:
Projection of Exxon Mobil’s Yield on Cost When Assuming a Dividend Growth Rate of 3% per Year on Average
Source: The Author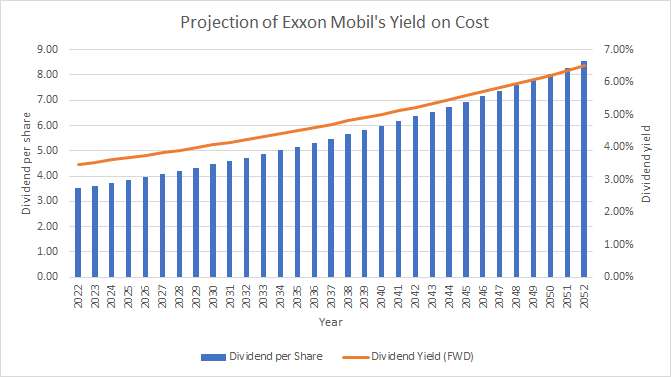
Below you can find Exxon Mobil’s accumulated yield on cost when assuming a dividend growth rate of 3% per year in the following 30 years. According to the data shown below, you would receive 89.96% of your initial investment in the form of dividends after 20 years (for simplification, no withholding tax has been taken into account). After 30 years, you would receive an accumulated dividend of 149.01%.
Projection of Exxon Mobil’s Accumulated Dividend When Assuming a Dividend Growth Rate of 3% per Year on Average
|
Year |
Dividend per Share |
Yield on Cost [FWD] |
Accumulated Yield on Cost |
|
2022 |
3.52 |
3.47% |
3.47% |
|
2032 |
4.73 |
4.24% |
42.27% |
|
2042 |
6.36 |
5.23% |
89.96% |
|
2052 |
8.54 |
6.50% |
149.01% |
Source: The Author
The data above shows that Exxon Mobil is an attractive choice when investing with a long investment horizon and when aiming to benefit from the company’s dividend payments.
The High-Quality Company [HQC] Scorecard
“The aim of the HQC Scorecard that I have developed is to help investors identify companies which are attractive long-term investments in terms of risk and reward.” Here you can find a detailed description of how the HQC Scorecard works.
Overview of the Items on the HQC Scorecard
“In the graphic below, you can find the individual items and weighting for each category of the HQC Scorecard. A score between 0 and 5 is given (with 0 being the lowest rating and 5 the highest) for each item on the Scorecard. Furthermore, you can see the conditions that must be met for each point of every rated item.”
Source: The Author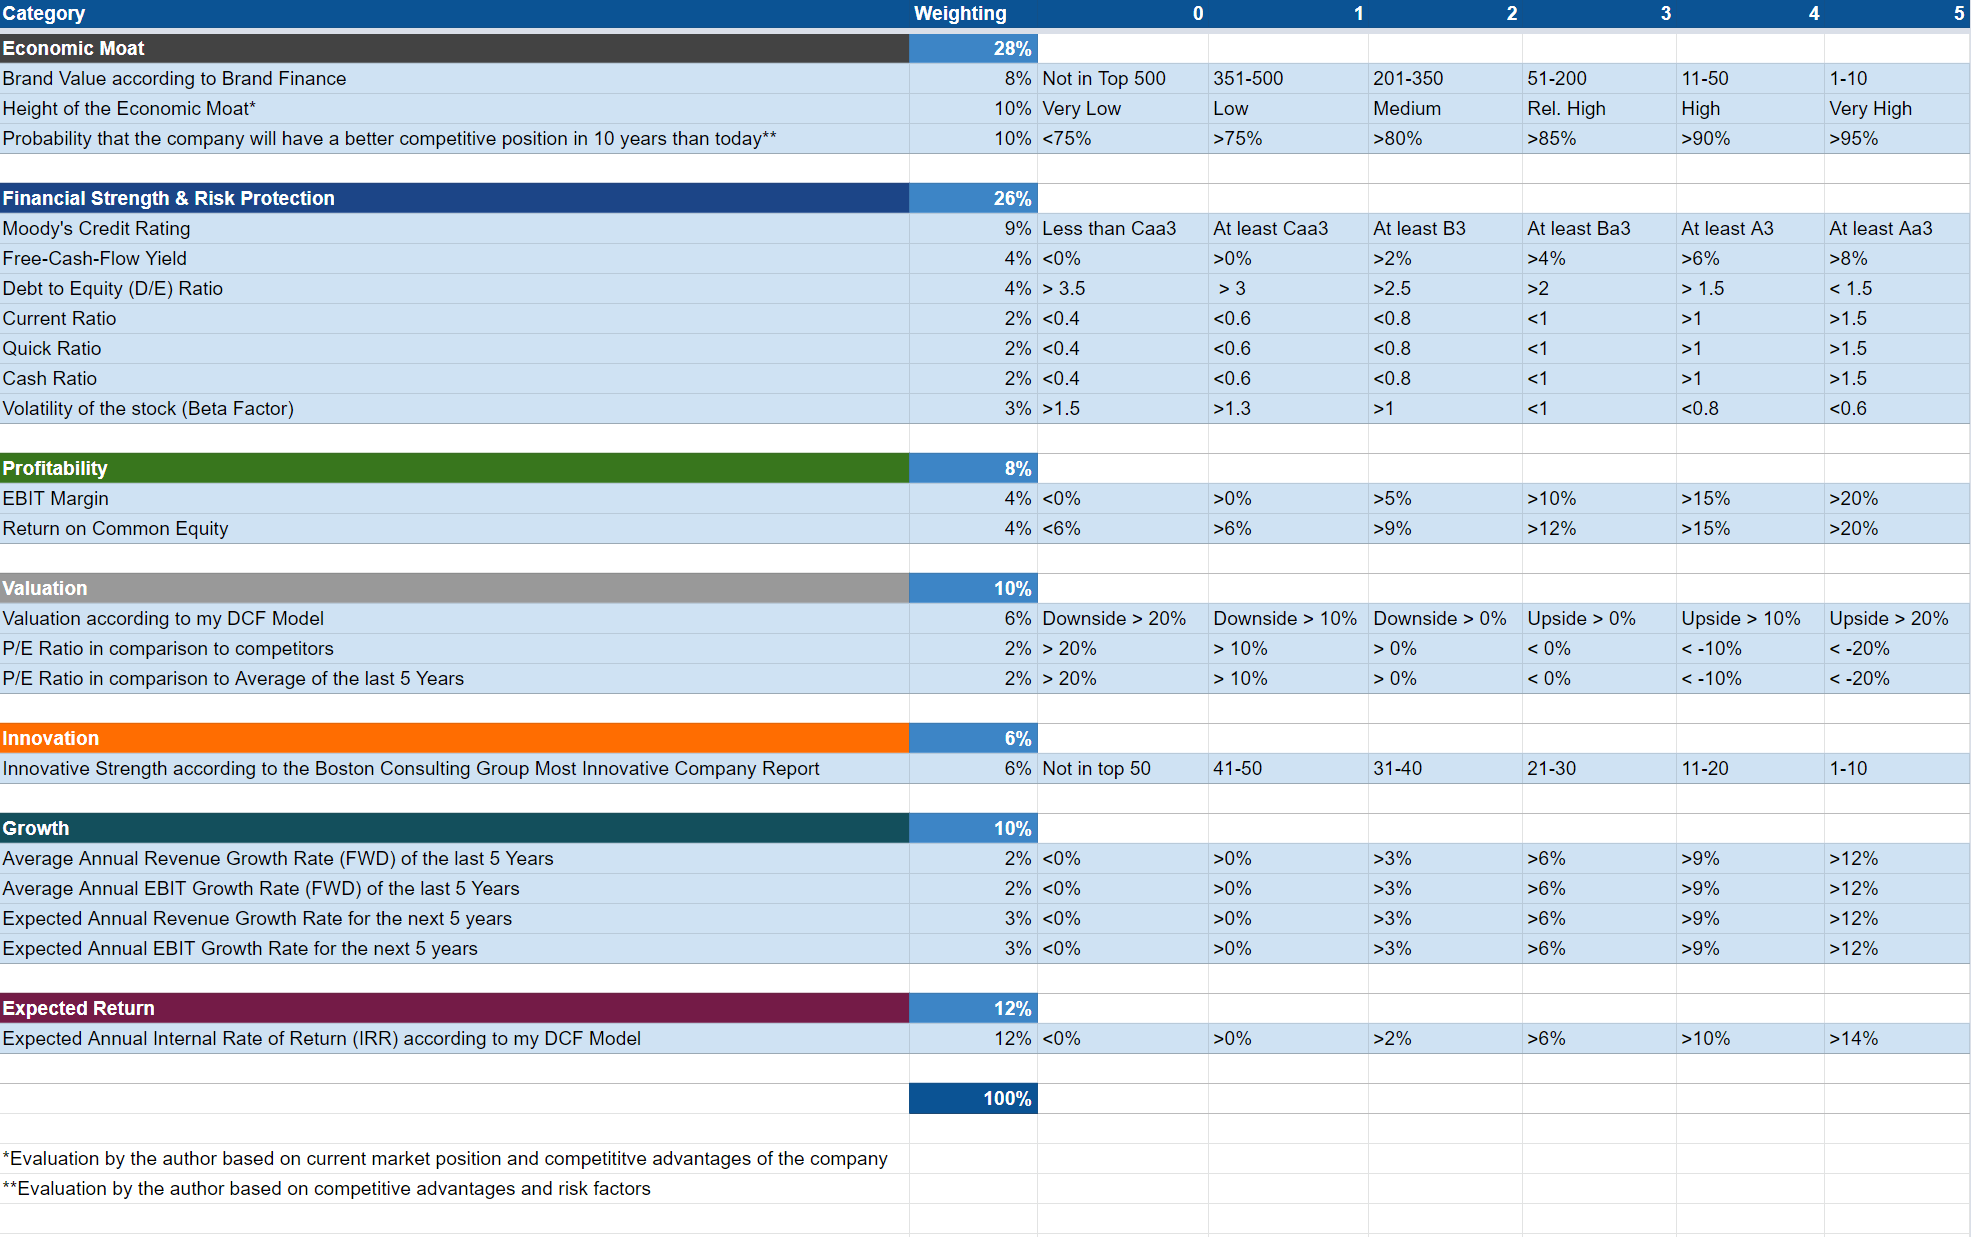
Exxon Mobil According to the HQC Scorecard
Source: The Author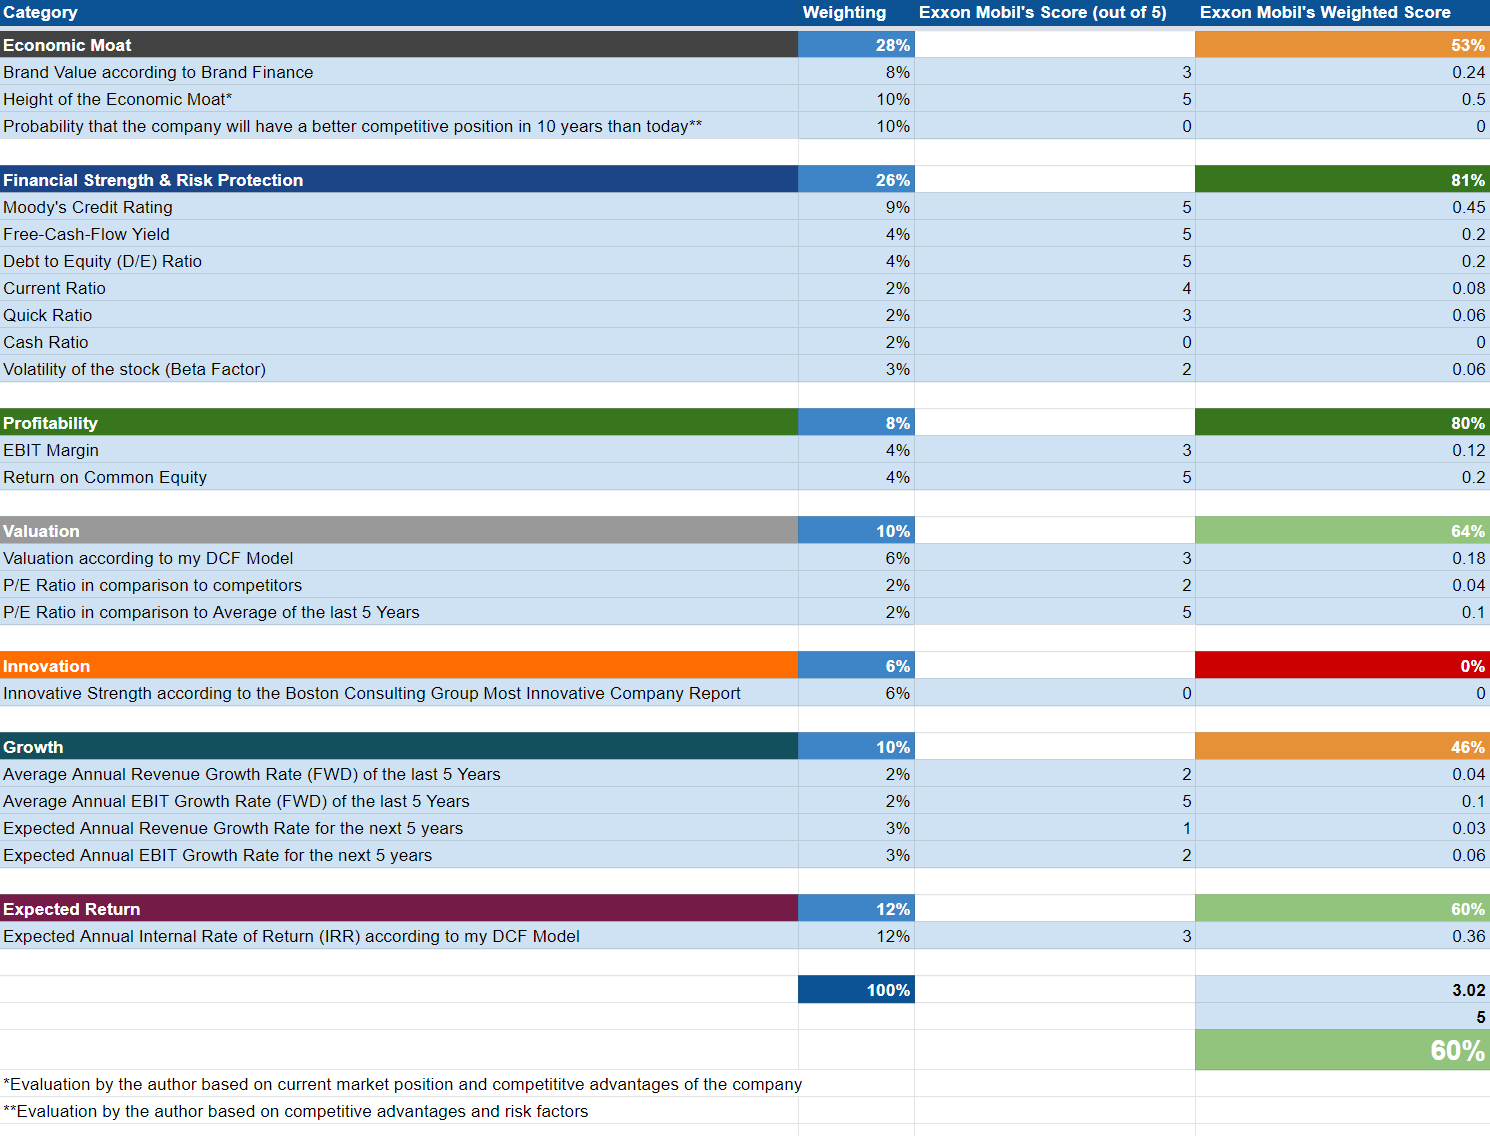
Exxon Mobil receives an attractive overall rating as according to the HQC Scorecard (60/100 points).
According to the HQC Scorecard, Exxon Mobil is rated as very attractive in terms of Financial Strength (81/100 points) and Profitability (80/100). Meanwhile, the company is rated as attractive in the categories of Valuation (64/100) and Expected Return (60/100).
In terms of Economic Moat (53/100 points) and Growth (46/100), the company is rated as moderately attractive.
The attractive overall rating of Exxon Mobil as according to the HQC Scorecard strengthens my opinion to rate it as a buy and underlines my theory that the company is a must have stock for dividend income investors.
Exxon Mobil According to the Seeking Alpha Quant Factor Grades
Let’s have a look at the Seeking Alpha Quant Factor Grades: for Valuation, Exxon Mobil receives a D+ rating and for Growth, the company gets a C. When taking into account the category of Profitability, Exxon Mobil receives an A+ rating. For Momentum, it receives a B+ and for Revisions, a B. This attractive valuation for Exxon Mobil further supports my theory that the company is currently a buy.
Source: Seeking Alpha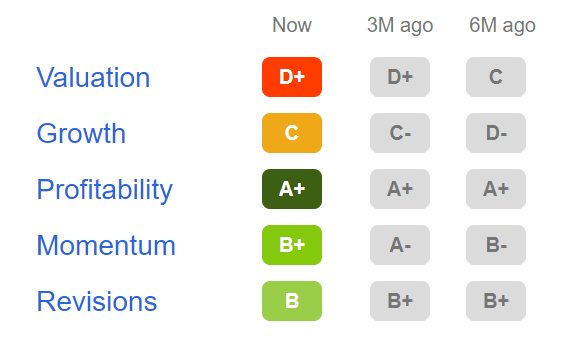
Exxon Mobil According to the Seeking Alpha Quant Ranking
When taking a look at the Seeking Alpha Quant Ranking, we get additional support for the theory that Exxon Mobil is currently a buy. In the Integrated Oil and Gas Industry, the company is currently ranked 2nd out of 19. Within the Energy Sector, Exxon Mobil is ranked 3rd out of 248. When taking into account the overall ranking, we can see that the company is ranked 3rd out of 4715. This is yet another strong indicator that the stock of Exxon Mobil is currently a buy.
Source: Seeking Alpha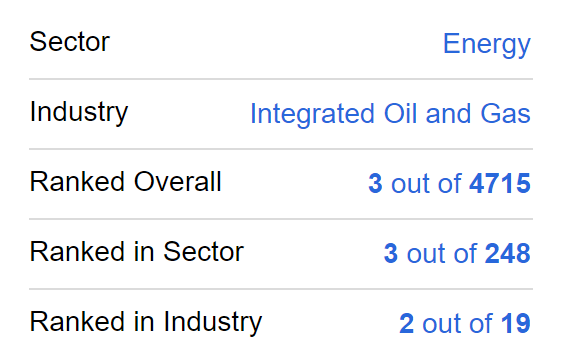
Exxon Mobil According to the Seeking Alpha Quant Rating
The Seeking Alpha Quant Rating once again underlines my own buy rating for Exxon Mobil. According to the Seeking Alpha Quant Rating, the company is rated as a strong buy.
Source: Seeking Alpha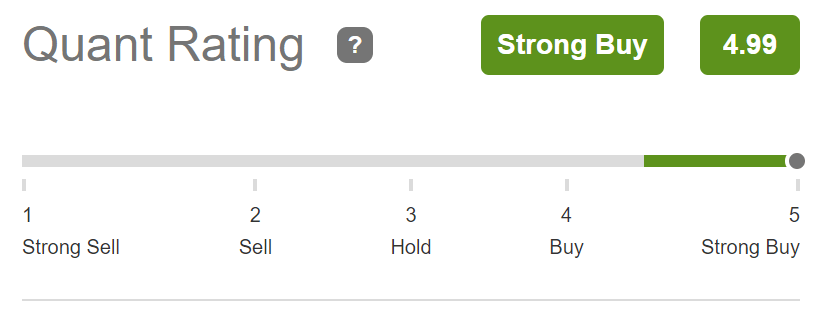
XOM Stock According to the Seeking Alpha Authors Rating and Wall Street Analysts Rating
When taking into account the Seeking Alpha Authors rating and the Wall Street Analyst rating, we can see that Exxon Mobil is also rated as a buy.
Source: Seeking Alpha
Exxon Mobil According to the Seeking Alpha Dividend Grades
The Seeking Alpha Dividend Grades confirm that Exxon Mobil is a must have for dividend income investors: in terms of Dividend Growth and Dividend Consistency, the company is rated with an A rating. For Dividend Safety, Exxon Mobil receives a B- rating and for Dividend Yield, it gets a C+.
Source: Seeking Alpha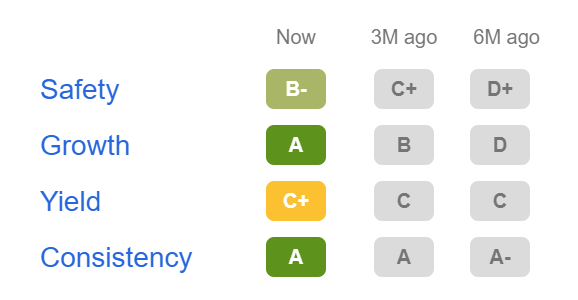
Risks
One of the main risk factors when investing in Exxon Mobil is that its financial results are significantly affected by any modifications in oil, gas, and petrochemical prices. The oil, gas, and petrochemical prices depend on regional and global events which affect supply and demand for the product. Any decline in oil or gas prices could have adverse effects on Exxon Mobil’s financial results and could cause its profit margins to decrease. For this reason, I would only recommend that you invest in Exxon Mobil with a long investment horizon (of at least 10 years) and with the intention to benefit from its constantly growing dividend and not to speculate on a short-term basis.
In addition, I see the economic conditions as an additional risk factor to take into account when considering whether or not to invest in Exxon Mobil. The demand for energy and petrochemicals is linked with economic activities and also with levels of prosperity. A decreasing demand for energy and petrochemicals in times of a recession could adversely affect Exxon Mobil’s financial results and its profit margins could decline.
An additional risk factor I see when deciding to invest in Exxon Mobil is that its dividend could be cut in the future. However, since Exxon Mobil’s dividend payout ratio is currently 35.67%, I consider the risk of a dividend reduction as currently being relatively low. The fact that Exxon Mobil has an Average Dividend Growth Rate of 2.98% over the last 5 years and the company has managed to raise its dividend over the last 19 years are additional indicators that the risk of a dividend reduction in the near future is not high.
I consider the risk of bankruptcy for the company to be very low. My opinion is underlined by Moody’s Aa2 credit rating. According to Moody’s, obligations rated as Aa are subject to a very low credit risk.
The Bottom Line
In this analysis on Exxon Mobil, I have shown why I consider its stock to be a must have for dividend income investors. The company has strong competitive advantages that contribute to its growth: Exxon Mobil has strong financials (EBIT Margin of 14.06% and an Aa2 credit rating by Moody’s), large economies of scale and a global and diversified product portfolio, which makes it more resistant compared to smaller and less well diversified companies from the Oil and Gas Industry in times of a recession.
Exxon Mobil’s Return on Equity [ROE] of 23.05% is an indicator that the company efficiently uses the equity of shareholders in order to generate income.
In my opinion, the Exxon Mobil stock is particularly attractive for dividend income investors that aim to invest with a long investment horizon. The HQC Scorecard shows that Exxon Mobil can currently be rated as attractive in terms of risk and reward: the company achieves 60/100 points.
Exxon Mobil has increased its dividend by almost 3% per year on average over the last five years and its payout ratio is currently 35.67%.
Exxon Mobil currently receives my buy rating, but I would suggest that you invest with a very long horizon of at least 10 years and with the intention of benefiting from its growing dividend and not to speculate over the short term.
Be the first to comment