

franckreporter
Thesis
The market is currently projecting NEGATIVE EPS growth for both Exxon Mobil Corporation (NYSE:XOM) and Chevron Corporation (NYSE:CVX). As to be detailed later, consensus estimates are for XOM’s EPS to decline at a 10.4% CAGR over the next 5 years, and a 10.6% decline for CVX. There are certainly good reasons for such a pessimistic view, and it is the main thesis of this article to examine these reasons closely and present my alternative view. And here, as a summary, the remainder of the article will build the thesis from the following two directions:
- The market seems still holding onto the view that oil prices and energy demands can be modulated by government policies in the near term. In the next section immediately below, as an example, I will dissect President Biden’s first round of efforts to curb energy prices and argue why the high prices will persist.
- The way I see it, the market’s projection of negative EPS growth would require ALL the following: negative topline growth, shrinking margin, and also share dilution (or at least lack of share buybacks). While in reality, I see constant or even expanding overall demand for traditional oil and natural gas, healthy and stable margins, and also steady share repurchases supported by robust organic cash flow in the next 3~5 years at least.
The market has not learned the lesson from Round 1
First, let’s start with a review of D.C.’s last round of efforts to curb energy prices and see the market has not learned its lessons yet in my view.
The following chart summarizes the key events during round 1. At the end of March this year, President Biden announced the release of 1 million barrels per day of U.S. Strategic Petroleum Reserves (“SPR”) in the next 6 months to combat the soaring energy prices caused by the situation in Ukraine. At that time, the retail gas price surged to about $4.2 per gallon, a surge of more than 25% in about a month since the Russian/Ukraine war broke out. The retail gas price indeed decreased a little bit in the following month but resumed its climb quickly and peaked at around $5.1 in June~July. I am not too surprised by these developments, as argued in my other articles, I see the supply-demand imbalance as a structural problem accumulated over years of underinvestment. And I do not see a short-term solution like the release of the SPR as a viable solution.
Source: Author based on Seeking Alpha data.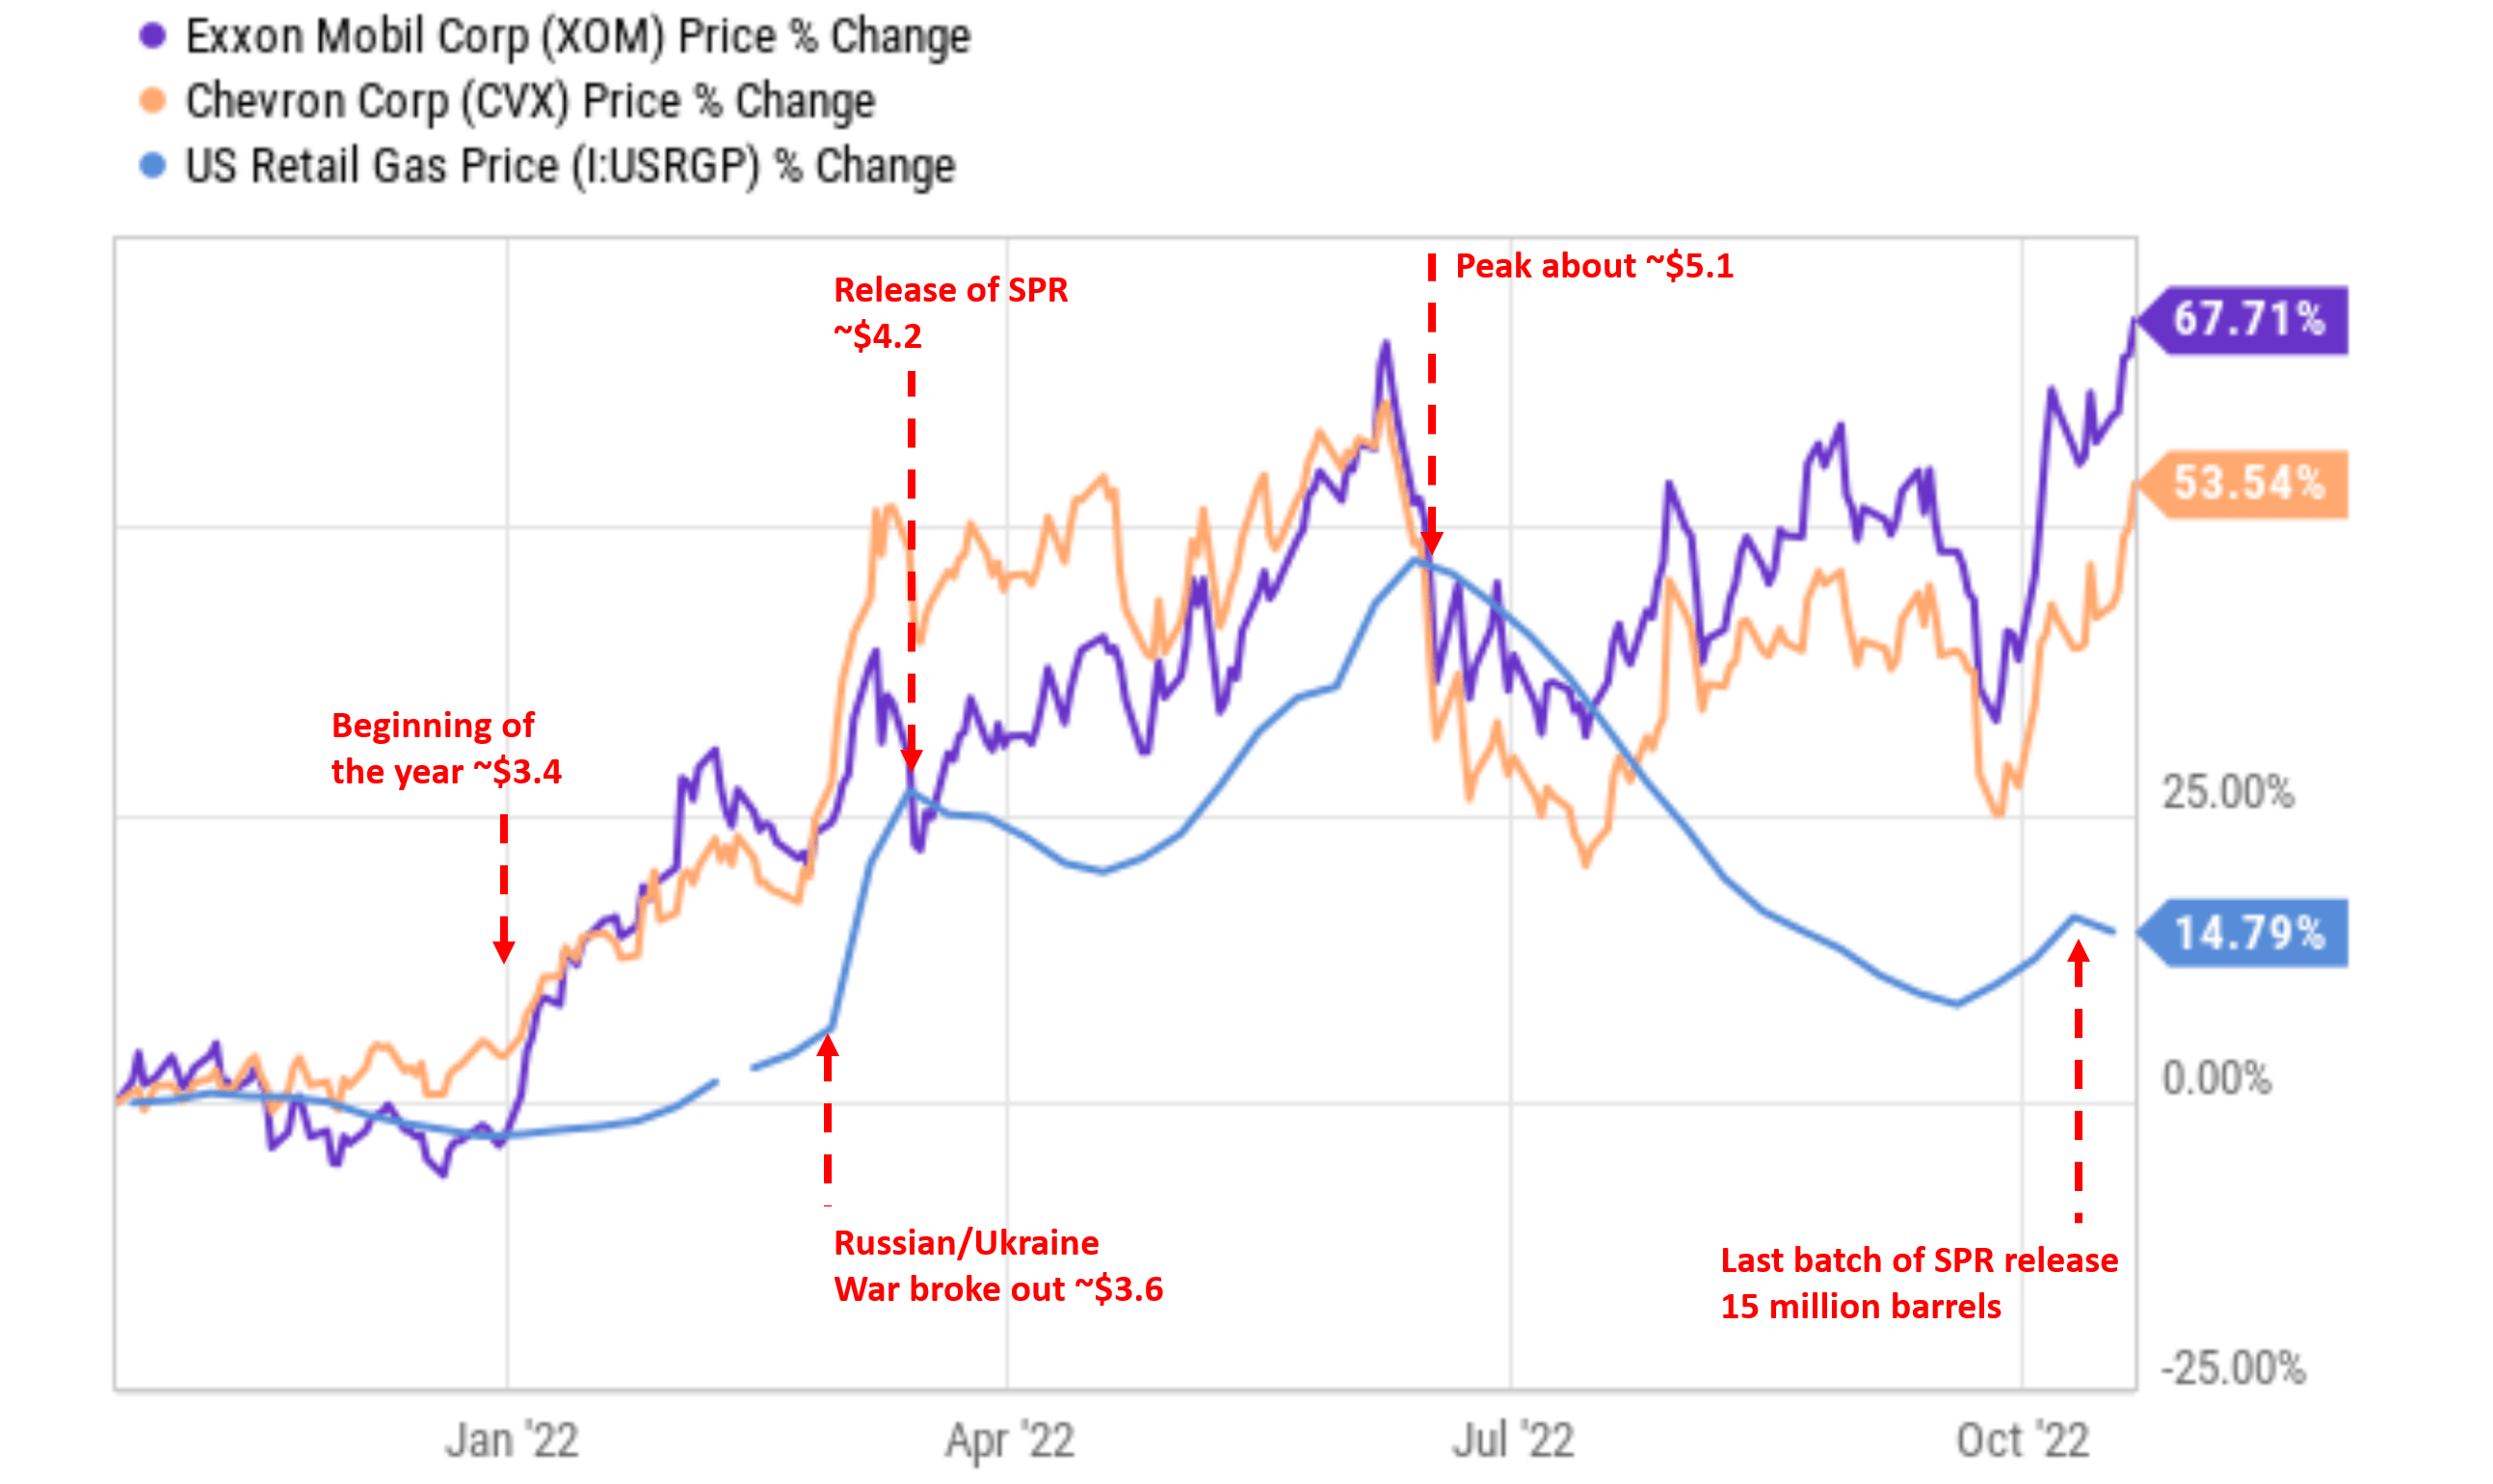
Fast forward to now, Biden announced a few days ago that the U.S. government is ready to release the last batch of 15 million barrels of the 180 million barrels planned in March. The announcement further added that the administration is open to releasing more of the reserves if the situation requires it. I am still holding my above view that the problem is a structural problem accumulated over years and the release of the SPR is not a viable solution. A few factors to consider:
- The above release of the oil reserves is only a drop in the bucket once put into perspective. According to the data of the U.S. Energy Information Administration (“EIA”), 15 million barrels of crude oil are not even enough to meet one day’s demand in the U.S. market.
- There is only about 400 million barrels remaining in the U.S. strategic stockpile, the lowest level since 1984. The administration soon will face the need of refilling the SPR given the ongoing geopolitical uncertainties. I do not see it having a choice with the growing tension around the globe. Besides the Russian/Ukraine situation, U.S.-Saudi relations are also at a low point. The recent decision from OPEC+ to cut oil production against the U.S. urge serves as an example in point.
- As such, I fully expect the U.S. to replenish its SPR at a time of both high oil prices and also supply shortages. In 2021, even though U.S. natural gas production set new records, exports set new records too as you can see from the chart below. As a matter of fact, our import currently is at a net negative level as seen from the chart.
Source: EIA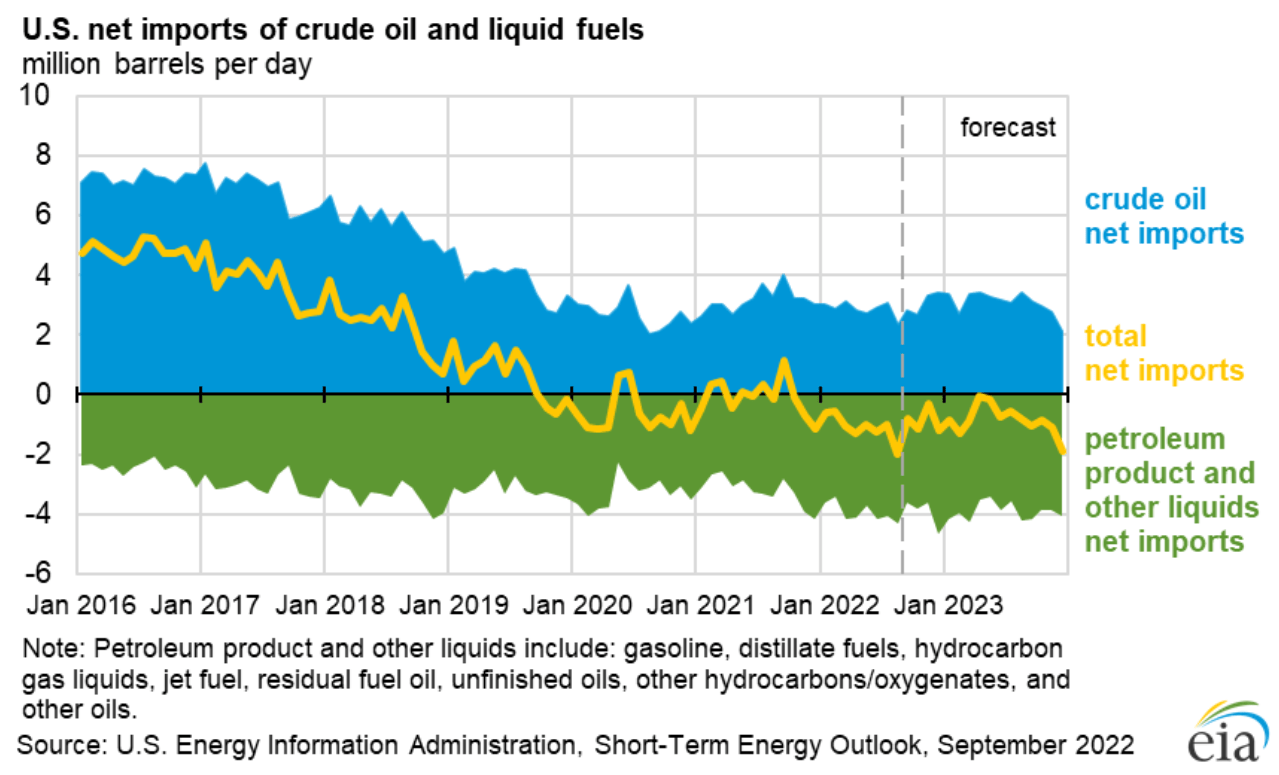
Market consensus estimates
Against this backdrop, let’s examine the market consensus estimates more closely. As shown below, consensus estimates project both XOM and CVX to suffer an EPS decline in the double-digit over the next few years. To wit, XOM is projected to suffer an annual decrease of 10.4% CAGR over the next 5 years, and CVX a 10.6% annual decline.
Source: Author based on Seeking Alpha data. Source: Author based on Seeking Alpha data.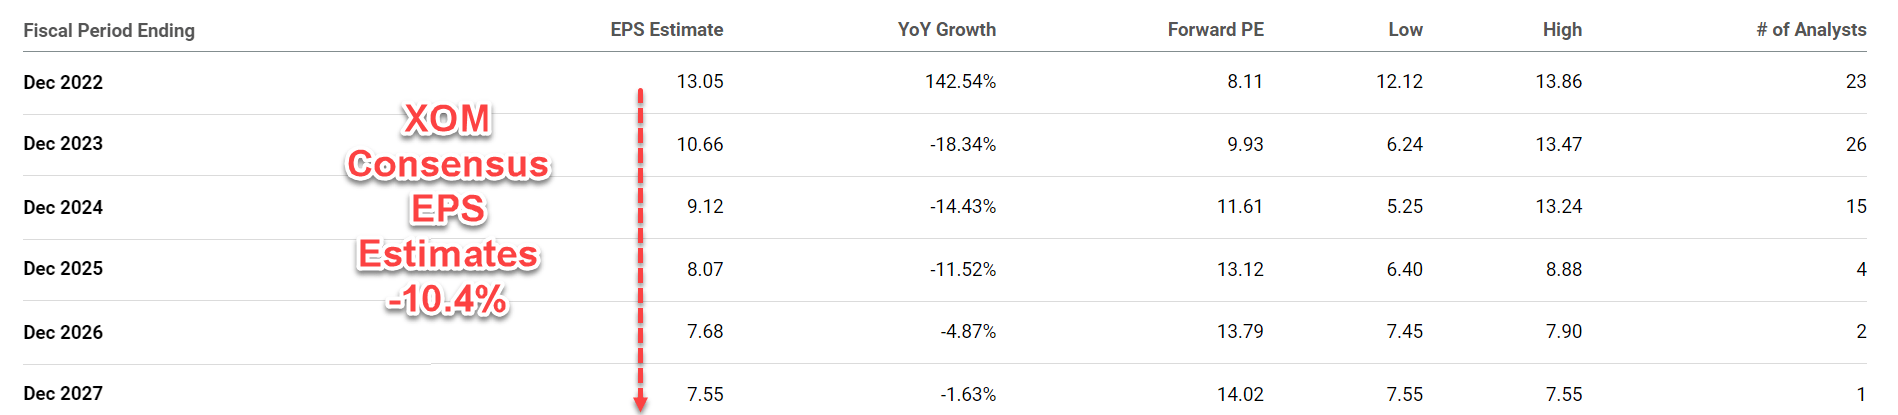
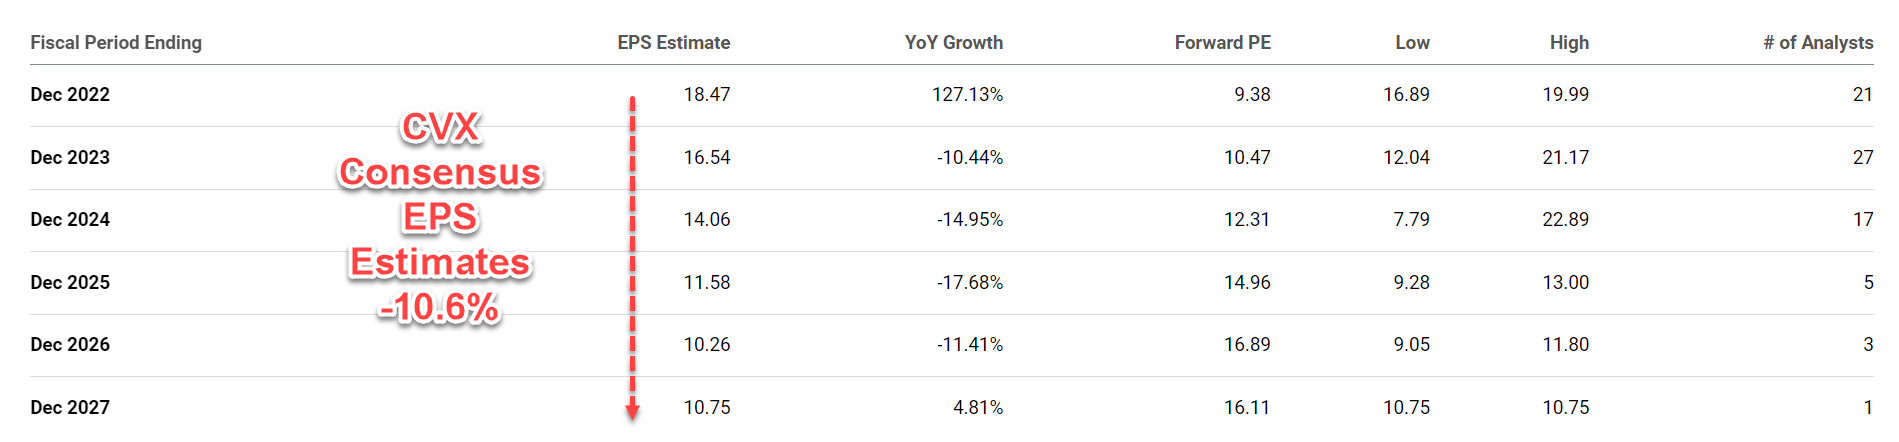
Since EPS equals total profit divided by the number of shares outstanding and total profit equals total revenues time profit margin, an EPS decline as dramatic as those projected in the above consensus estimates implies ALL these profitability drivers go in the wrong direction. More specifically, in my mind, these projections would imply topline shrinkage, margin contraction, and also share dilution (or at least a lack of share buybacks).
And next, let’s examine each and every one of these drivers.
Overall demand, margin, and share repurchases
First, I simply do not see our overall demand for oil and gas declining in the near future. As argued in my earlier article:
Our energy needs will increase substantially in the foreseeable future, and renewables will be at best able to meet the INCREASE in our demand. As seen in the chart below, EIA projects a nearly 50% increase in world energy use by 2050 (i.e., in less than 30 years), and petroleum will still remain the world’s largest energy source by that time. Renewable energy sources, which include solar and wind, will “only” grow to meet the increased demand. Furthermore, there are plenty of other industrial and civilian uses for petroleum besides burning them. They are ubiquitously applied in an incredibly wide range of chemical processes to make things that our daily life rely on.
Source: EIA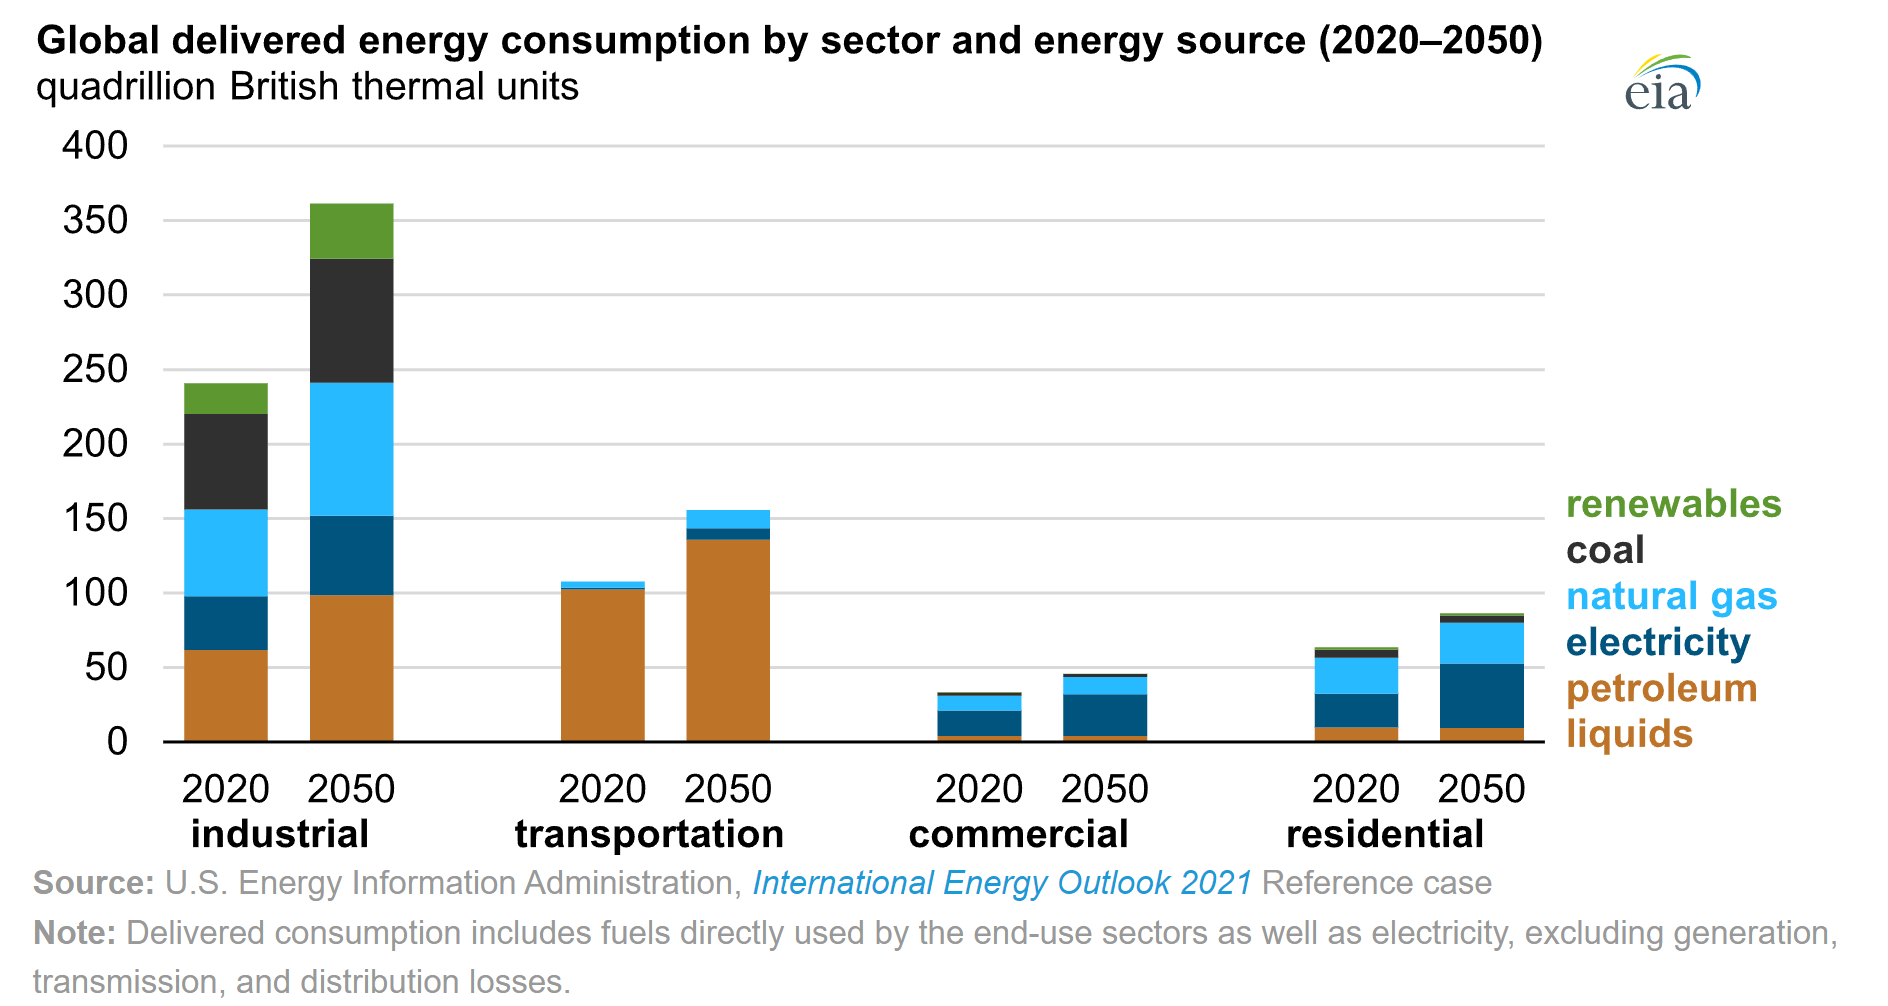
Second, I also do not see the possibility of margin contracting in the next few years either. As aforementioned, I see both oil and gas prices staying at an elevated level given the structural supply-demand imbalance. Take XOM as an example, its break-even oil price is only $41 per barrel in 2021 thanks to its structural cost savings. Oil prices spent also the entire 2022 so far above $80 and a good part of the time above $95. Even with the relatively lower oil prices in 2021, XOM also generated a record amount of cash flow ($48 billion) as shown in its 2021 annual report below. And the picture for CVX is very similar. I won’t be surprised to see both of their cash flows become even stronger for the year 2022 given the higher oil prices, higher gas prices, and also their production boost since 2021.
Source: XOM 2021 annual report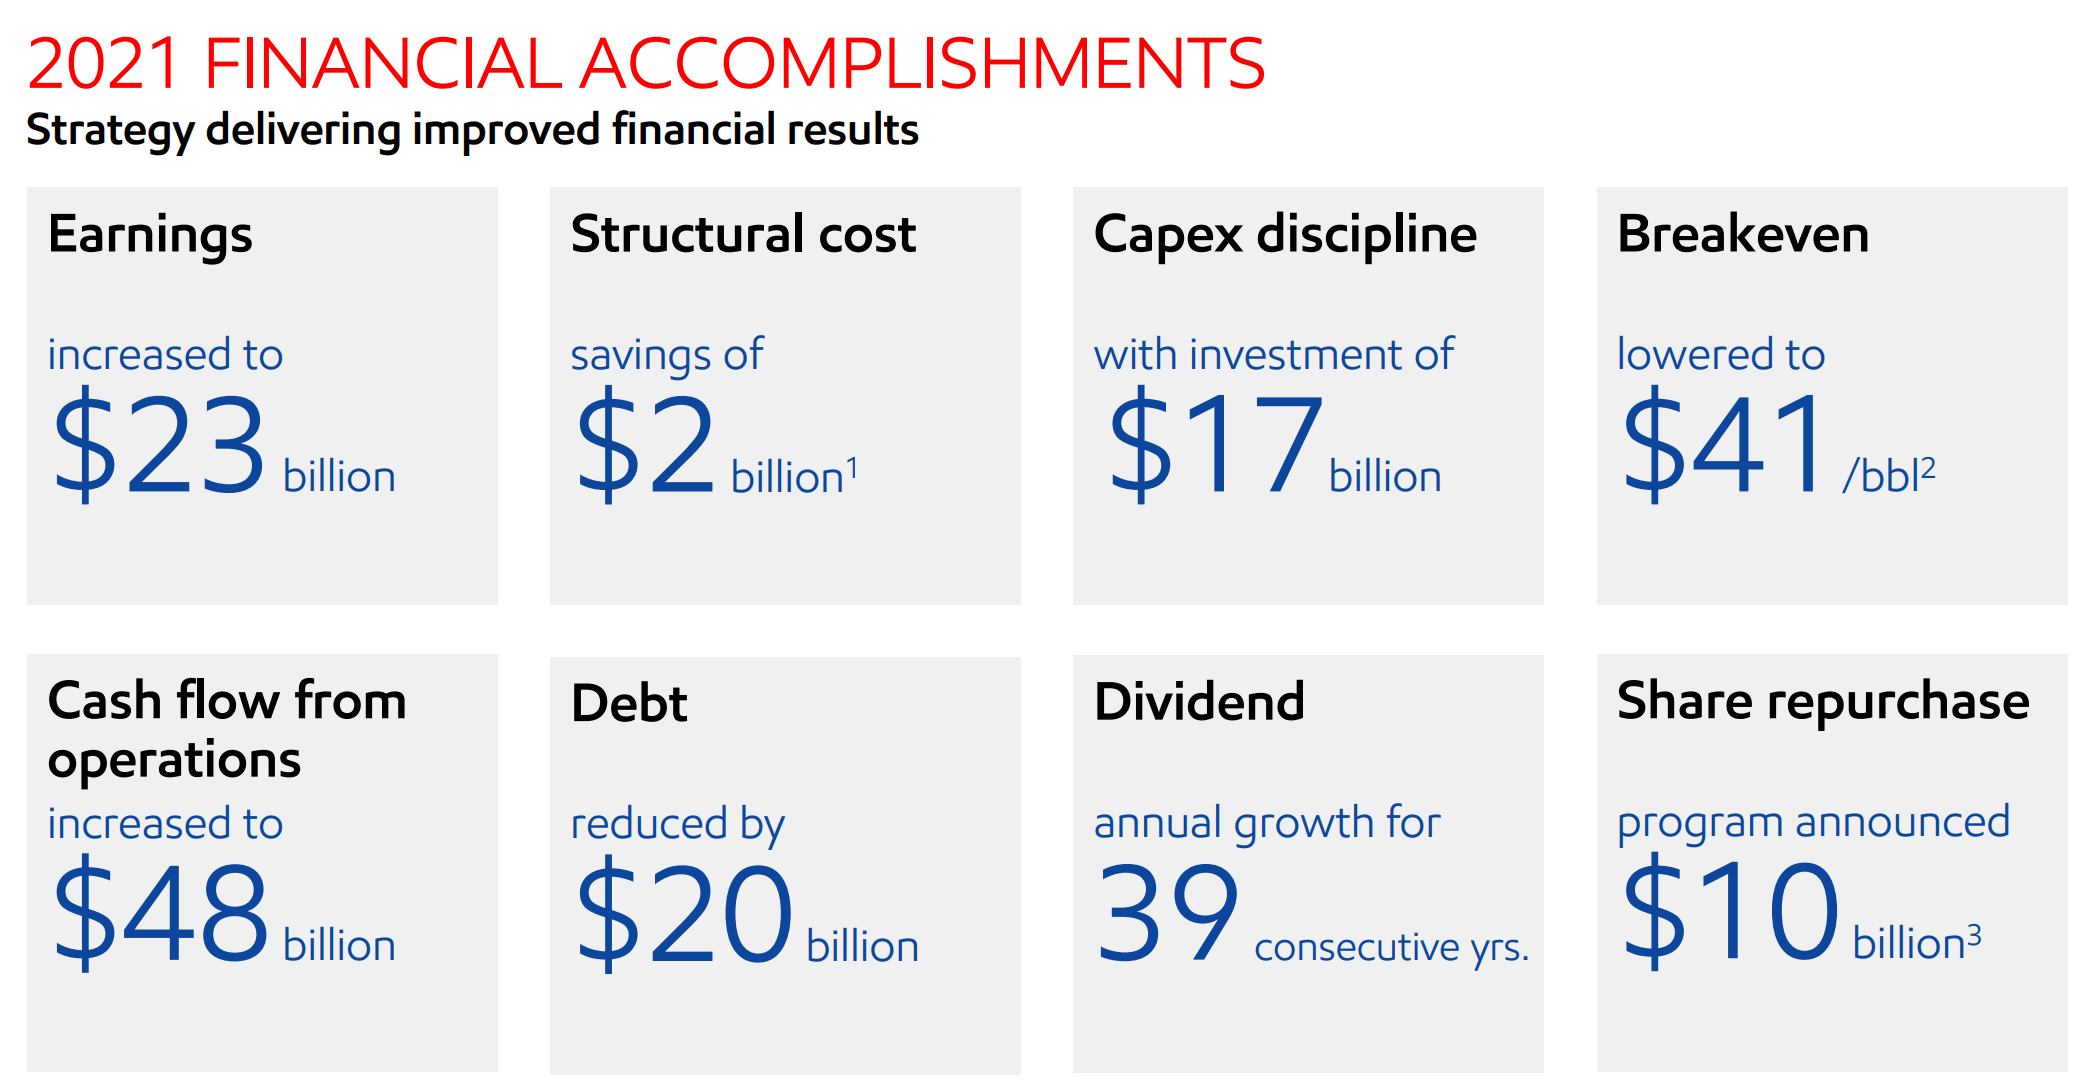
Finally, both businesses are generating robust cash flow that can comfortably cover covering capital investments, debt reduction, dividends, and also share repurchases all at the same time. XOM announced a new $10 billion share repurchase program earlier this year. And CVX has spent $1.3 billion on share repurchases during Q1 of 2022, with another $2.5 billion in buybacks planned in Q2. At XOM’s current market cap of $441B, a $10B share repurchase would reduce its share counts by another 2.2%. And at CVX’s current market cap of $339B, its 2022 1H share repurchases translate into a share counts reduction of 1.13%. The chart below put these numbers into perspective. As seen, both of them have systematically reduced their share accounts in the long term via share repurchases. XOM has been buying buy its shares at an average annual rate of 1.45% in the past decade. And CVX has been buying back its shares at an average annual rate of 0.5%.
With the catalysts mentioned above and the stronger cash flow brought about by these catalysts, I see their share counts shrinking at a more rapid pace than in the past, instead of expanding.
Source: Author based on Seeking Alpha data.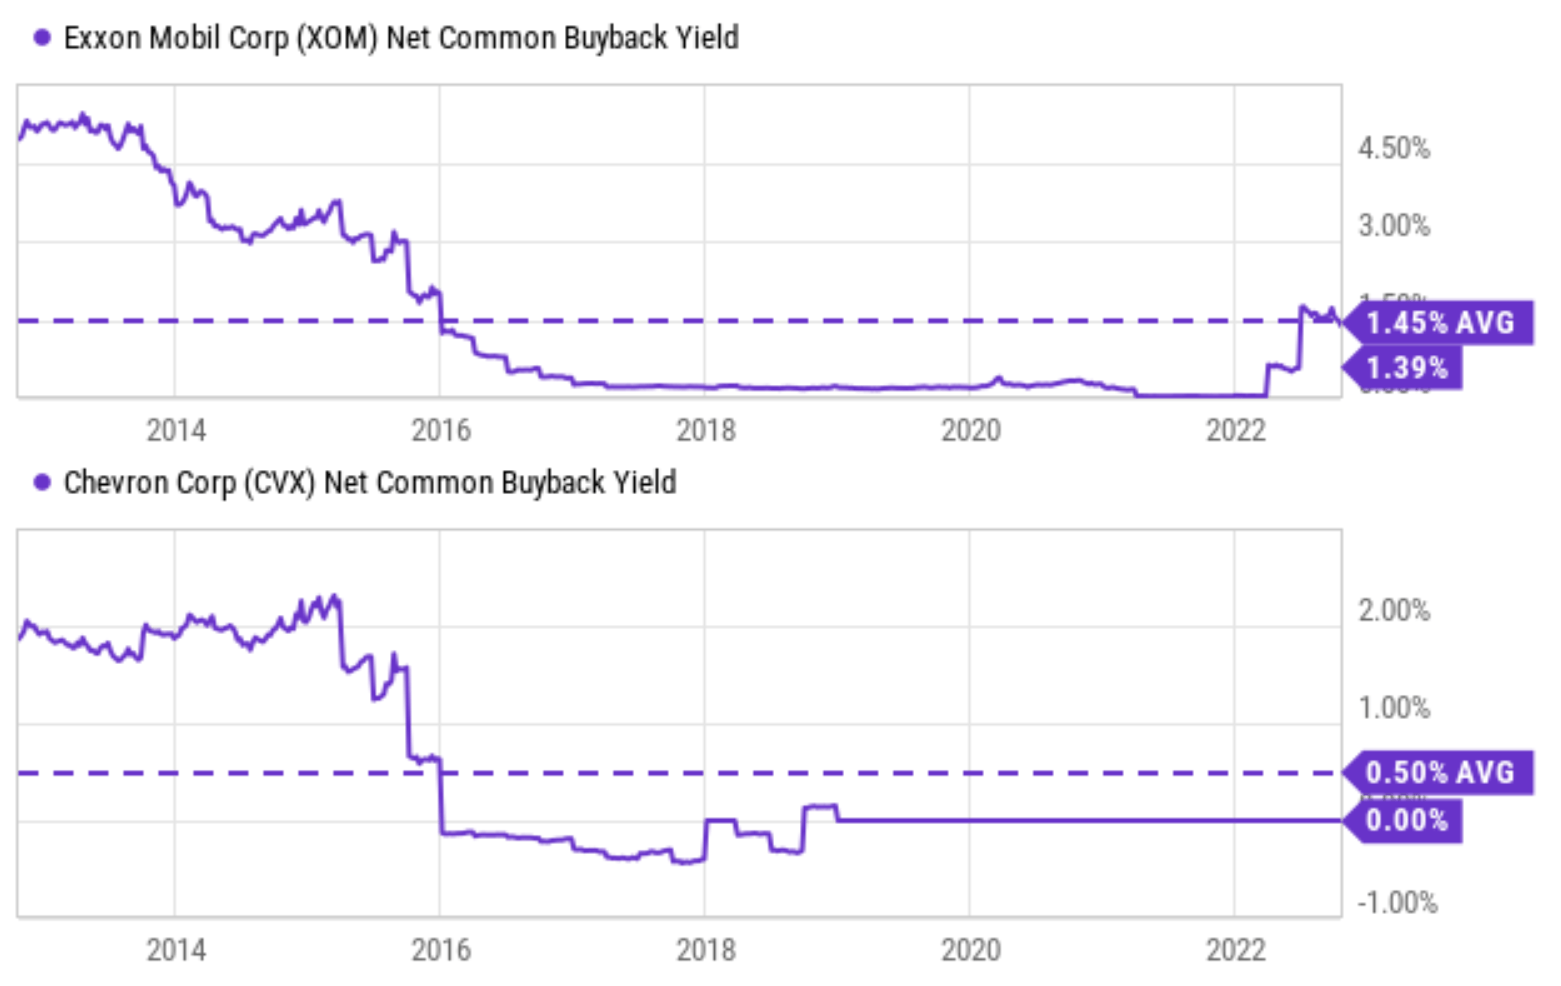
Risks and final thoughts
Although there are certainly risks in the near term. Gasoline and energy prices can usually turn into political issues. For example, I view the Biden administration’s decision to release SPR to curb gas prices partly as a move to ease the pressure of the Democratic midterm elections. Gas prices and inflation are clearly among the top concern of current voters. Also, currently, policy priorities and the Biden Administration are also pushing oil companies to conduct operations with an eye toward reducing carbon emissions. And the call for a windfall tax targeting big oil players such as XOM and CVX resurfaces from time to time.
To conclude, in my view, the market has not learned its lesson about the fight between government policies and energy prices. For example, even recent history has shown the failure of SPR release as a viable solution to the supply-demand imbalance. As a result, I hold the exact opposite view against the market consensus projecting rapidly declining EPS. I see all the drivers pointing to the direction of growing EPS: topline growth, stable margin, and share buybacks as summarized in my return projections below.
To wit, I am projecting: A) at least 3% of total earning growth (which could be accomplished by a $5 oil price increase alone for either one of them); and B) a 1% to 2% share repurchase as discussed above. These two factors would translate into a 4% to 5% EPS growth. Then, as you can also see from the following chart, both stocks are undervalued both in absolute terms (P/cash flow ratios are the single digits) and also in relative terms. Even assuming a valuation reversion to their historical mean in the next 5 years would cause a 3% to 5% annual return. All told, these shares are projected to deliver upper single-digit to double digits annual returns (in the 7% to 10% range). And finally, note that XOM pays a current dividend yield of around 3.33% and CVX 3.23%. And both of them are dividend champions. As a result, about 1/2 to 1/3 of the total return is supported by their very safe current dividends.
Source: Author based on Seeking Alpha data.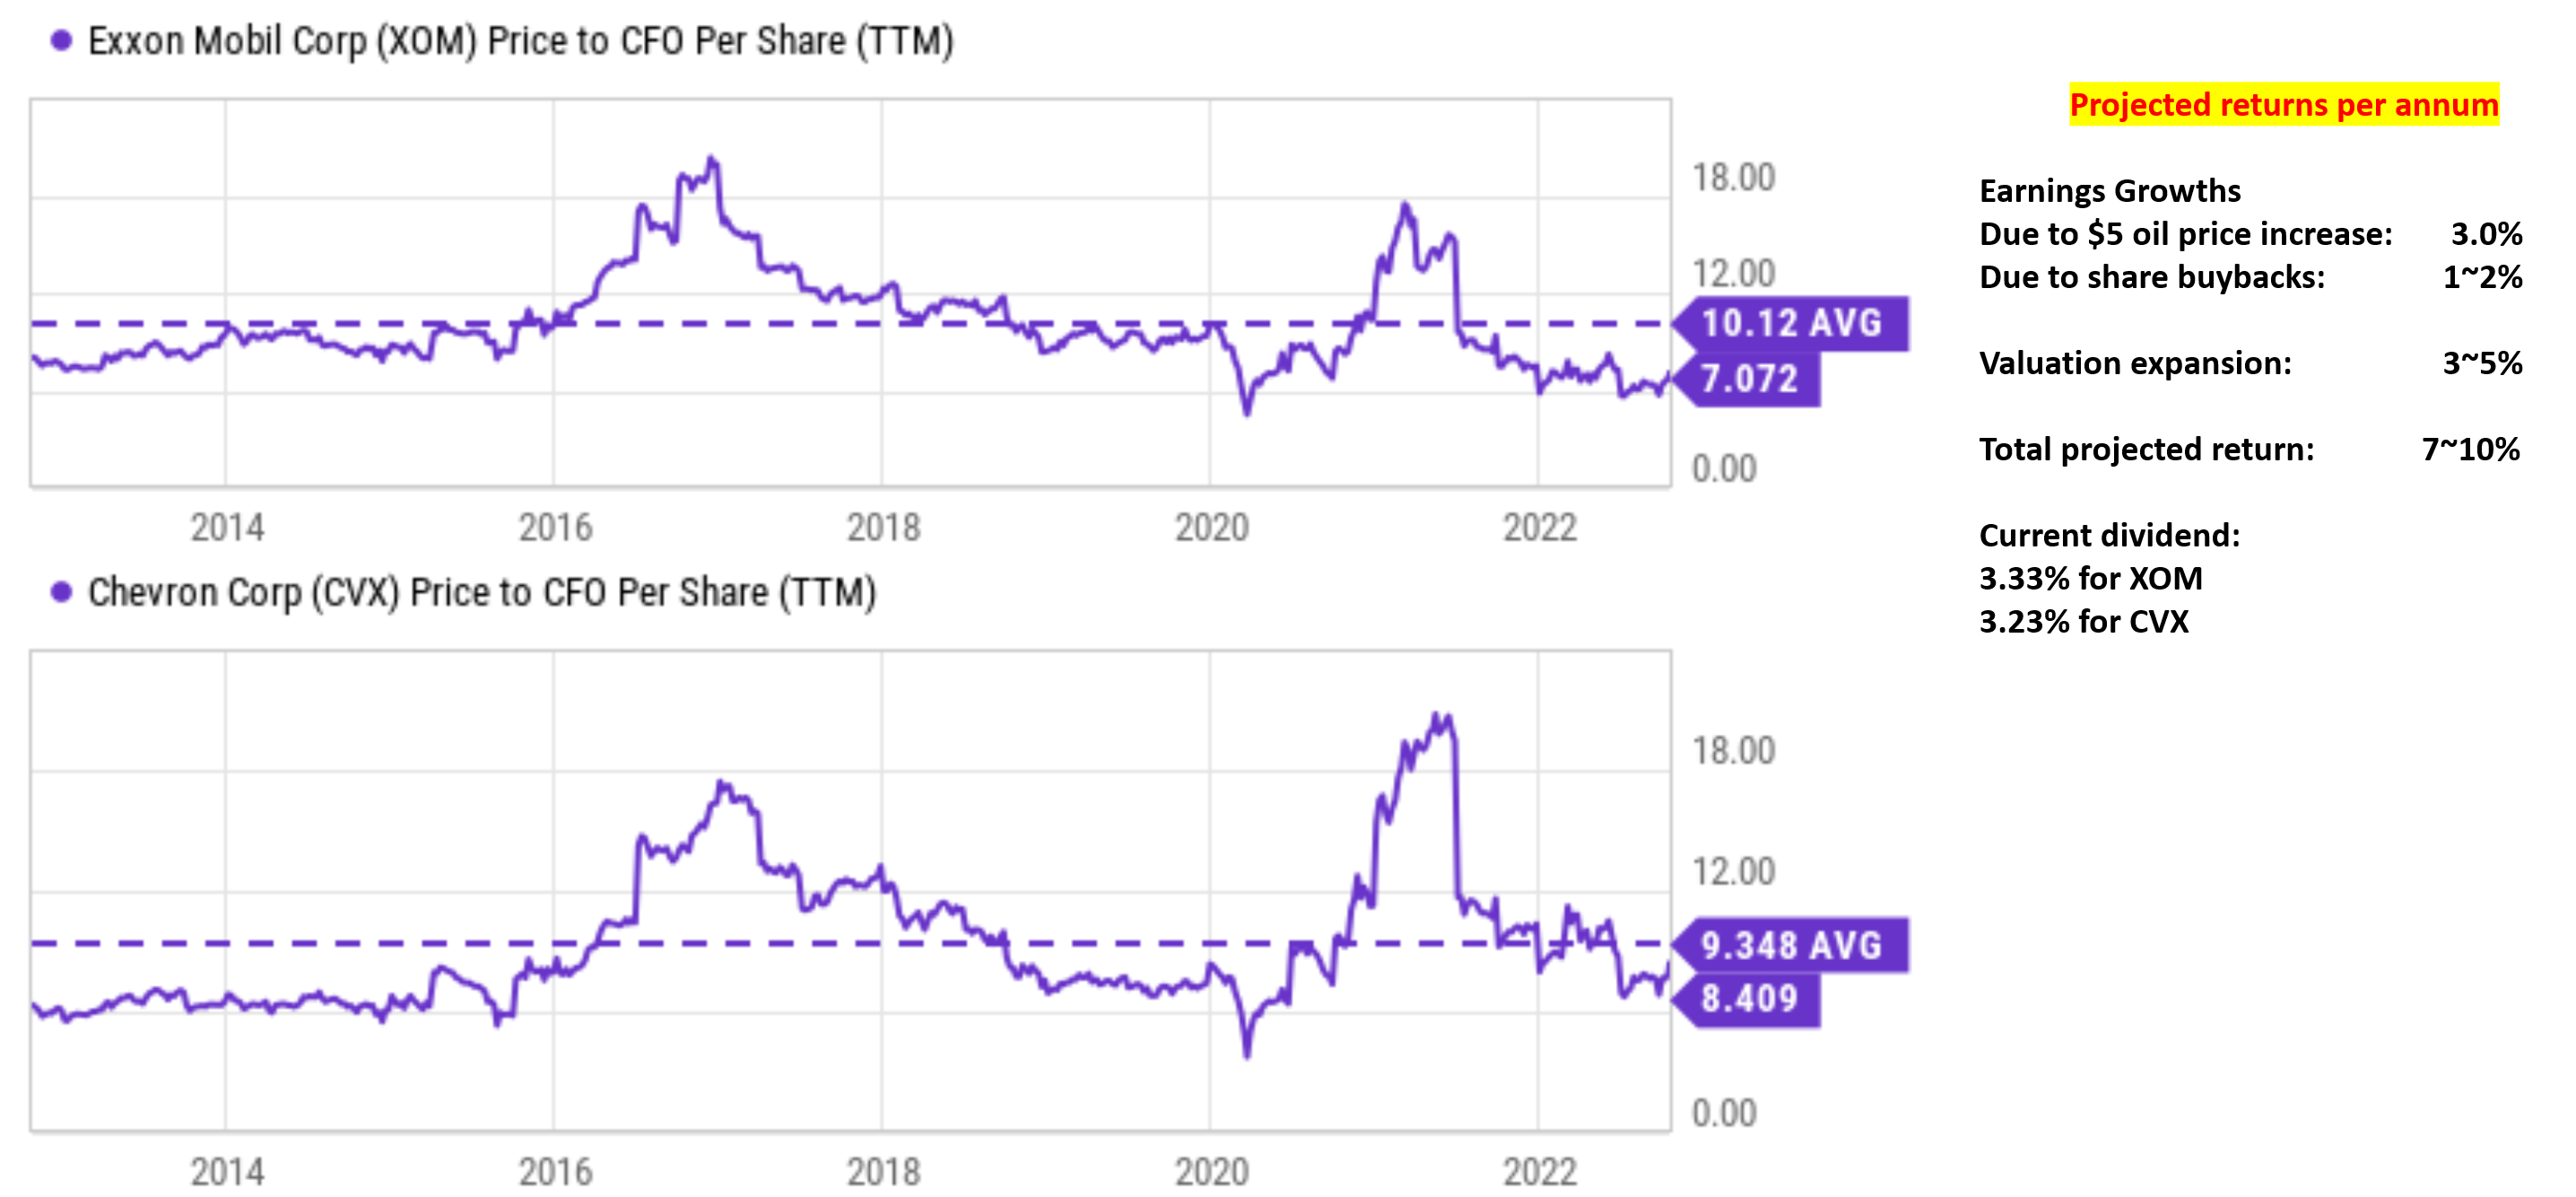
Be the first to comment