

da-kuk
Written by Nick Ackerman, co-produced by Stanford Chemist. This article was originally published to members of the CEF/ETF Income Laboratory on August 18th, 2022.
Eaton Vance Limited Duration Income Fund (NYSE:EVV) remains a fund I am cautious about. The latest annual report shows that coverage has weakened. This is expected as the high current distribution will erode assets over time. That being said, they have a fairly large weighting in senior loan funds. Those should benefit from higher interest rates. However, the exposure doesn’t seem significant enough as it has shown only a marginal impact.
The fund’s discount is quite shallow. It has contracted a fairly large amount on a relative basis since our last update. That makes it an even more cautious choice now than it did then. For what it’s worth, despite my continued hesitation, the fund did put up positive total returns since that last update.
EVV Performance (Eaton Vance)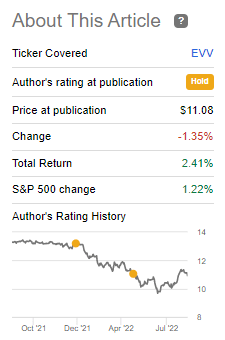
Note that it was simply on a total share price return basis. On a total NAV return basis, the returns were negative. The difference here is accounted for by the discount contraction alone to have pushed the fund into positive return territory.
YCharts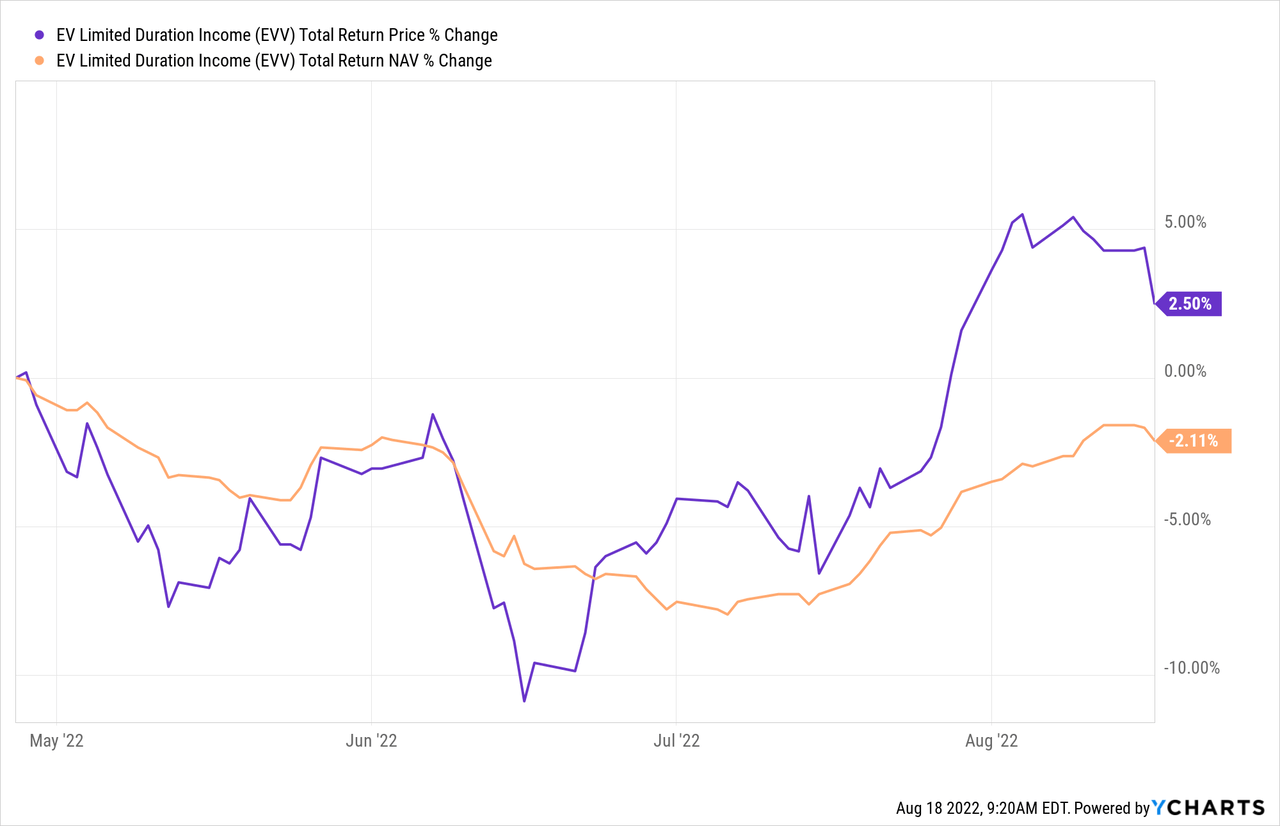
That’s precisely what we look to exploit in the closed-end fund space. These discounts and premiums can largely drive one’s individual results with CEFs on top of the attractive distribution yields. You buy and sell at the market price, and it can remain irrationally elevated or depressed for significant periods of time. However, at the end of the day, the actual underlying performance eventually has an impact on the fund.
For EVV, the chances of discount widening are a headwind. Because the fund is overdistributing, any cut could spark that discount widening. This all sets the fund up for a cautious outlook.
The Basics
- 1-Year Z-score: 0.19
- Discount: 3.10%
- Distribution Yield: 10.78%
- Expense Ratio: 1.24%
- Leverage: 37.62%
- Managed Assets: $2.11 billion
- Structure: Perpetual
EVV’s investment objective “is to provide a high level of current income. The Fund may, as a secondary objective, also seek capital appreciation to the extent consistent with its primary goal of high current income.”
To achieve this, they take a multi-sector bond fund approach. They are invested in a diverse asset mix of credit instruments, though the largest contributors are senior loans and non-investment grade bonds.
Junk bonds and senior loans are less interest-rate-sensitive than other credit instruments. Senior loans often have floating rates tied to LIBOR, though LIBOR is going away. Junk bonds typically have higher yields and shorter maturities, which leads to a lower duration. Leverage-adjusted duration for EVV comes to 4.3 years. That was an increase from the 3.5 years at the end of 2021.
The fund utilizes leverage in two forms; there are traditional borrowings, and then they also have auction preferred shares (APS). Both of these are tied to floating rates. As interest rates rise, this will offset some of the additional income we see from their underlying floating rate debt holdings.
The average interest rate for the borrowings was 1.03% through the latest fiscal year. However, the ending interest rate was 1.25%. Fiscal year-end was March 31st, meaning we already saw higher interest rates starting to impact the fund.
The auction preferred shares dividends are heading higher relatively fast from the averages they were paying.
EVV APS (Eaton Vance)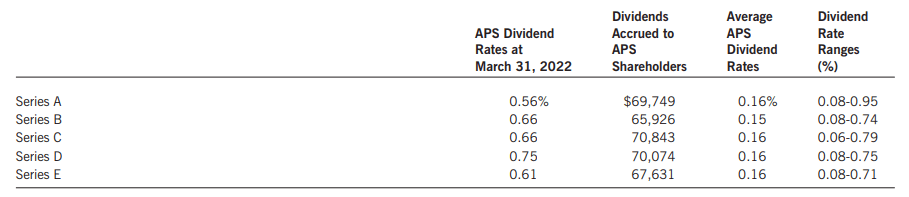
All this being said, they have some future contracts where there are various derivates employed. Some of the more notable positions are short positions in U.S. notes and bonds. Those would act as a hedge. If interest rates rise, the value of these positions should appreciate, offsetting some of the losses generated through higher rates. These accounted for ~$1.920 in realized gains. That helped to offset some of the nearly $14 million in realized losses due to investment transactions.
The high amount of leverage here means the fund should be relatively more volatile. When including the leverage expenses, the expense ratio comes to 1.77%. This was as high as 1.82% in fiscal 2019. That would reflect the higher interest rates we saw through that period of time.
EVV Expense Ratios (Eaton Vance)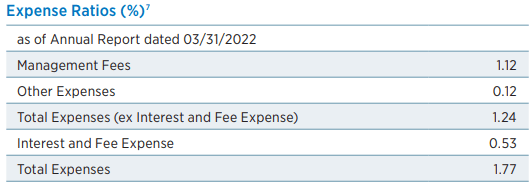
Performance – Discount Too Narrow
Over the years, EVV’s returns weren’t anything too spectacular. One of the reasons for this is that they are a multi-sector bond fund but holds a sizeable allocation in senior loans. Those haven’t had meaningful yields in about the last decade as interest rates have been essentially zero for most of that period. I’m willing to forgive poor past results as that’s only looking in the rearview mirror.
EVV Annualized Performance (Eaton Vance)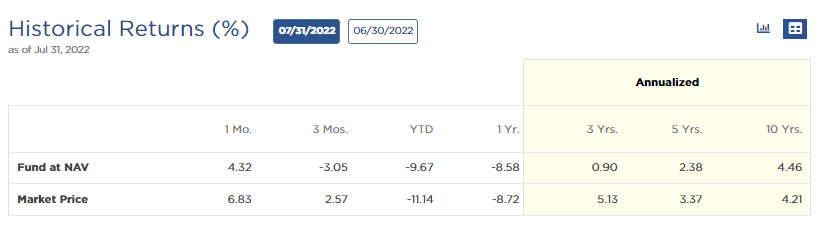
Going forward, returns could improve if rates stay higher through this cycle. However, challenging that outcome will be the fund’s continued erosion of underlying assets and the fund’s unappealing discount at this time.
YCharts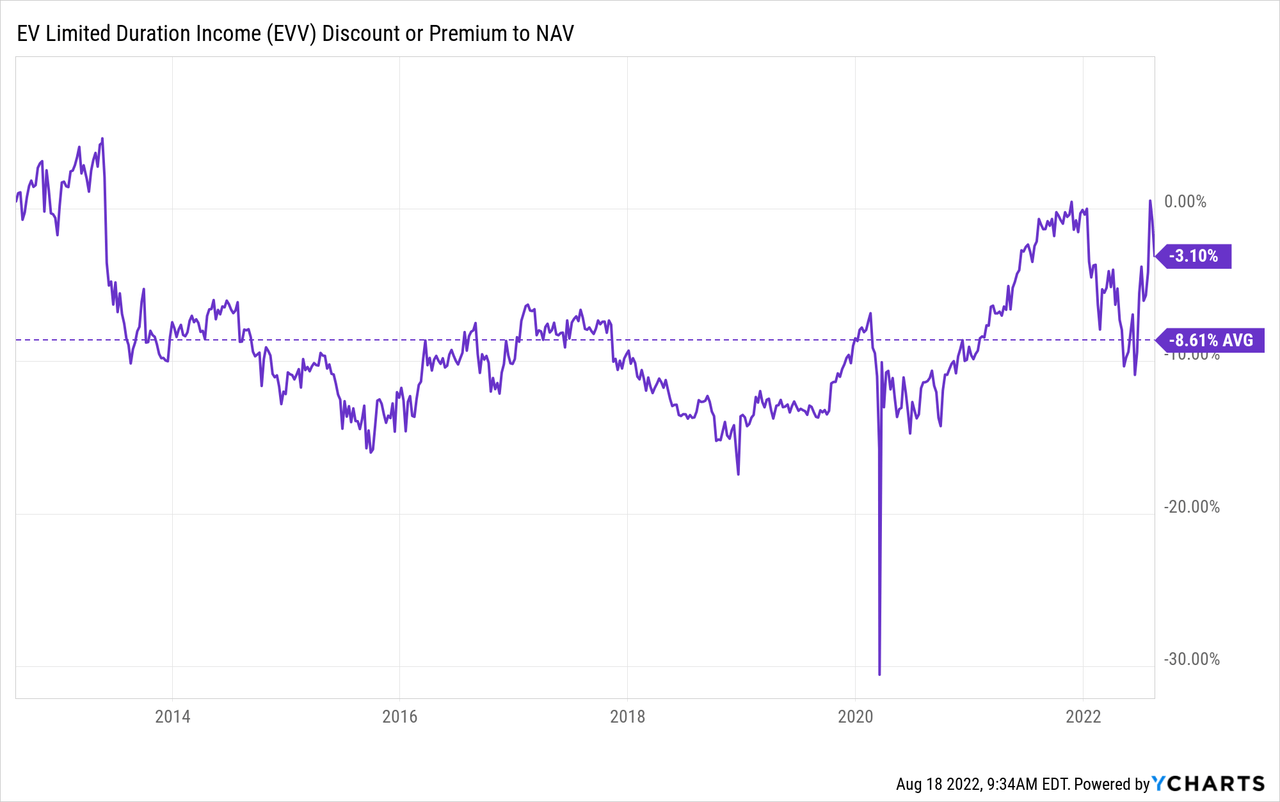
Traditionally, CEFs have experienced mean reversion in terms of returning to their traditional discount levels. With anticipated higher rates, investors may see the future as brighter for EVV. As I said, I certainly agree with that point.
That being said, I believe that the most alluring part of the fund is the double-digit distribution yield that it is paying to investors. I believe that has had the biggest impact on the fund’s narrowing discount recently. With the payout at an unsustainable level, it could only be a matter of time before a cut could send the shares tumbling lower.
Distribution – Pressures Remain
In a previous article, we touched on why EVV might have been compelled to boost their distributions so significantly in the first place. They had some pressure from activist investor Saba and SIT Investment Associates. I believe that is how we got into the current situation with EVV. The fund’s current distribution works out to 10.78%, with a NAV rate of 10.59%.
EVV Distribution History (Eaton Vance)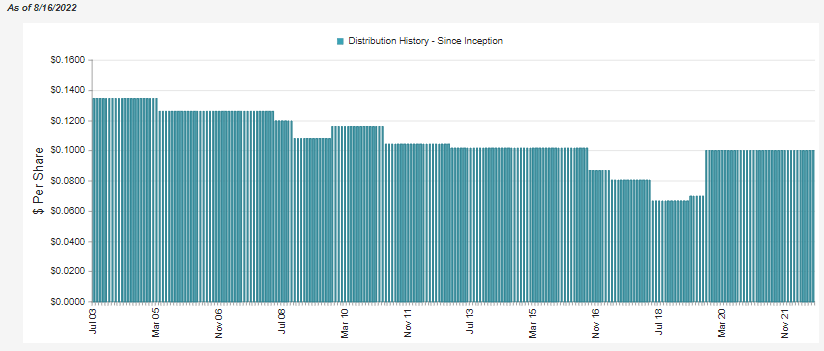
The latest annual report shows that distribution coverage had fallen. However, the latest UNII (undistributed net investment income) report shows that net investment income coverage has been about flat since our last update. We’ll discuss why these two coverage figures seem to diverge.
In the last fiscal year, net investment income fell 15.31%. The total distributions paid to shareholders went from $139,376,422 to $139,400,369. The reason for the small increase was due to the reinvestment of distributions creating new shares. That’s a positive when it is done at a premium. Shares outstanding climbed a bit to 116,203,460 from 116,147,018.
EVV Annual Report (Eaton Vance)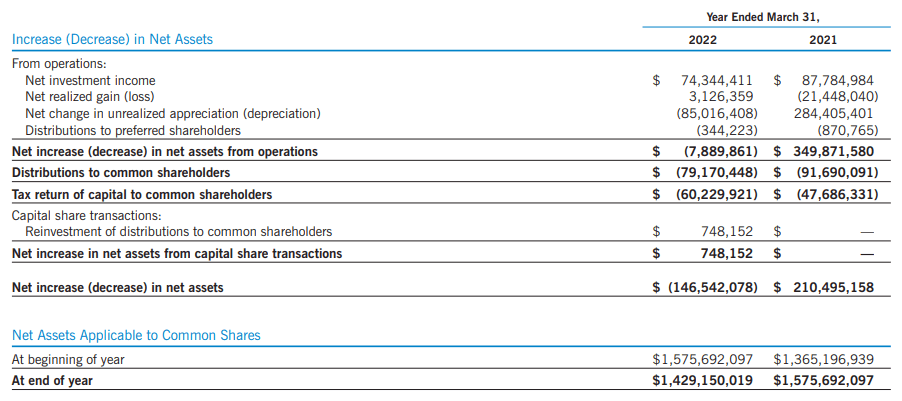
On a per share basis, the fund’s NII came in at $0.64 from the $0.756 in the prior fiscal year. That’s against the $1.20 distributions the fund had paid in each of the prior two years.
The reason for the decline in NII was the fund generated less total investment income. They had $101.642 million in the latest fiscal year. Last year, the fund generated $117.082 million. I believe the reduction here could be attributed to not only portfolio positioning but erosion of assets from overdistribution.
Looking at the latest UNII report, we can see that the average NII per share came in at $0.0548. That was a small increase from the $0.0542 and 54.2% coverage the fund had shown previously.
EVV UNII Report (Eaton Vance)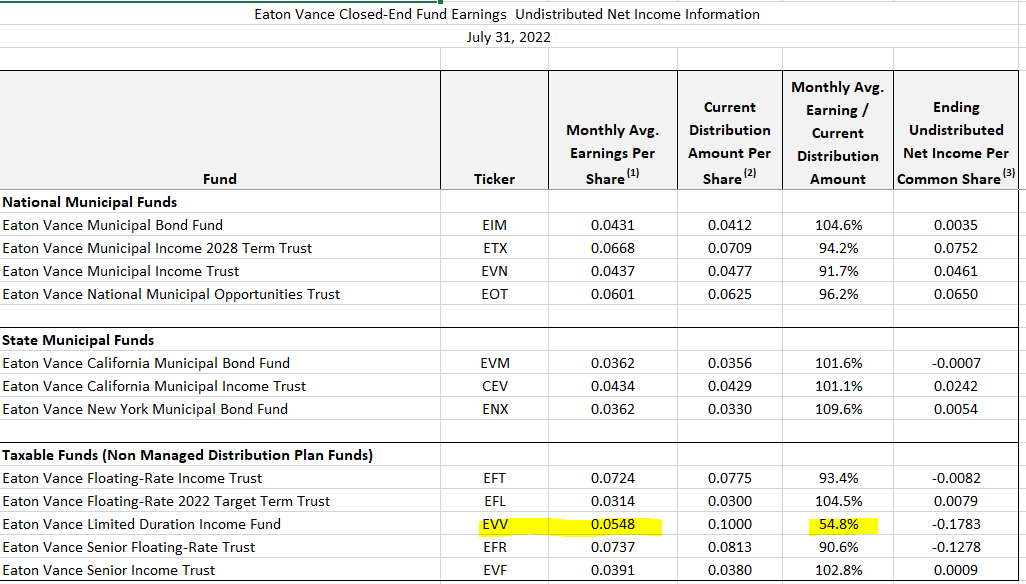
The average NII reported here is based on the three months prior. Our previous article looked at the figure through the end of February 28th, 2022. Shortly after looking at the coverage, the Fed began raising its target interest rate.
That’s important because it shows that the senior loan exposure, which is largely floating rate, is having somewhat of an impact. Unfortunately, it is only minimal. I’m not confident it can be enough to offset the erosion of assets and higher interest expenses we’ve already seen happening.
EVV’s Portfolio
As mentioned above, the largest exposure in the fund is to senior loans. This is then followed by high yield. Interestingly, they pair these types of investments with U.S. Government/Agency MBS and investment-grade corporate bonds.
EVV Asset Mix (Eaton Vance)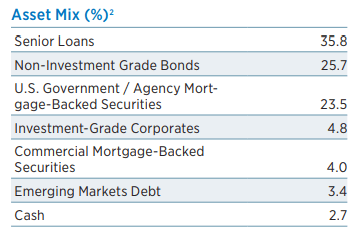
That makes the fund relatively safer compared to the suite of PIMCO funds. Those funds are largely multi-sector bond funds but delve mostly into below-investment-grade and riskier offerings across the board.
That being said, the largest weighting is still tilted towards B and BB holdings. During any type of economic slowdown, the fund is still subject to higher risks due to the chance of defaults being higher.
EVV Credit Quality (Eaton Vance)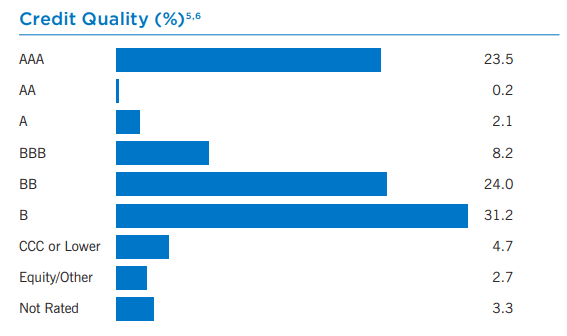
That higher exposure to AAA quality is partly to blame for the reason for lack of coverage. The fund’s NII percentage comes to 4.83%. Despite the leverage added on top of that, it’s a far cry from the 10.59% the fund has to earn in order to cover the distribution.
A sampling of these positions can be seen in the last annual report. Here are the holdings in the government’s national mortgage association (Ginnie Mae.) What we see below are rates that are anywhere from 3 to 9%. Now, those 9% yielders are certainly attractive. However, it is only a small portion of the $266.4 million in total Ginnie Mae holdings. The bulk comes in at 3 or 3.5% yields.
EVV’s Ginnie Mae Holdings (Eaton Vance)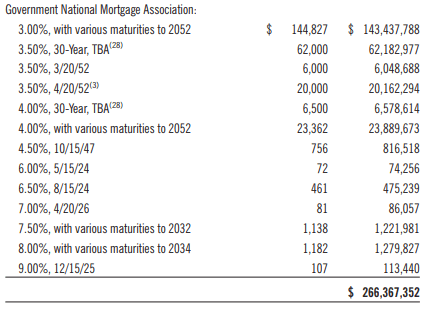
Conclusion
The outlook for EVV remains a cautious one for current shareholders. The fund is an attractive multi-sector bond fund. The fund is mostly split between floating rate securities and high yield. However, it also includes a sizeable allocation to investment-grade holdings. That helps make it a somewhat safer bond fund that could be worth considering in other circumstances. The overdistribution that leads to a further lack of distribution coverage makes it unattractive for me. It could still be a worthwhile fund, but not at the current discount. That is also even considering the overall fixed-income and market declines pushing the fund lower.
Be the first to comment