

slovegrove
It’s been a rough year thus far for the Australian Gold Miners, with the index significantly underperforming the major market averages, down nearly 35% year-to-date. This can be attributed to a challenging operating environment in the country, with the group dealing with labor tightness, COVID-19-related exclusions, and inflationary pressures. Evolution Mining (OTCPK:CAHPF) is one name that’s been hit hard, down over 60% from its highs and now trading at a deep discount to its net asset value. With the stock having a better year ahead and heading towards a major support level at A$1.65 [US$1.15], further weakness should present a buying opportunity.
Unless otherwise noted, all figures are in Australian Dollars ($A), and all exchange rates are based on $0.70 AUD/USD. Evolution Mining trades significant volume daily on the Australian Stock Exchange (EVN.ASX) but trades very limited volume on the OTC Market. Therefore, the preferred way to trade the stock is on the Australian Stock Exchange. There is a significant risk to buying on the OTC due to wide bid/ask spreads, low liquidity, and no guarantee of future liquidity.
Red Lake Operations (Company Presentation)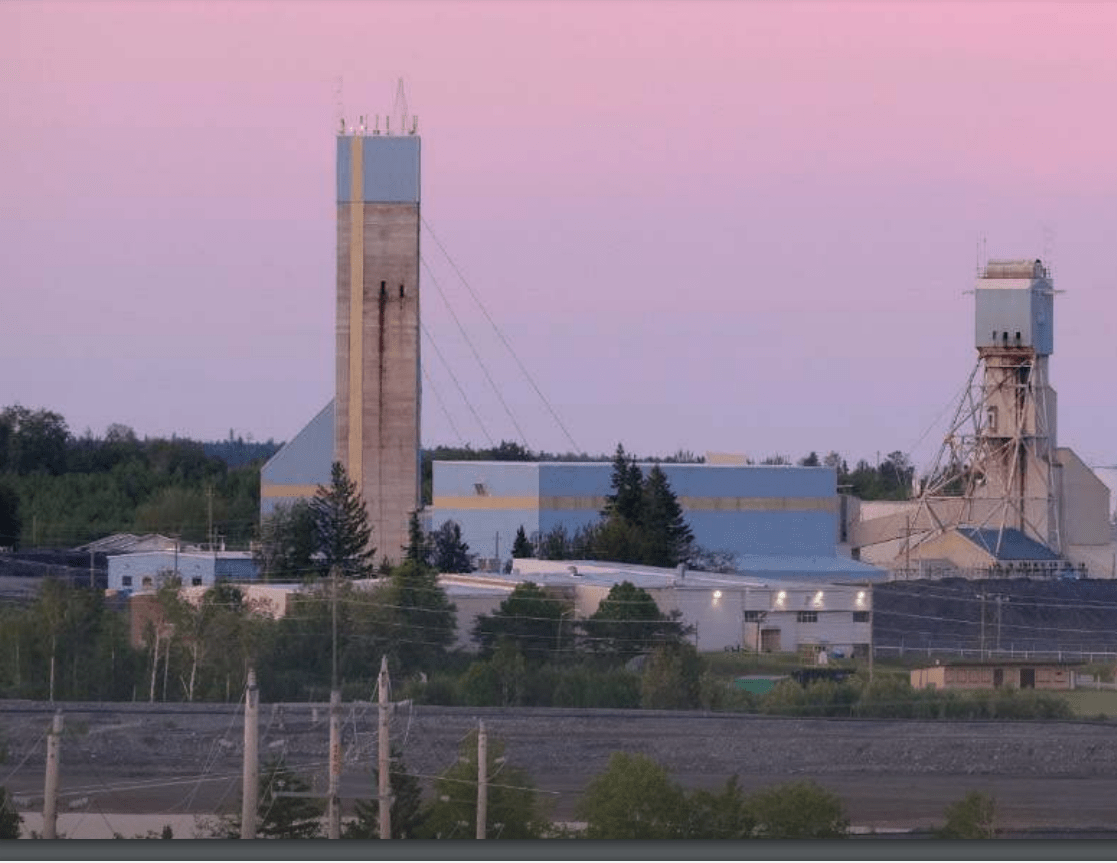
FY2022 Results
Evolution Mining released its fiscal Q4 and FY2022 results last month, reporting quarterly gold production of ~172,700 ounces and ~640,300 ounces, respectively. If we look at the quarterly trend below, this was a significant decline in production on a two-year basis (fiscal Q4 2020: ~218,100 ounces), but it’s important to note that there were multiple changes to the portfolio in the period. From a headwind to production standpoint, the company sold Cracow in June 2020 and Mt. Carlton in October 2021. The partial offset was the acquisition of the remainder of Ernest Henry (though this mostly benefited by-product credits) and the consolidation of Mungari, which did boost gold production.
Evolution Mining – Quarterly Gold Production (Company Filings, Author’s Chart)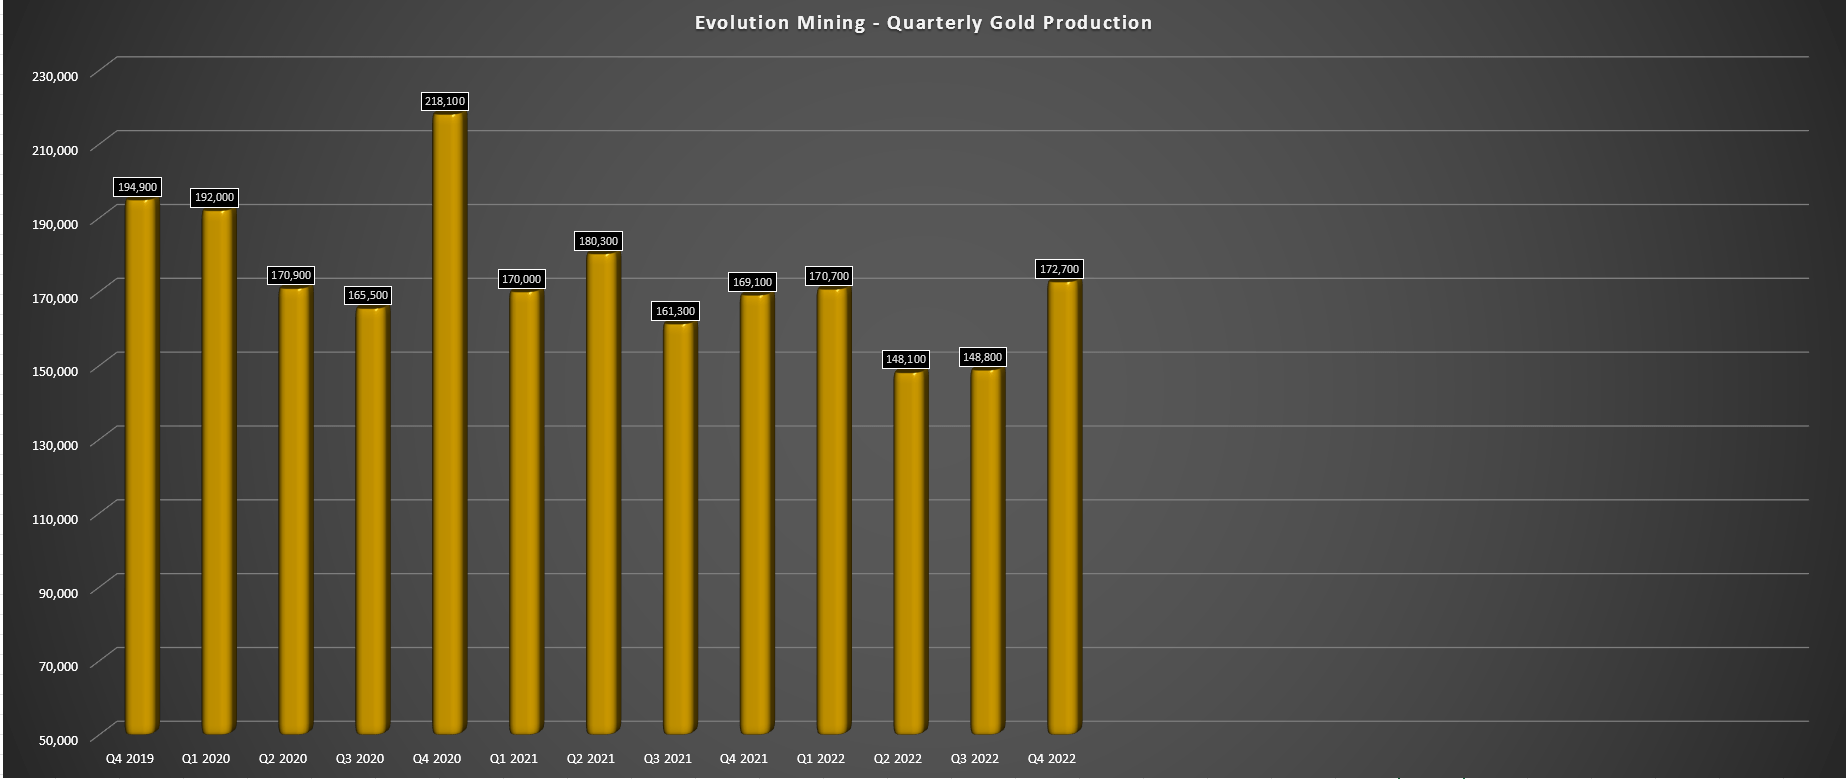
Unfortunately, while these acquisitions helped to partially offset the lower production from the two divestments and improve costs, Evolution came up miles short on its FY2022 guidance. This was evidenced by the company reporting FY2022 gold production 8% below its guidance mid-point at the time of the Ernest Henry deal (697,500 ounces) and its FY2023 guidance dropping 10% to ~720,000 ounces vs. 802,500 ounces previously. Finally, the company’s FY2024 outlook was revised lower, down from 885,000 ounces to ~800,000 ounces. The result is a significantly extended timeline for the path to the elusive million-ounce production mark.
Evolution Mining – Previous Guidance vs. Actual Performance & Updated Guidance (Company Filings, Author’s Chart)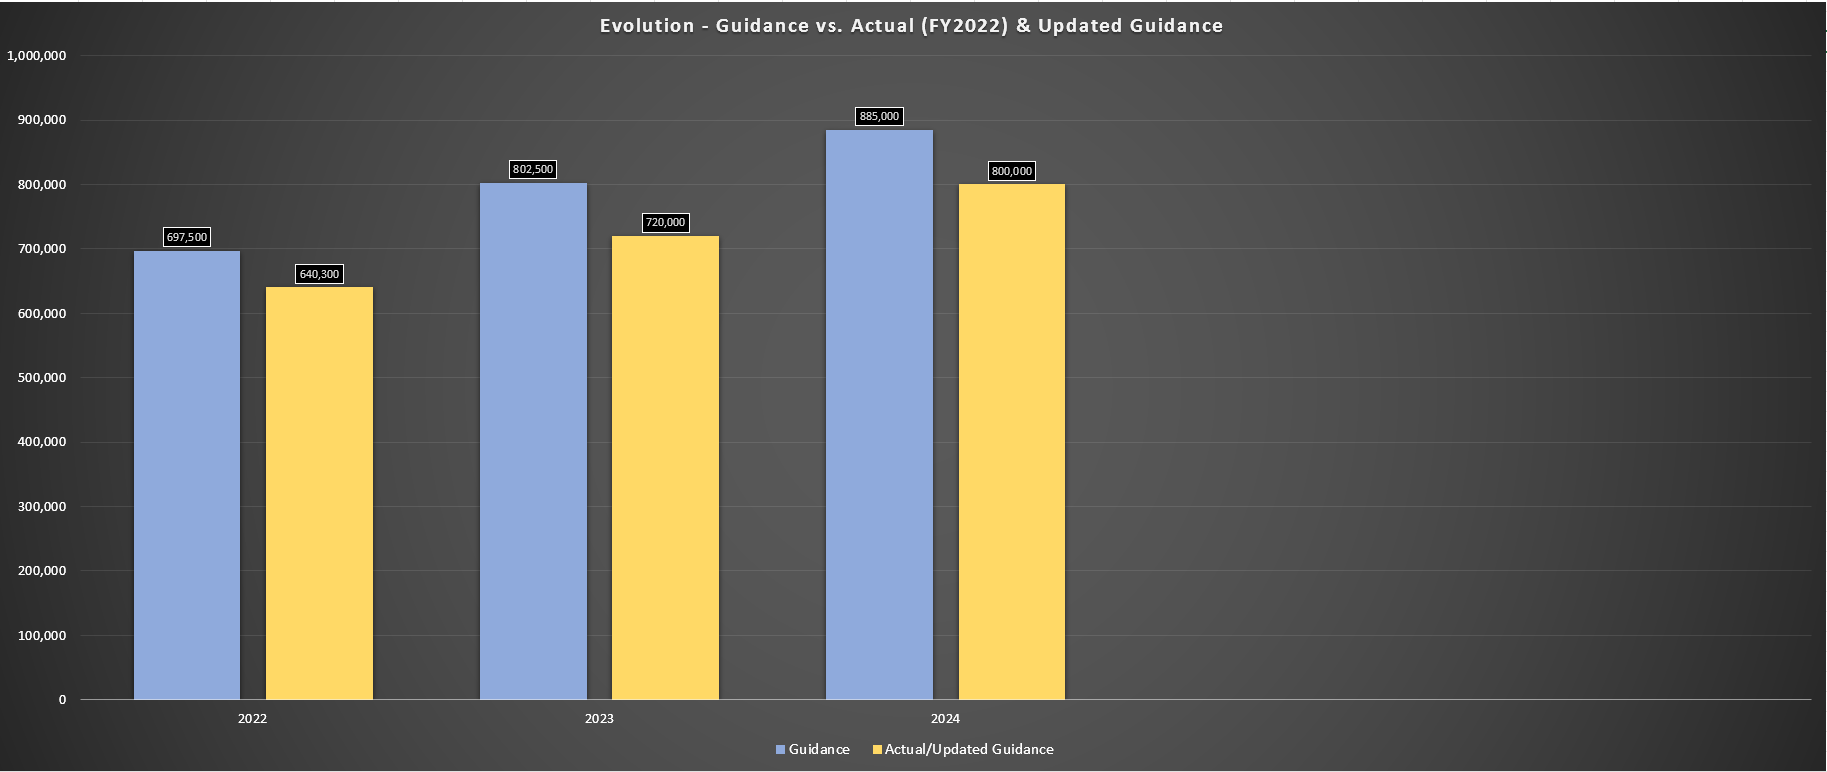
Meanwhile, from a cost standpoint, Evolution also came up short, reporting all-in-sustaining costs of A$1,259/oz, well above the FY2022 guidance mid-point of A$1,165/oz. Although this was a significant miss, the company was hardly alone in this department, with the sector as a whole underestimating the magnitude of inflationary pressures, evidenced by several producers having to revise cost guidance higher.
It’s also worth noting that Evolution dealt with further headwinds with most of its operations in Western Australia. This was due to the very tight labor market, having ~140,000 jobs in the resource sector in Western Australia and booming commodity prices in some cases (lithium, copper, nickel), with only ~120,000 people to fill them – placing further pressure on costs to secure workers and contractors.
Evolution – Annual Production, Forward Guidance & All-in Sustaining Costs (Company Filings, Author’s Chart)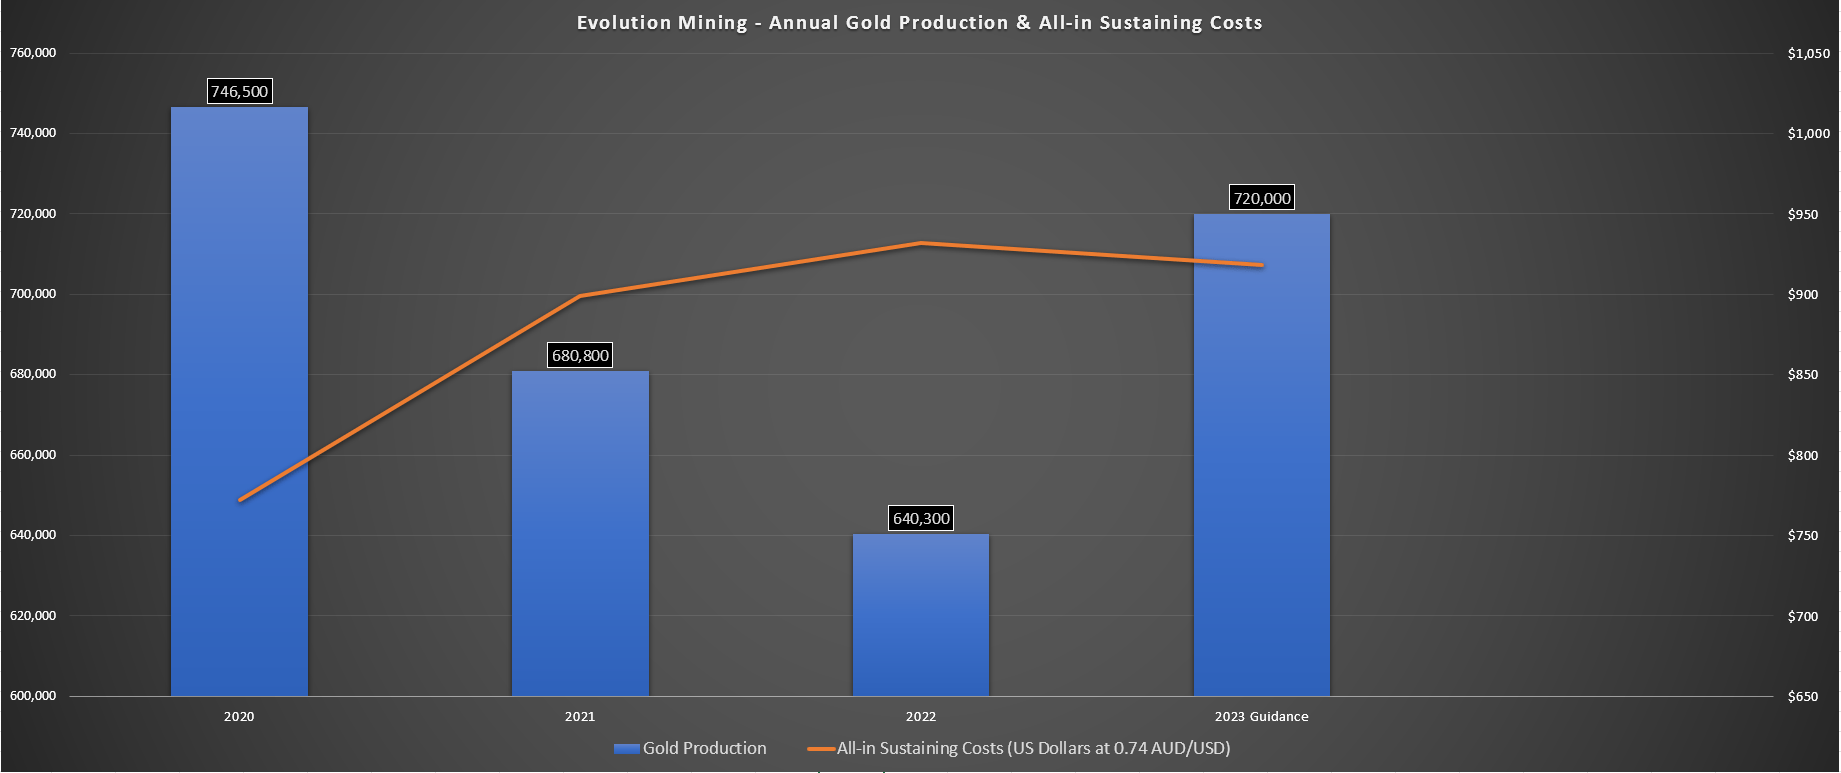
Fortunately, while FY2023 production is expected to come in well below previous estimates (November 2021), Evolution finished FY2022 on a high note, it is seeing productivity improvements at Red Lake, and it’s expecting to have a much better year in FY2023. Based on current guidance, Evolution expects 720,000 ounces of gold production at very respectable costs of A$1,240 [US$870/oz], which, if achieved, would be well below the estimated industry average of US$1,245/oz. So, even assuming a lower gold price of US$1,650/oz if this weakness persists, Evolution should enjoy 45%+ AISC margins this year.
US Dollar vs. Canadian Dollar (TC2000.com)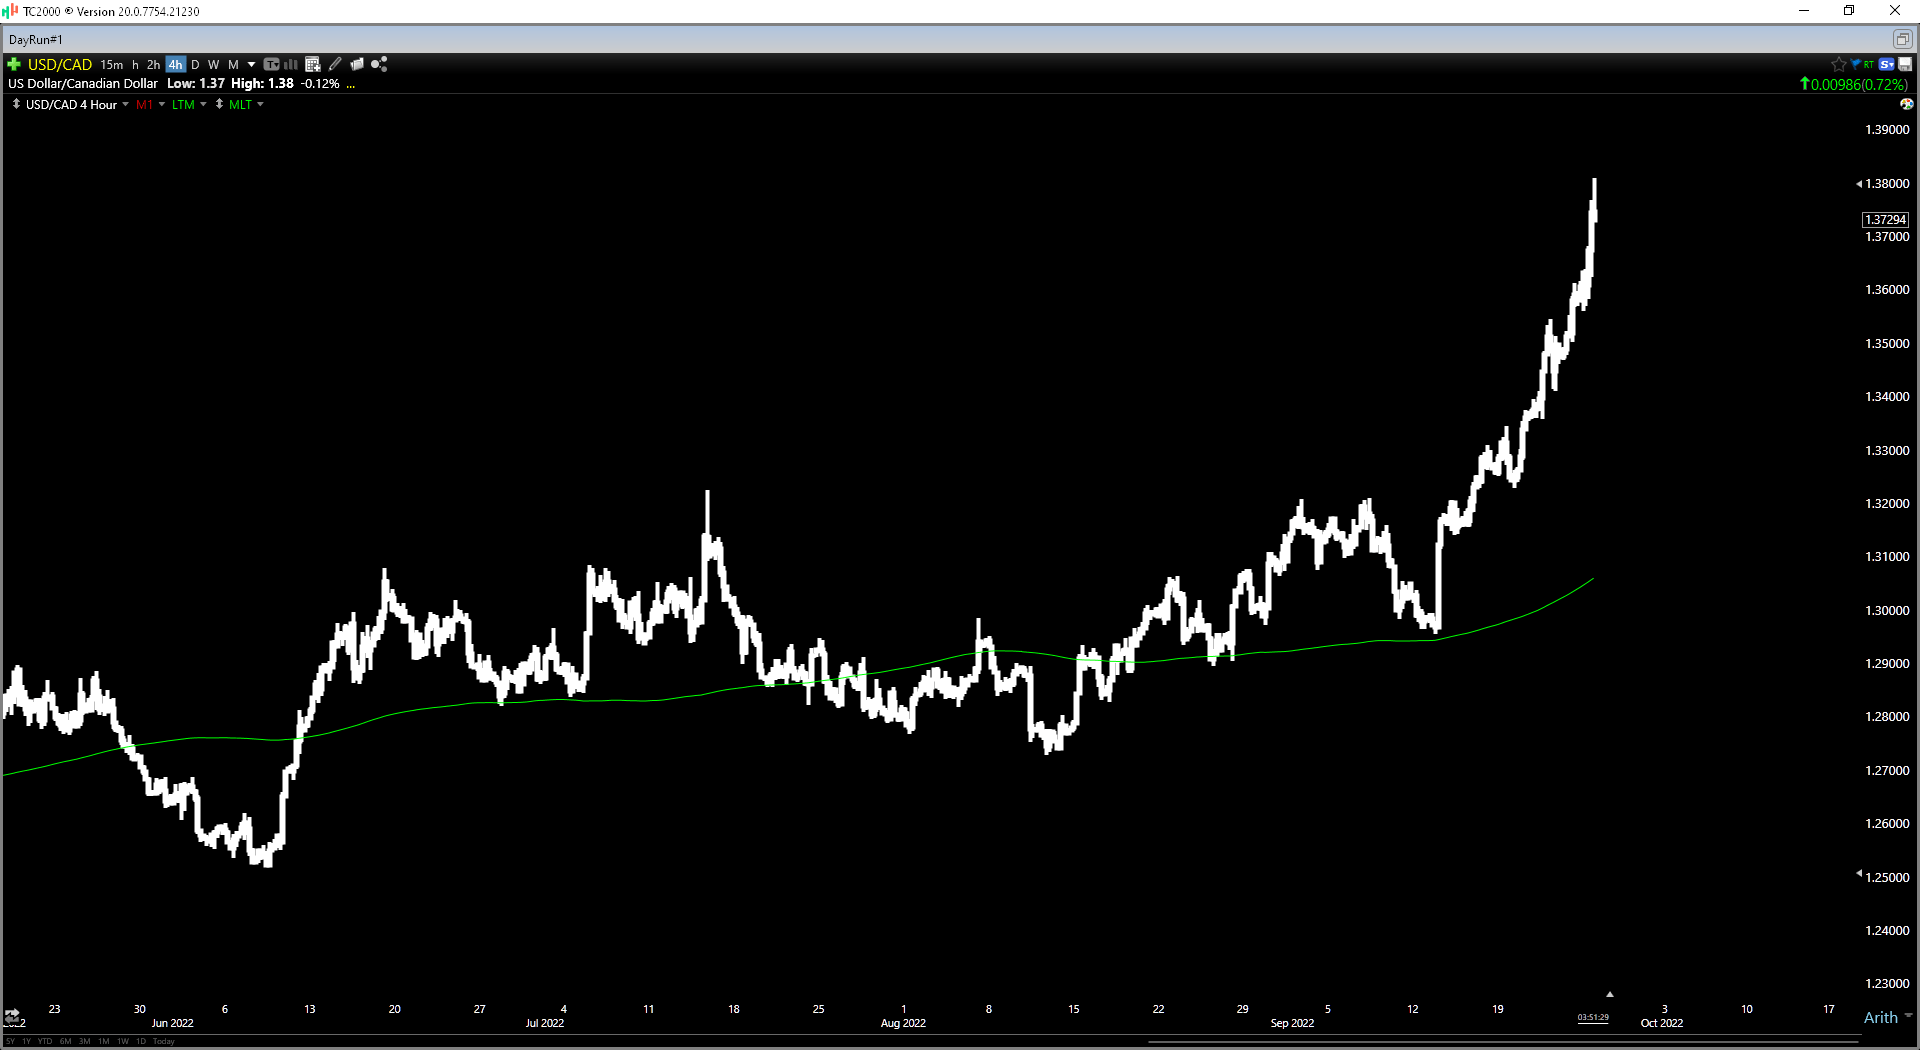
Finally, it’s worth noting that since the company provided FY2022 guidance in June, the Canadian Dollar has continued to weaken (Red Lake Operations), and oil, steel, and energy prices have declined since its update. These are favorable developments, suggesting that the company has a much better shot at meeting guidance this year from a cost standpoint and maintaining its industry-leading cost position among intermediate/senior producers. To summarize, while FY2022 was very disappointing, and the share price was punished for this accordingly (and then some), I see the potential for Evolution to beat cost guidance this year and see costs decline, even if labor is expected to be higher (up 5% year-over-year).
Operating Costs & Cash Flow Generation
Looking at costs from a long-term standpoint, it’s quite clear that Evolution has seen a sharp trend higher in costs, which certainly isn’t ideal. However, the company has seen its operating costs rise from a much lower base than its peer group, with the company’s costs beginning the period (FY2018) at A$790/oz [US$600/oz] and trending higher towards A$1,400/oz before pulling back in H2 2022 with much higher production, helped by a strong finish to FY2022 for Red Lake (~38,600 ounces).
Evolution Mining – Quarterly All-in Sustaining Costs (Company Filings, Author’s Chart)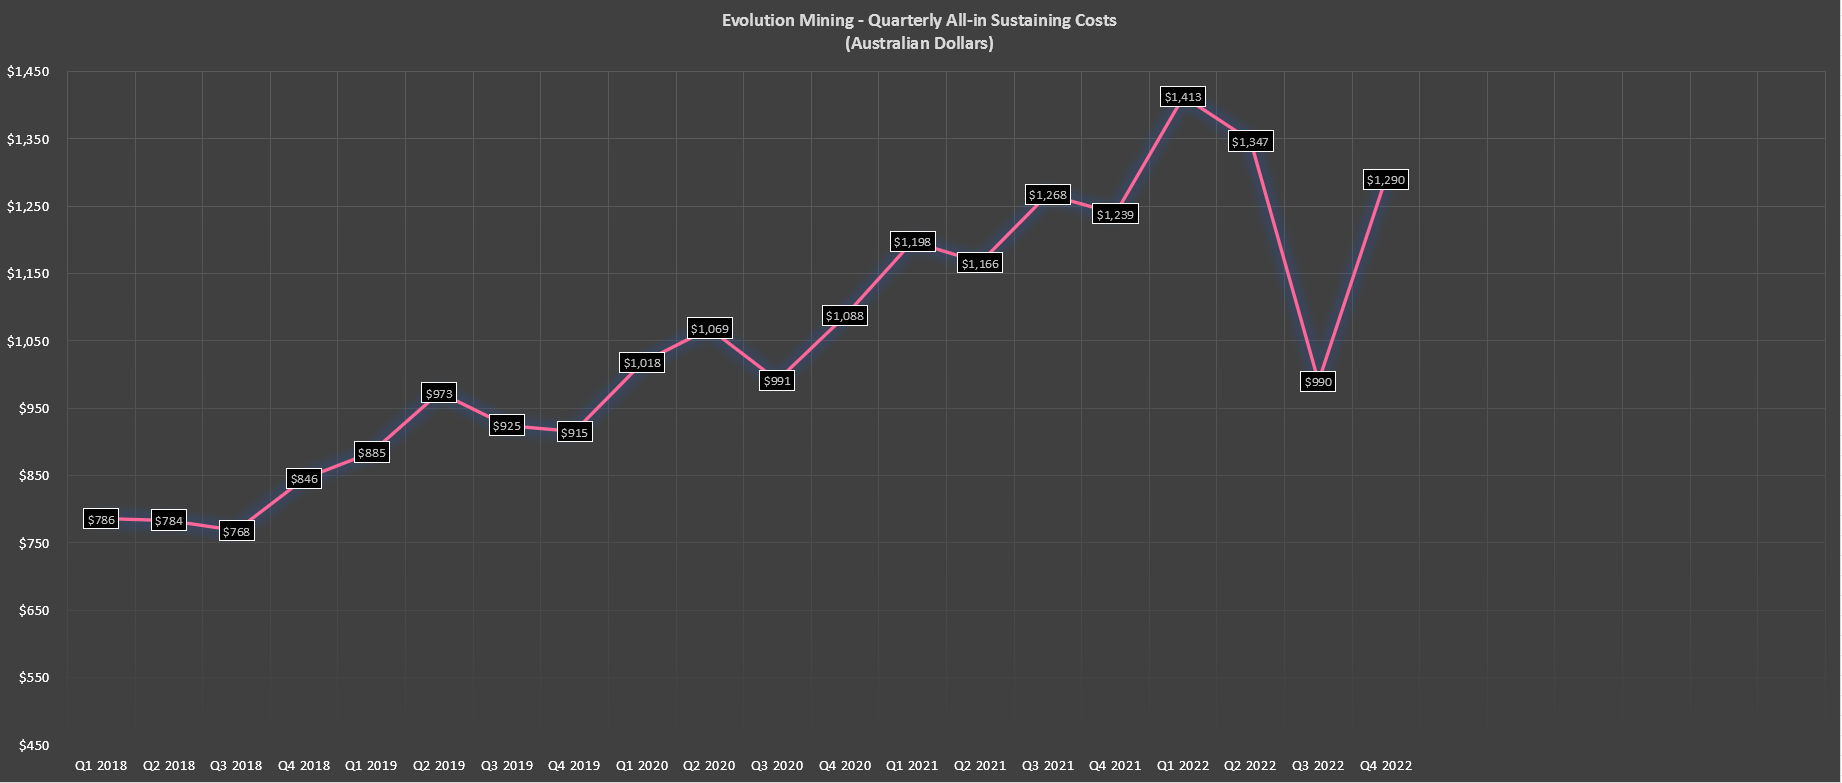
Looking at Evolution’s FY2023 and FY2024 guidance, which is benefiting from full ownership of Ernest Henry (negative all-in sustaining costs due to copper by-product credits), operating costs are expected to drop 1.5% year-over-year (FY2022: A$1,259/oz). This combination of 12% higher production and flat to lower costs should help to offset some of the weakness in the gold price, which has continued to slide since the start of Q3, and averaged A$2,425/oz in FY2022. So, while some higher-cost producers like Equinox (EQX) could see a significant decline in cash flow in FY2023 as margins are pinched, Evolution should still see solid cash flow generation given its strong margin profile and higher production.
FY2023/FY2024 Guidance & Outlook (Company Presentation)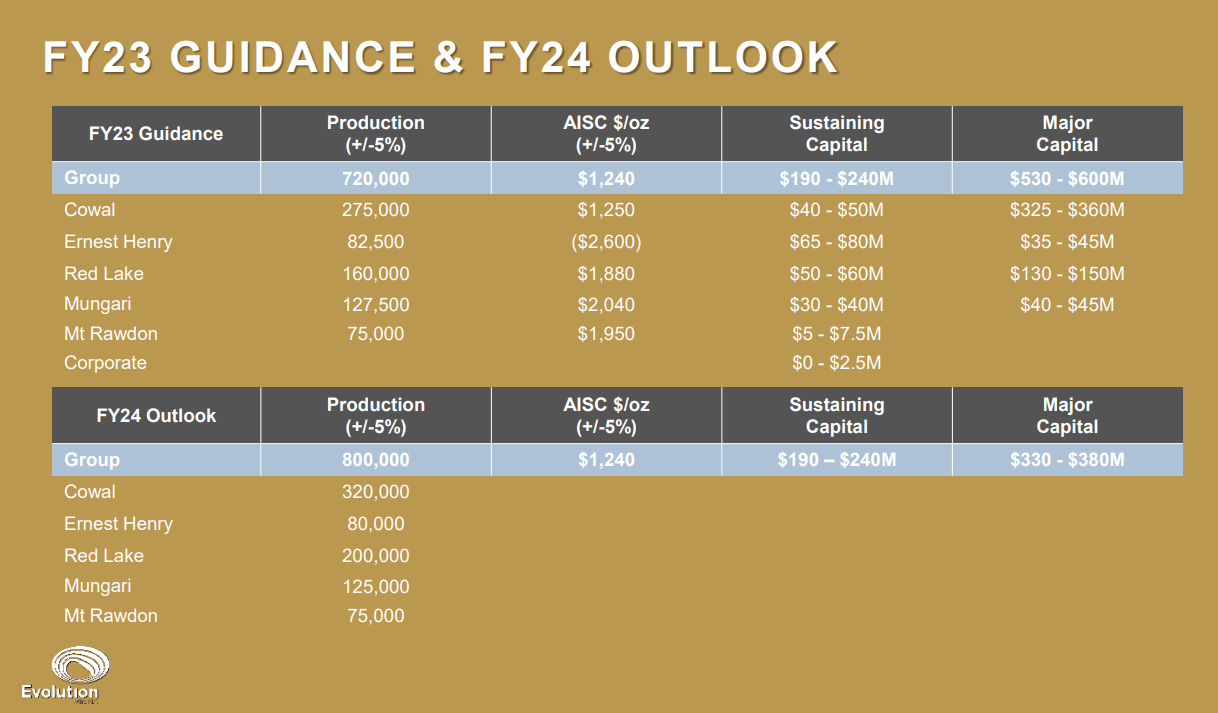
Lastly, it’s worth noting that Red Lake is expected to have a much better year, the one operation that has dragged on the company’s results, given its less favorable cost profile. Based on FY2023 cost estimates of A$1,880/oz, costs are expected to decline over 25% year-over-year (FY2022: A$2,519/oz). Assuming the company can deliver against its long-term plan at the asset, we should see unit costs decline even further, with the potential of 200,000 ounces in FY2024 at sub-A$ 1,800/oz costs.
A turnaround at Red Lake could help with Evolution’s multiple, with this under-performing asset dragging on perception surrounding the stock, similar to Pogo, which was a thorn in the side of Northern Star (OTCPK:NESRF) until recently (hurting consolidated margins). If we look past FY2025, the ultimate goal is to look at mill expansion options and possibly bring its Bateman Mill online, paving the way for up to 300,000 ounces per annum at even lower costs. To summarize, while this asset has been a disappointment to date, it looks like the growing pains are behind the company at Red Lake. Let’s look at the valuation:
Valuation & Technical Picture
Based on ~1830 million shares outstanding and a share price of US$1.27, Evolution has a market cap of ~$2.32 billion. This compares favorably to its estimated net asset value of ~$3.16 billion, leaving the stock trading at approximately 0.73x P/NAV. For a company operating in Tier-1 jurisdictions with industry-leading all-in-sustaining costs, I would argue that a fair value is closer to 1.15x P/NAV, or US$1.99 per share. So, from a fundamental standpoint, the stock looks undervalued here. This is even after applying a lower multiple vs. 1.25 previously (more difficult cost environment vs. H1 2021) and using more conservative gold price assumptions ($1,725/oz long-term gold price assumption).
EVN 12-Year Chart (TradingView.com)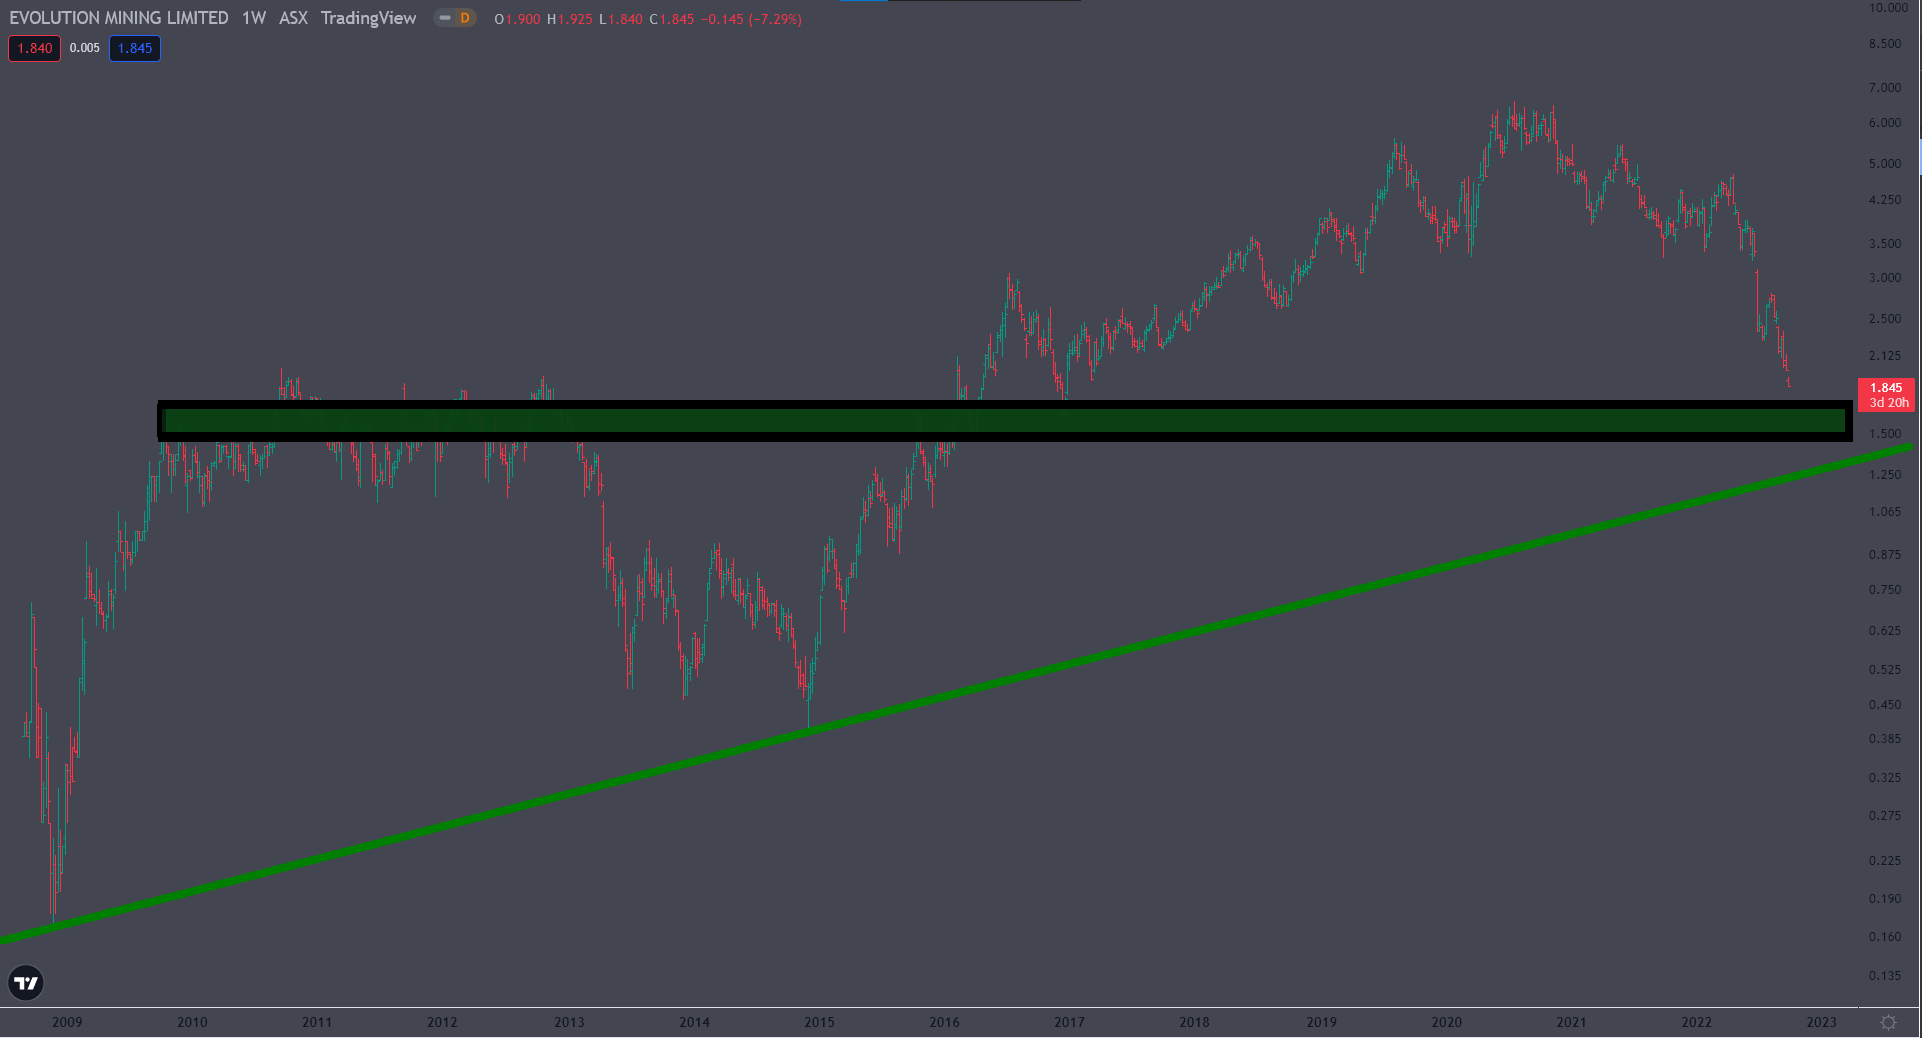
Unfortunately, from a technical standpoint, Evolution broke a pivotal level at A$3.45 [US$2.40], putting a dent in the reward/risk outlook with the stock completing a head & shoulders top. For now, the stock remains a falling knife at A$1.85 [US$1.30], with no clear support for another 10%. That said, the A$1.65 [US$1.12] area is a major support level dating back to the previous bull market cycle, with prior resistance areas often becoming new support once broken. So, while I don’t see a low-risk buying opportunity here just yet from a technical standpoint, a pullback below A$1.65 [US$1.15] should present a buying opportunity.
Summary
Evolution had a very disappointing year from an operational standpoint in FY2022. Still, its portfolio optimizations have created a stronger portfolio, especially with it now having full ownership of one of the lowest-cost mines globally and a much longer life portfolio. Besides, while FY2022 was a tough year, Evolution was not alone, and the disappointing year is more than priced into the stock, with the company trading at barely 0.70x P/NAV. So, for investors looking for a Tier-1 focused turnaround story with an attractive valuation, I would view any pullbacks below A$1.65 [US$1.15] as buying opportunities.
Be the first to comment