

knorre
I echoed that everything is going to be alright on Tuesday evening (after the 4% correction) on CNBC Street Signs (Asia) with Will Koulouris. Thanks to Will, Gabrielle See and Celestine Francis for having me on.
Here were my show notes ahead of the segment:
Put it in perspective: We haven’t even reversed last week’s gains in the market. We’re nowhere near June lows. Wait a day or so to settle, then pounce selectively.
Stockcharts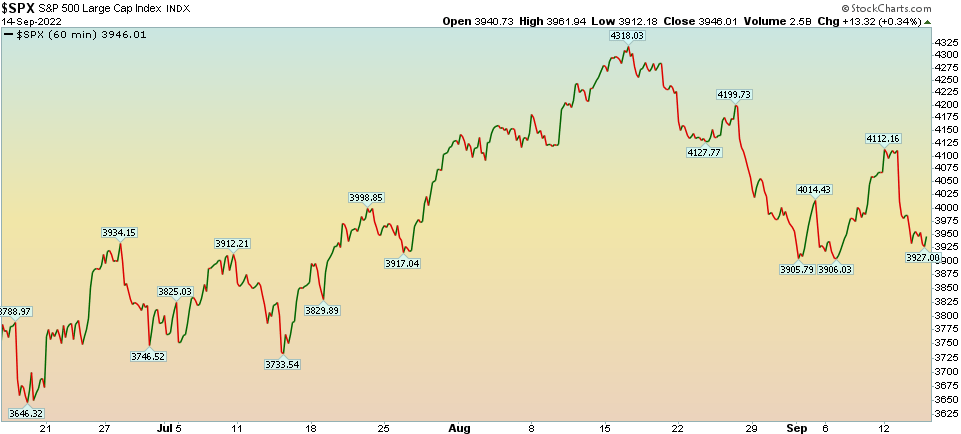
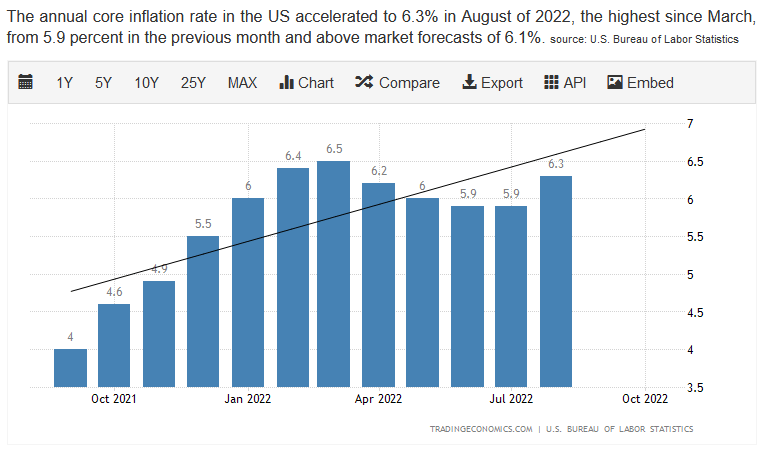
– The good news is “peak narrative” holds as the June report was the highest print. The bad news is the upside miss cements a third 75bps hike next week (which was already expected). Key will be November and December: 50 then 50 or 50 then 25?
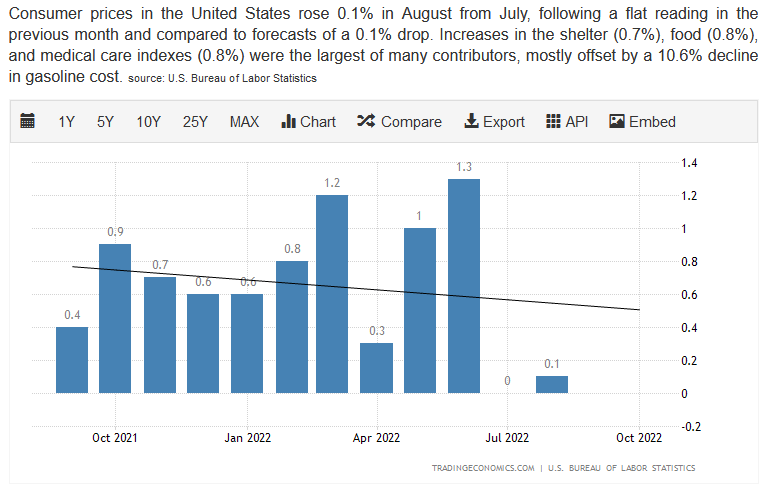
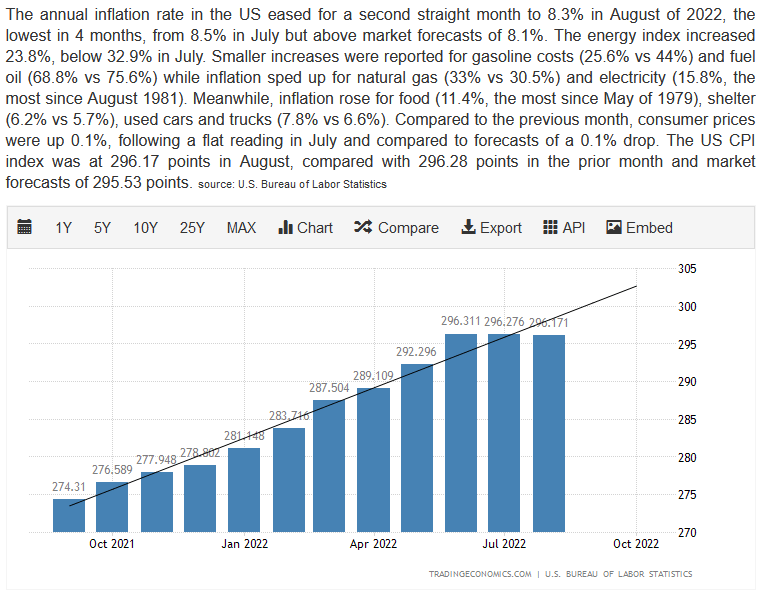
– Rents, food (+11.4% yoy) and healthcare account for increase in CPI.
– Consumers got some relief from a (-10.6% mom) decline in gasoline prices.
– WSJ Nick Timiraos put out trial balloon for 100bps hike in September (which took odds up to 47% in the afternoon session). UNLIKELY.
The market will trade heavy for a day or two until participants can refocus on fundamentals/earnings of businesses – which are holding up nicely despite a challenging environment. 2023 S&P Estimates are still ~$243.73.
5 year inflation breakevens are down from 3.59% in March to 2.62%. The Fed is more focused on expectations than actual inflation because it effects behavior.
Fred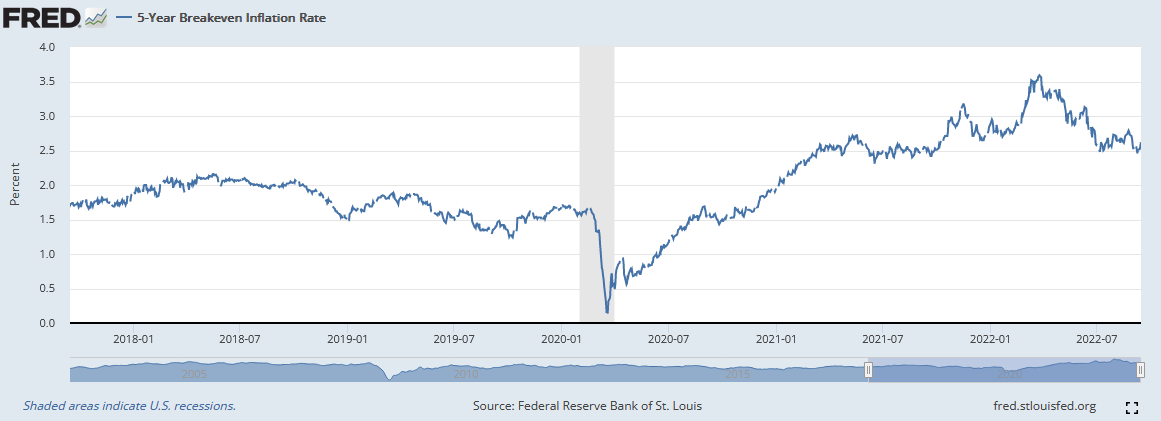
Key Is Positioning/Sentiment (BofA Survey Fund Manager Released This Week)
Managers were already positioned for the worse case. They got it. Now who’s left to sell? Pain trade is UP (looking out a few months).
– Highest expectations for Recession since April 2020 and March 2009 (bottom was in in both cases).
BofA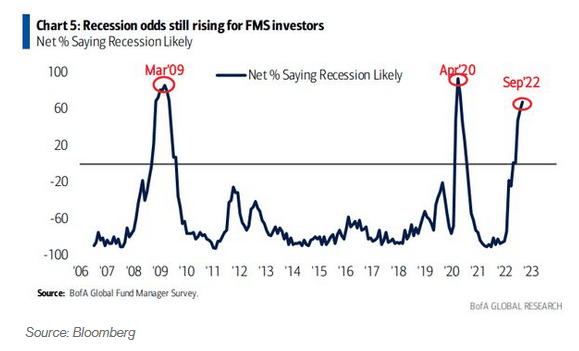
– Lowest Percent of Managers taking higher than normal risk.
– Lowest Percent of Managers “Overweight Equities” in history (-52%). Lower than 2020 Pandemic and GFC in 2008.
BofA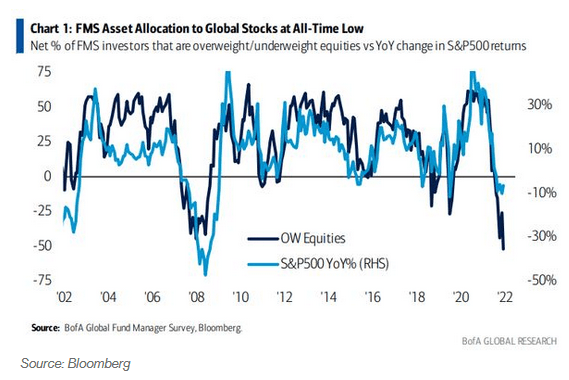
– Growth Expectations near all-time low. 72% expect weaker economy next year.
BofA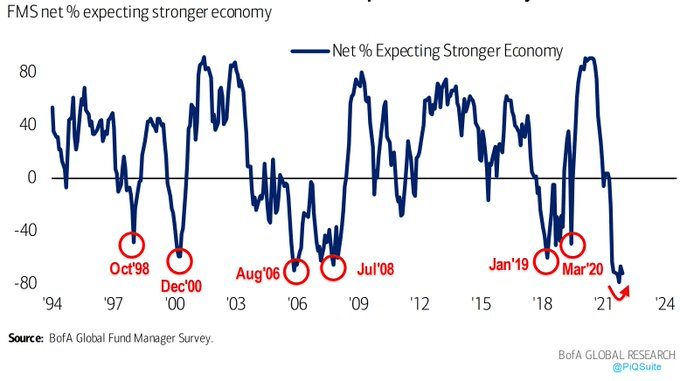
– Allocations to cash highest since 2001 (6.1%). Higher than GFC and Pandemic Lows.
BofA Avg. cash balance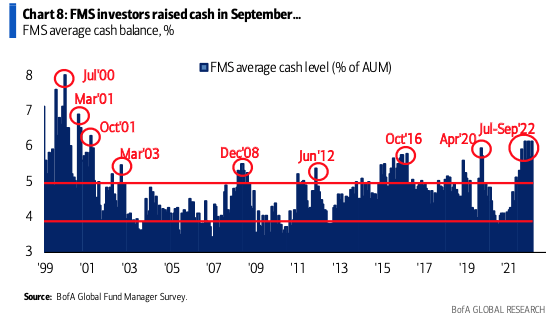
– Relative to the past 10 years, investors are long cash, defensives and energy, while being underweight equities, the euro zone, emerging markets and cyclicals.
– The most crowded trades are long US dollar, long oil and commodities, long ESG assets, short US Treasuries, long growth stocks and long cash.
Take the other side. Looking a few months out, the pain trade is up. The market will start to discount gridlock after November elections: No new taxes/policy change = bullish.
Contrarian Trades (Watch The Smart Money, Not The Emotional Knee Jerk)
– If you can step in at extremes when volatility and fear are high (and be patient in the short term), you will make outsized returns over time.
– Short USD: Commercial Hedgers (green line at bottom) are aggressively short (as was the case before peaks in 2020, 2017, 2015, 2013, 2009, 2006).
Barchart Chris Kimble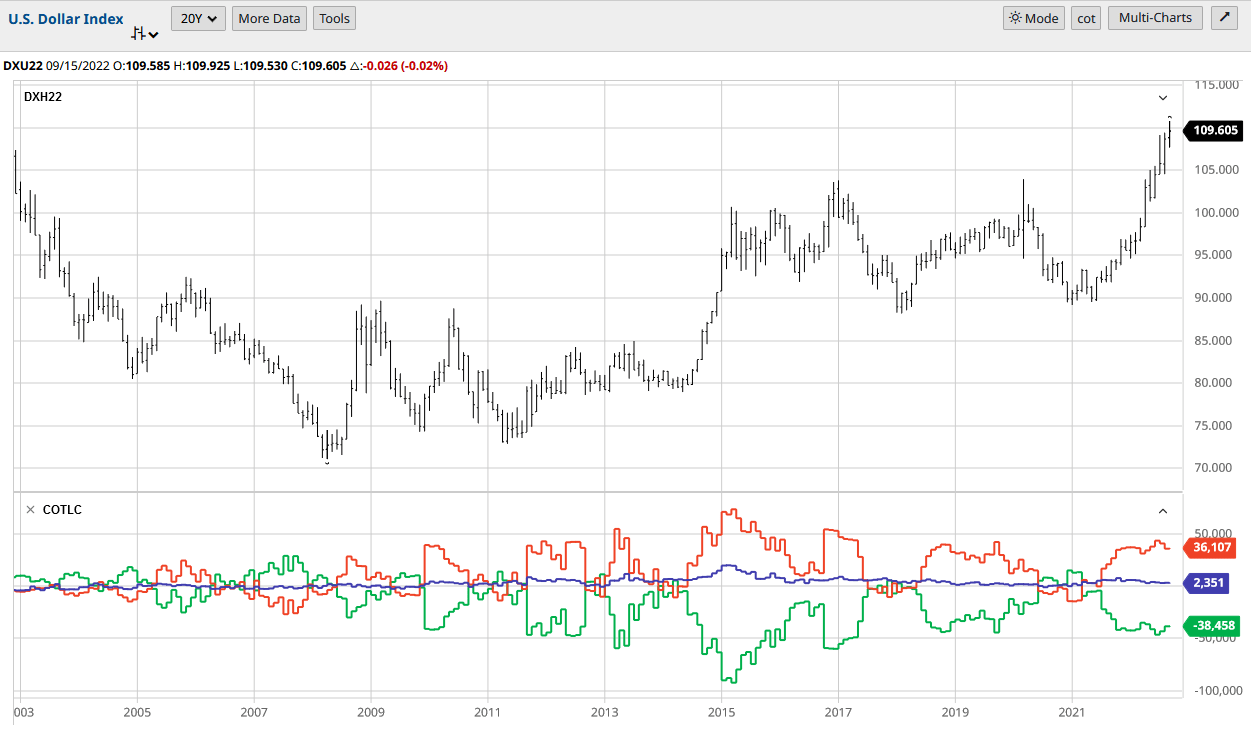
– Long US Treasuries 10 year note: Commercial Hedgers (green line at bottom) aggressively long (as was the case before the rally in bonds in 2018, 2014, 2011, 2009)
Bar Chart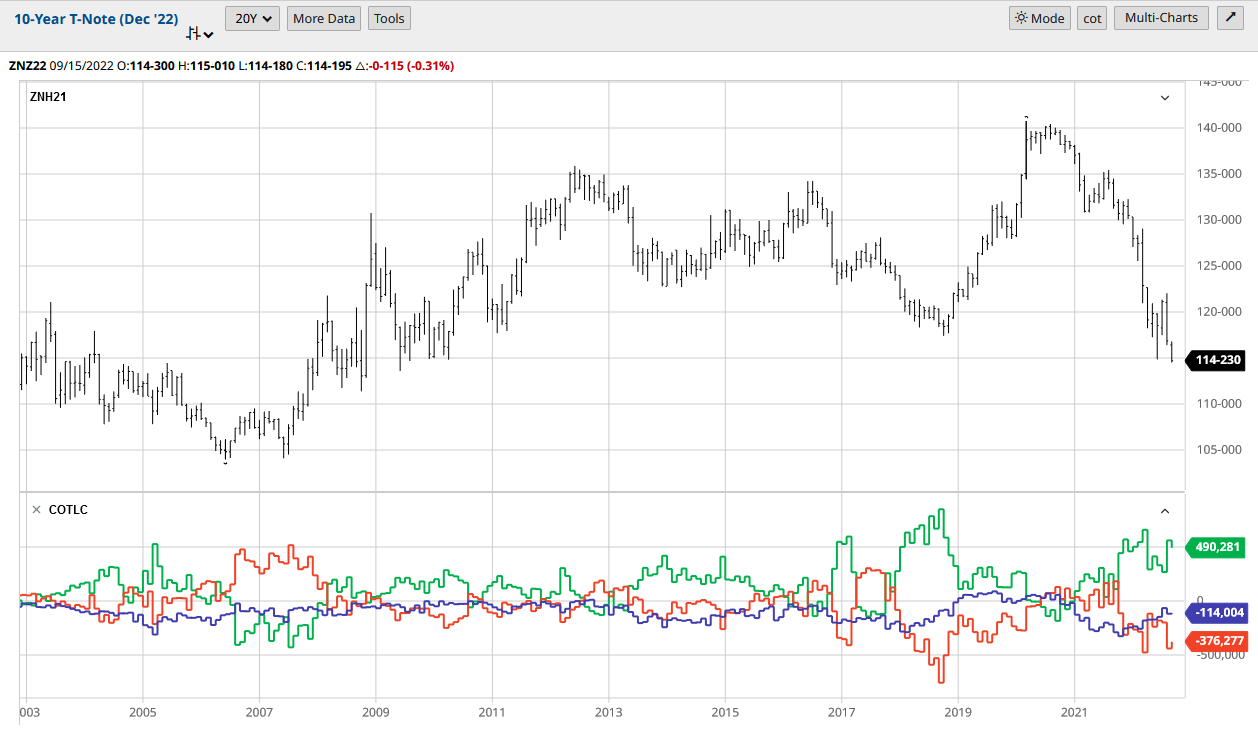
– Long S&P Futures: Commercial Hedgers (green line at bottom) are aggressively long (as was the case before the rally in equities in 2020, 2016, 2011, 2009)
Bar Chart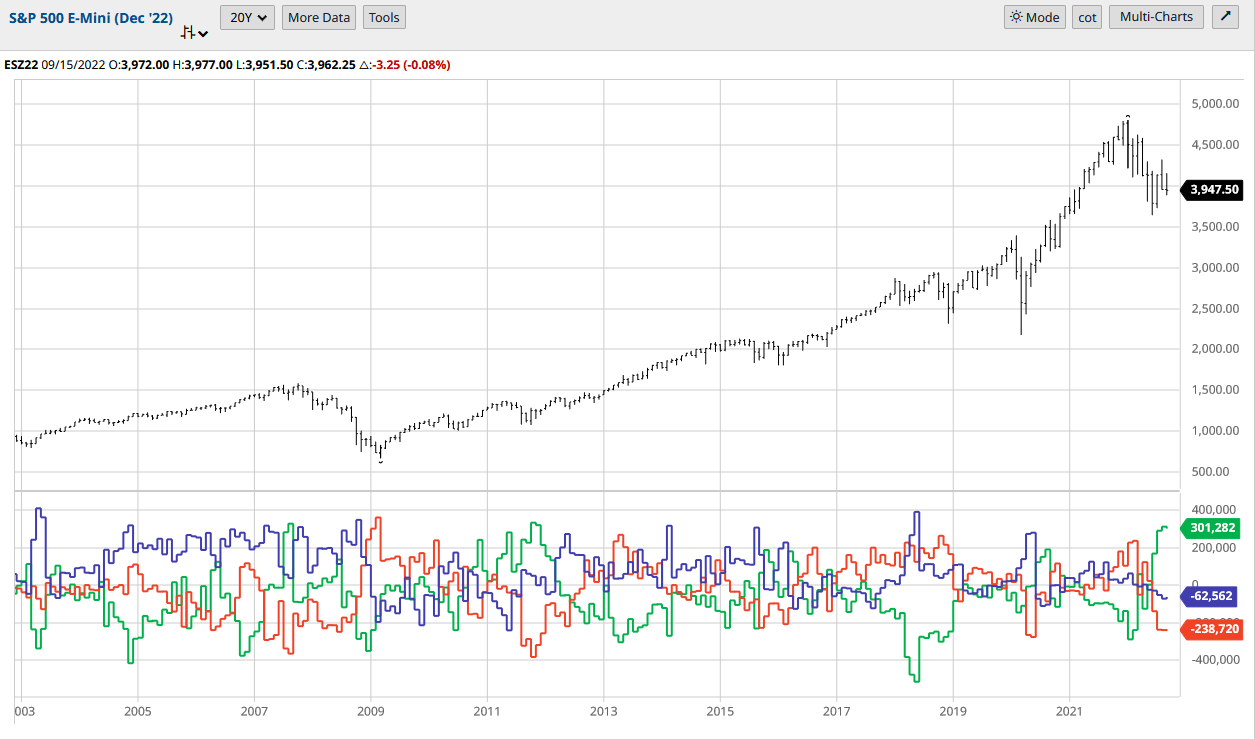
Expedia (EXPE): TSA air travel passthrough numbers higher than 2019 for 5 days so far this month. Expedia CEO on CNBC US, “Business Travel is Back.” People are underestimating the pent-up demand to re-establish business/client relationships (as we saw in leisure over the summer). EXPE trades at 11.5x 2023 Est. with 34.8% earnings growth. Expect to initiate in coming days.
MSCI Emerging Markets (EEM) / Alibaba (BABA): Wait to see weakness in the USD then load up on Emerging Markets/Highest Quality Chinese Equities with a 1-3 year view. We are long Alibaba. Covid (Zero) is temporary. Business moat is permanent. Cloud will triple by 2025. BABA has 36% share. Numerous shot term catalysts: Audit clearance, Stock Connect (dual-listing) ~$30B new buyer demand from Mainland China, continued massive stimulus, Ant Financial.
Lennar (LEN): Wait to see strength in Treasuries then load up on US homebuilders (starter homes) with a 1-3 year view. We will be buying LEN (no position yet. 72M millennials average age 31 need small starter homes (undersupplied by 3.8M units). Trades at 5x 2023 EPS Est.
_________________________________
Has Inflation Peaked? Just Follow The Trends…
Inflation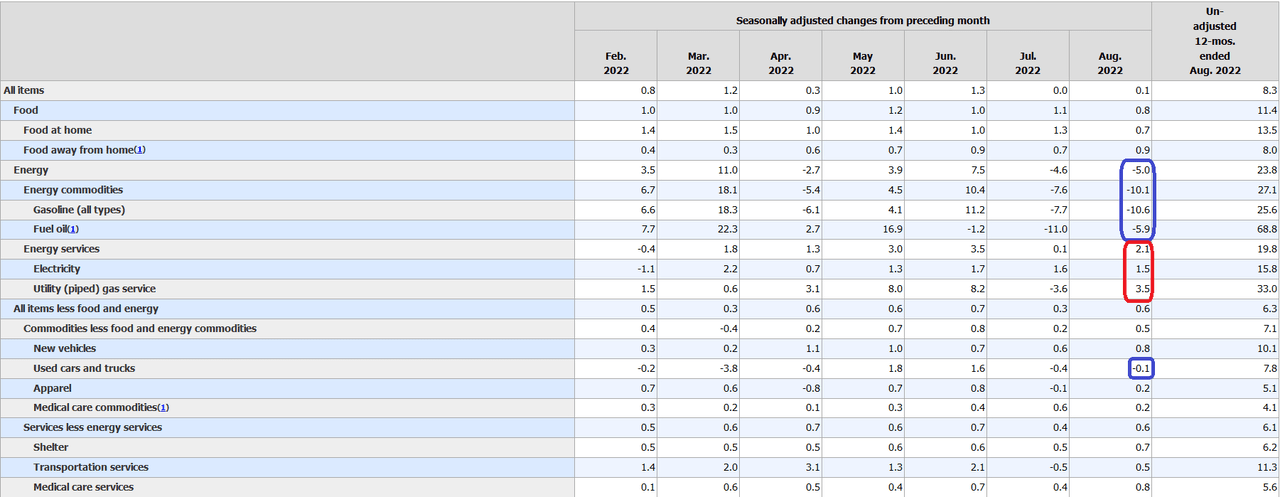
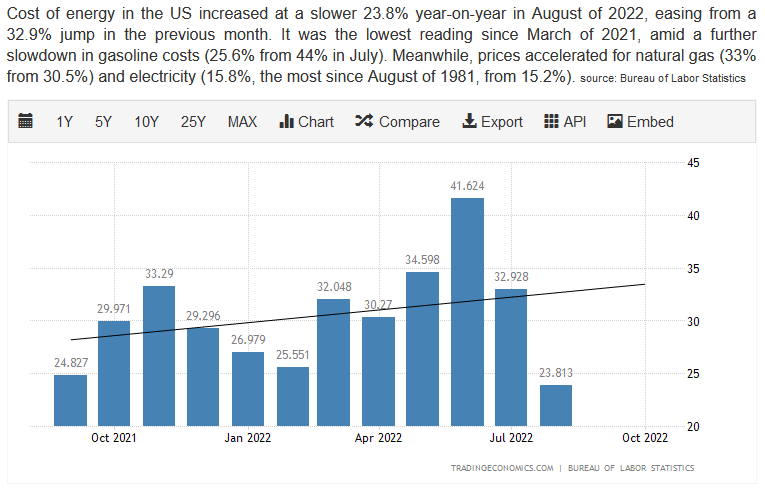
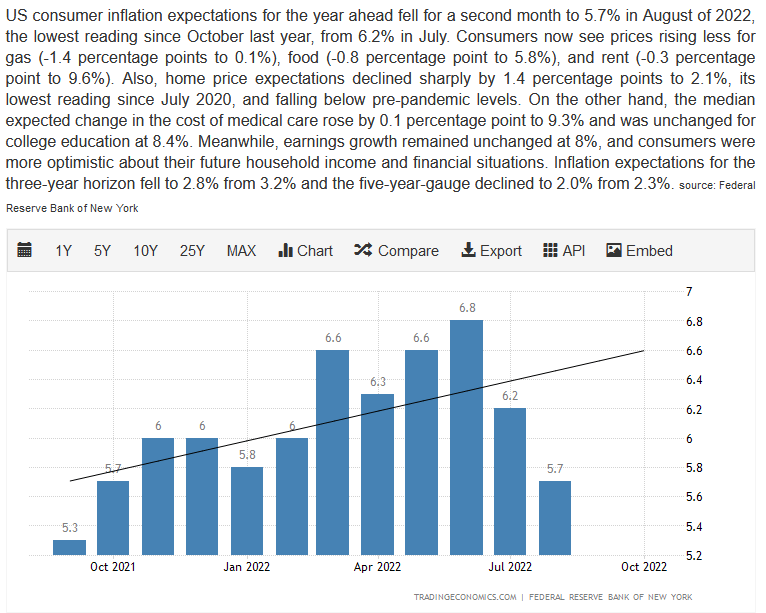
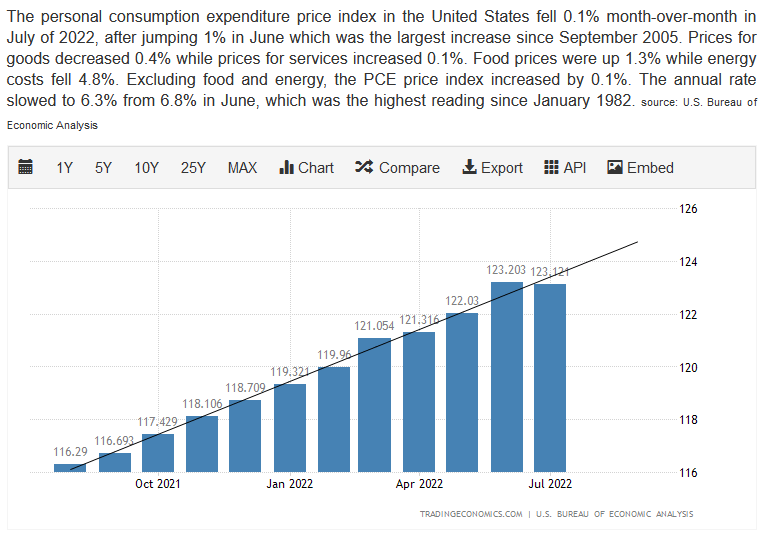
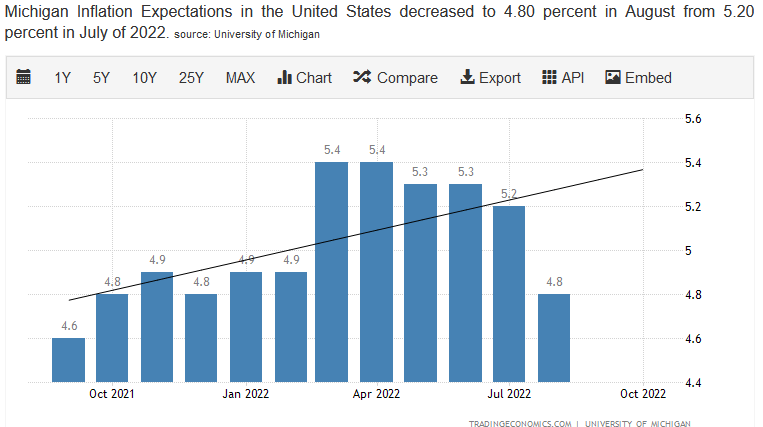
Consumer
Trading Economics Trading Economics Trading Economics Trading Economics Trading Economics Trading Economics Trading Economics Trading Economics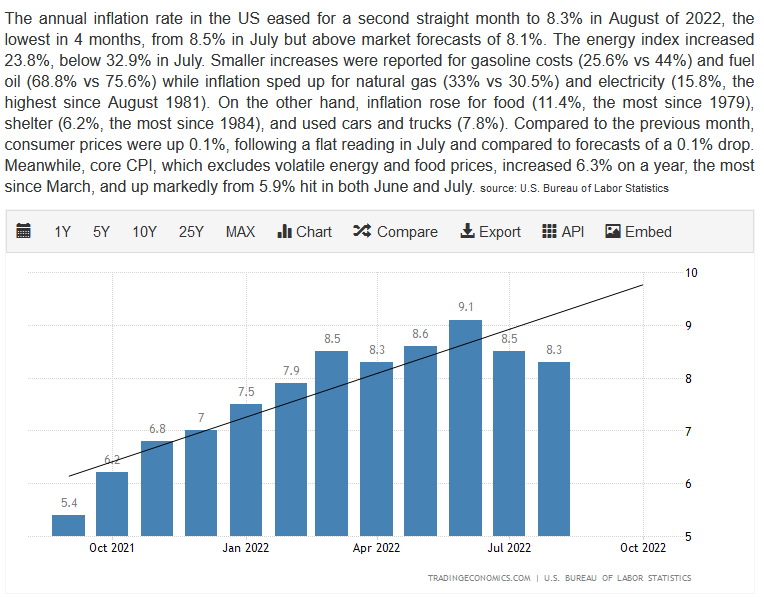
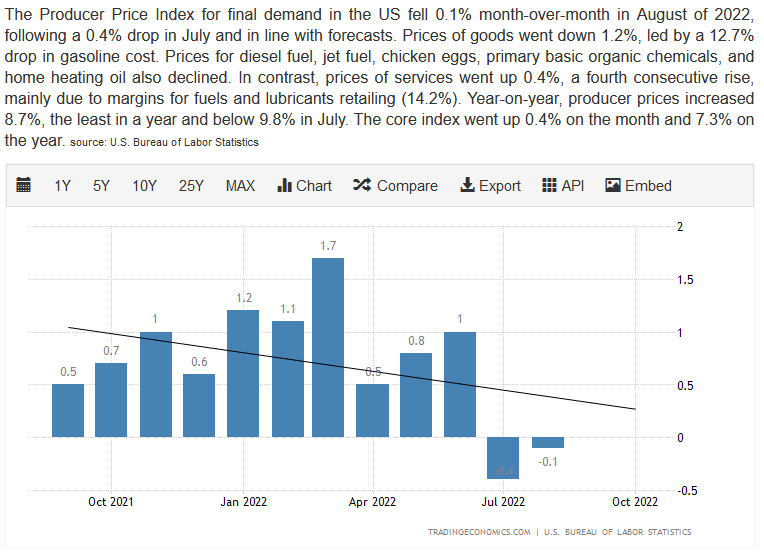
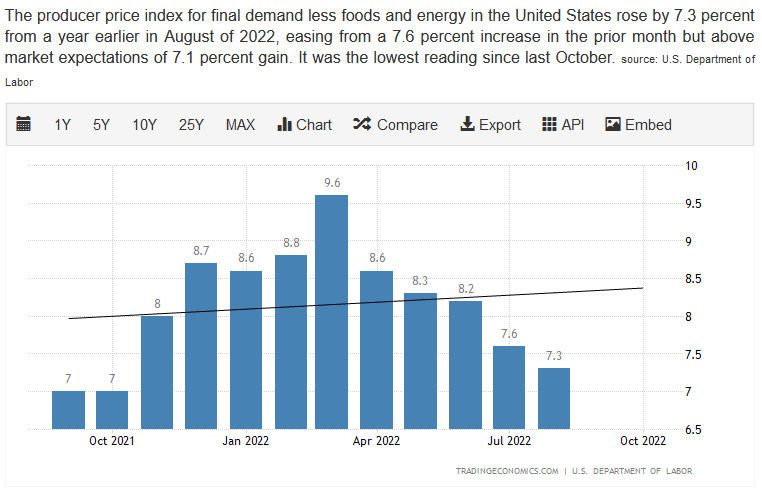
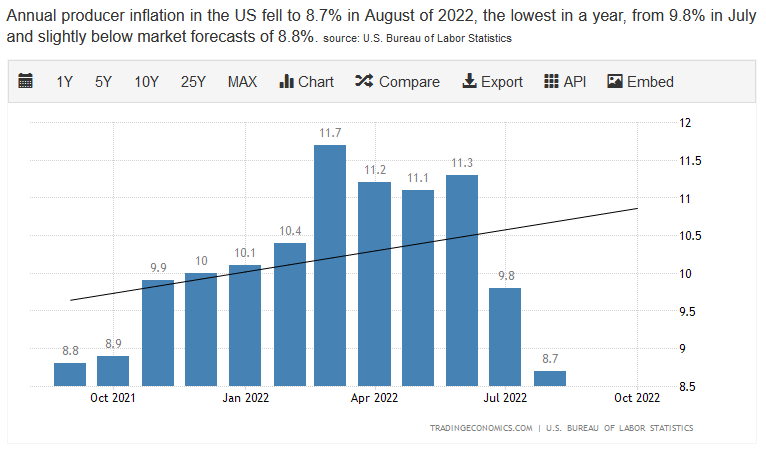
Producers (Leading Indicator):
Trading Economics Trading Economics Trading Economics Trading Economics Trading Economics Trading Economics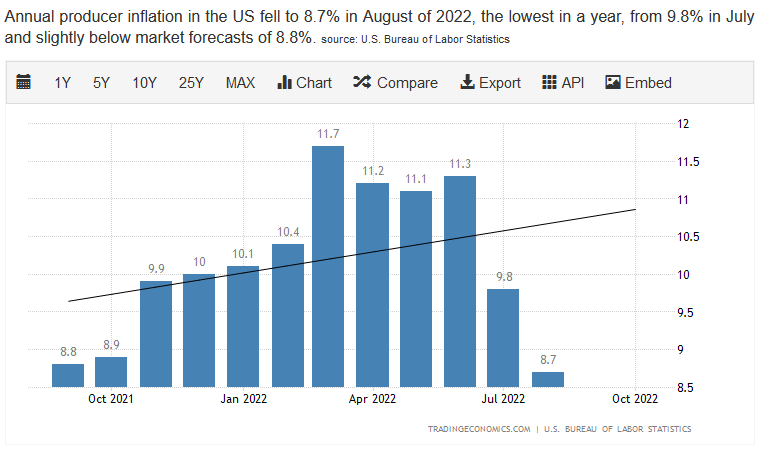

If you don’t understand all of the data above, you need only listen to one of the best sell side strategists in the business – Jim Paulsen of Leuthold – laying out the exact case we have been making since the June lows.
On a final note for auto-suppliers, a core part of our (CPS) thesis is playing out:
CNBC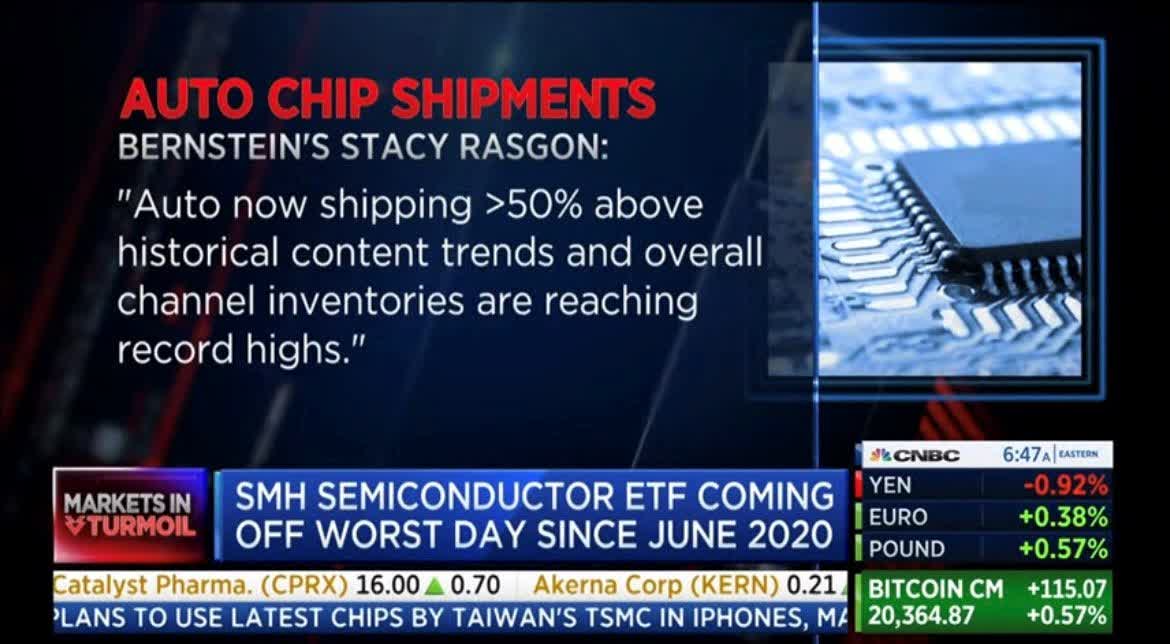
The second catalyst – Credit Markets (refinancing) however are still relatively closed. We’ll see if that improves somewhat after next week’s Fed meeting and presser.
Now For The Short-Term Outlook
Retail Sentiment has picked up a bit this week:
AAII Stockcharts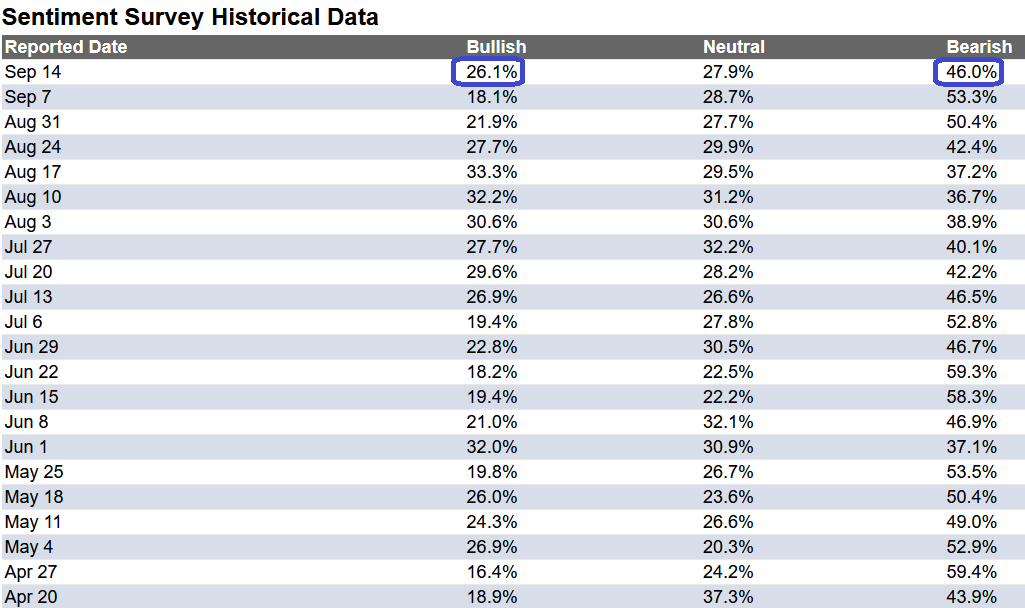
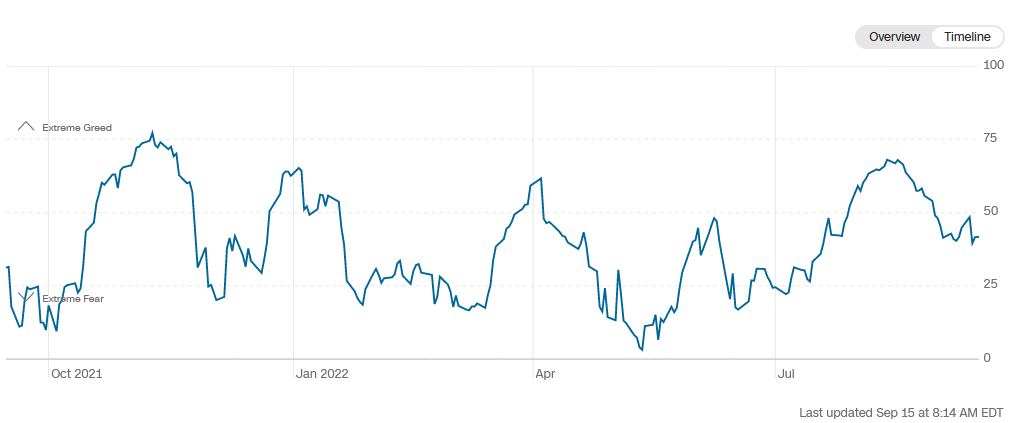
CNN Fear and Greed:
CNN CNN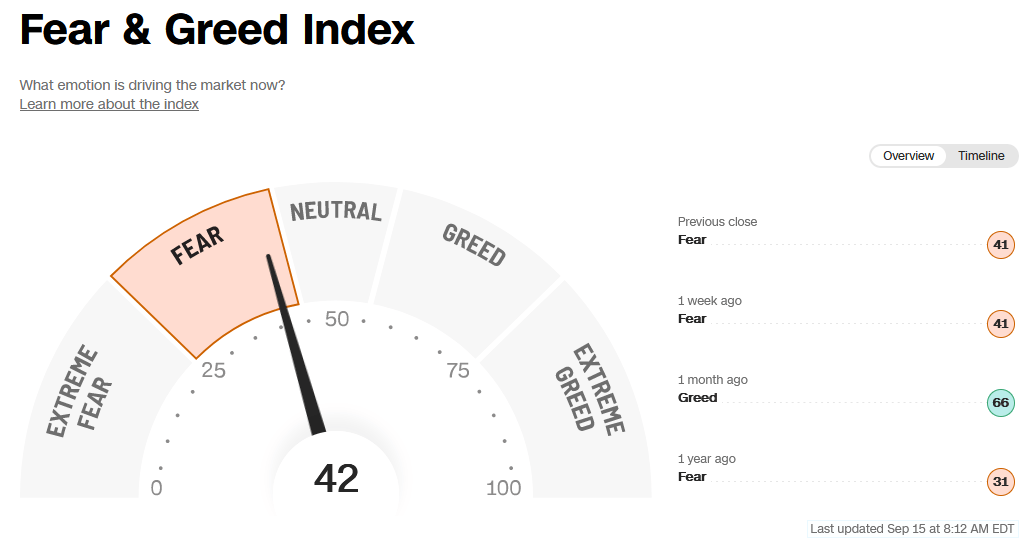
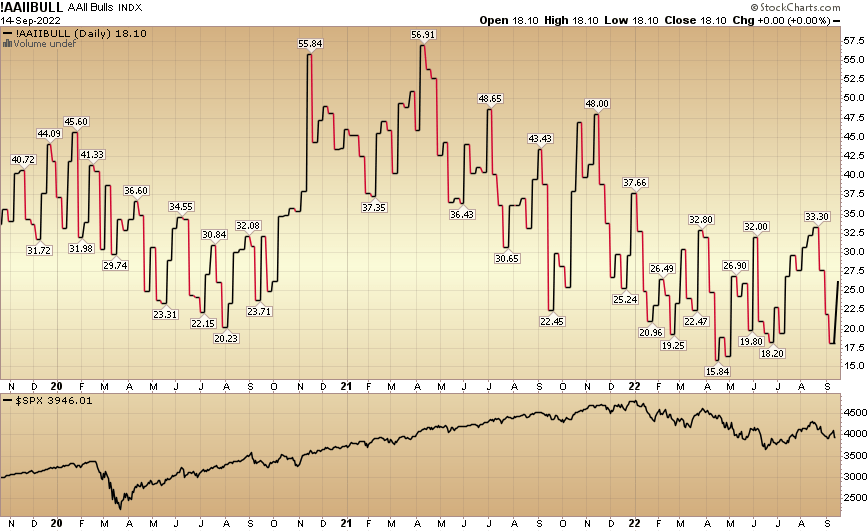
National Association of Active Investment Managers Equity Exposure:
Stockcharts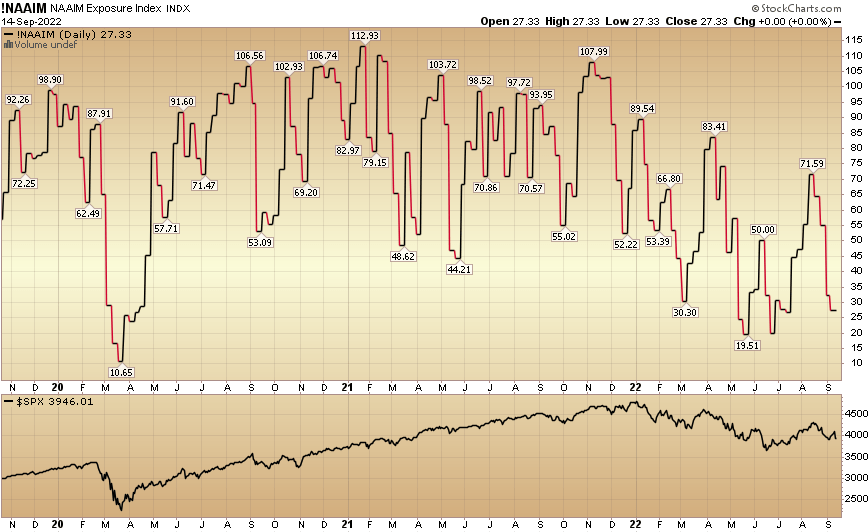
Author and/or clients may have beneficial holdings in any or all investments mentioned above.
Be the first to comment