cagkansayin
Introduction
The situation in the aluminum and other metals market raises many questions for investors – a severe recession is looming, which could point to a deeper bottom for metallurgists’ stocks than previously thought. I believe that if the horizon seems blurry and any outlook – positive or negative – now sounds unconvincing or at least causes a lot of controversies, investors should keep their fingers on the pulse and focus not on the classic “buy and hold” approach but on medium-term positioning.
In such a volatile time as now, I think it makes sense to use not only fundamental analysis but also technical analysis – in this regard, I fully agree with my friend, another SA contributor, Oakoff Investments, who recently discussed this topic in his article on ZIM Integrated Shipping (ZIM). If the market has extremely high volatility, we need not be afraid of it – we should try to use it for our purposes.
Since I have access to the AI-driven technical analysis platform TrendSpider, which allows for backtests of varying complexity, I have started testing various trading strategies, one of which is discussed here.
Thesis
I have analyzed the price action of Century Aluminum Company (NASDAQ:CENX) in various time frames since the company went public and have concluded that a medium-term investor (or even just a swing trader) with a classic trading strategy based on the MACD indicator could increase his income many times over compared to a hypothetical buy-and-hold investor. Not long ago, this system gave another signal to buy CENX stock, which I share with you in this article.
A few words about the company itself
Before I get to the most exciting part, I would like to briefly discuss the company itself.
According to Seeking Alpha, Century Aluminum Company manufactures standard-grade and value-added primary aluminum products in the United States and Iceland and also owns and operates a carbon anode production facility in the Netherlands.
The company’s stock has been on a roller coaster ride since the beginning of the year. After the start of the war in Ukraine (February 24), CENX recorded a rise of >45% in just 6 trading days – from $20 to $29 per share – and approached this level a few times in March and April. After that, however, the threat of a recession in the US and the world began to dominate the market, and prices for aluminum and other major industrial metals began to cool, leading to massive selling and new lows in the stock – from $27 per share in mid-April, CENX fell to a low of $6.7 per share in mid-July and has not recovered significantly since (CENX currently trades at $7.4 per share).
Indeed, fears of a recession and the resulting reaction in metal prices have materialized since March of this year, without affecting the company’s profitability in the way the market had originally expected. In fact, according to a recent IR presentation from CENX, the company only experienced a $25 million negative impact on EBITDA in Q2 2022, which was more than offset by LME/regional premiums. This helped the company slightly reduce its debt and see a modest increase in cash, significantly beating analysts’ EPS forecasts:
CENX’s 2Q presentation, Seeking Alpha, author’s notes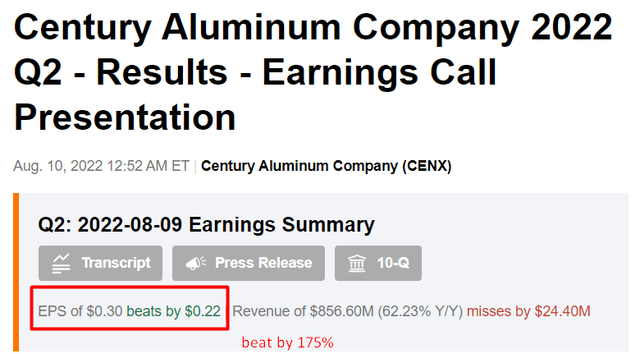
The debt-to-equity ratio remains historically high, but in general, with a current ratio above 1.7, CENX is a fairly reliable and creditworthy company, even in the context of such difficult macroeconomic conditions as now. Analysts forecast EBITDA growth of 79% in 2 years compared to current TTM levels. This gives enormous upside potential even at the most modest EV/EBITDA estimates:
YCharts, author’s calculations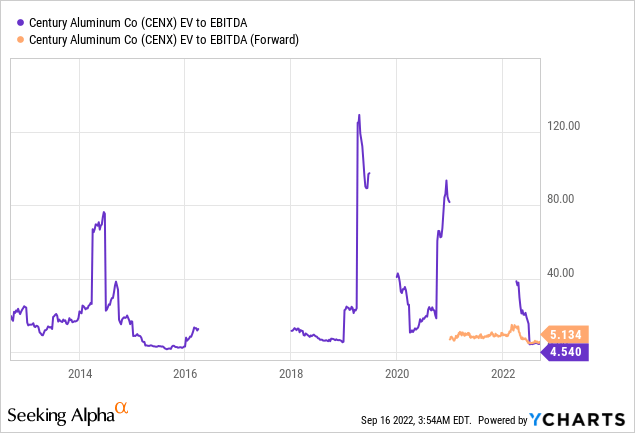
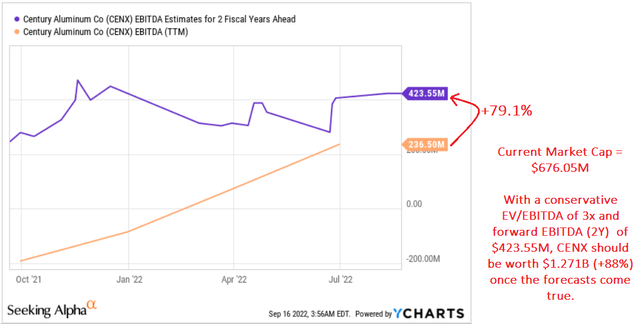
Therefore, I believe that from a fundamental point of view, if Leo Nelissen’s thesis about a possible recovery of aluminum prices shortly comes true, CENX indeed has all chances to show growth again, starting from a rather low base.
The Technical Analysis and Backtesting
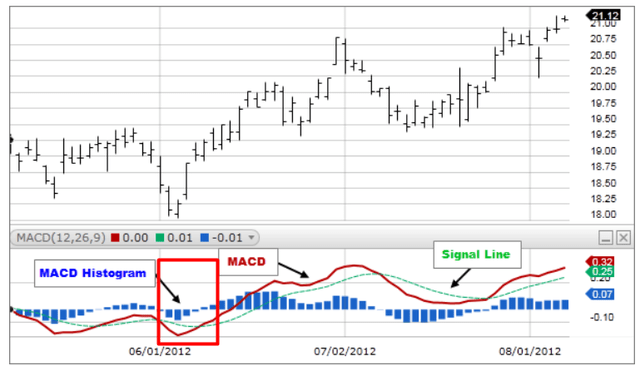
The strategy I propose is based on buying CENX based on the Moving Average Convergence/Divergence (MACD). The main line of the MACD should cross with the signal line from the bottom to the top, while both lines should be at the bottom of the chart – as shown below:
It is assumed that you need to exit the position when the MACD crosses the signal line from top to bottom at the top of the indicator chart.
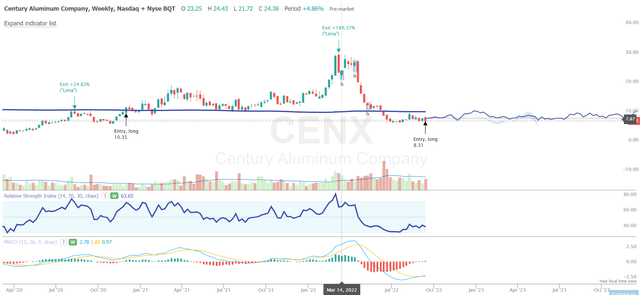
However, I decided to improve this approach – I will leave the position when RSI reaches extremely high values (72+). With this approach, I was able to achieve impressive results in backtesting:
TrendSpider, CENX (weekly)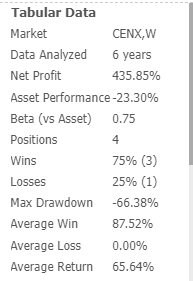
On the weekly chart, this worked in 85% of the 4 positions identified. That is, this strategy proved to be quite selective – the signals appeared on average less than once a year. At the same time, as we can see, the compounding effect turned out to be quite solid:
TrendSpider, CENX, backtesting results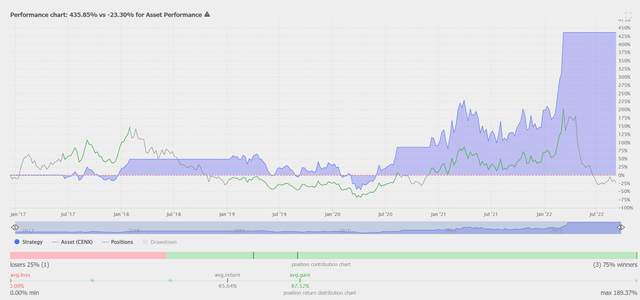
The timeliness of this strategy lies in the fact that it predicts a good entry into a position right now – when the aluminum market turns positive, I believe CENX’s reversal can lead to an extreme RSI level of 70 or more.
However, this may take many months – as has happened in the past:
TrendSpider, CENX (weekly), author’s notes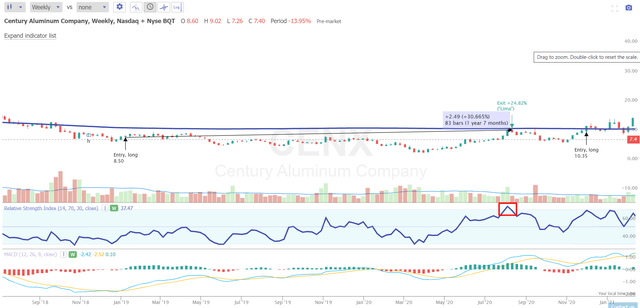
Therefore, I suggest exiting the position when the 200-week moving average is reached – this should yield about 40-45%. TrendSpider’s AI algorithm assumes that this level can be reached in about 3-4 months, given past successful entries.
Risks to consider
Anyone reading this article should be aware of the risks associated with my thesis.
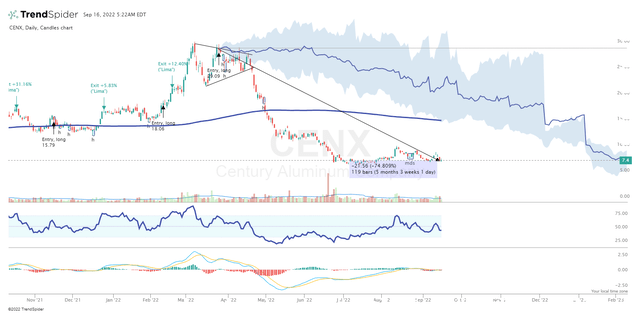
First, this strategy does not work in all time frames. For example, here are the results of backtesting on the daily chart:
On the other hand, this strategy does not recommend buying now – the last position currently brings -74.8%, and CENX has not yet reached the RSI of 70+.
Second, if you follow this strategy, be prepared to potentially hold a losing position for many months, as was the case from January 2019 to August 2020 (as shown in one of the charts above).
Third, the outlook for the industry remains bleak – as we assess the fundamental catalysts for growth, it is not yet clear how the macroeconomy and the state of the aluminum industry will play out for CENX in the near term. If conditions are unfavorable, the downside may be 40-60% at first glance.
Takeaway
Even though my thesis is essentially based on price action analysis rather than fundamental analysis, I believe that the odds of CENX reversing 40-45% from current levels do make sense.
The strategy I use does not work in the short term – it is merely a tool for patient medium-term investing or swing trading. Over longer distances, however, this works great, capturing the fastest rises and missing the biggest drops. Below is an example of backtesting for CENX on a monthly chart:
TrendSpider, CENX (monthly), author’s notes
However, it is worth noting that the strategy does not yet provide a buy signal in the monthly chart. On the other hand, in my opinion, a weekly signal is already sufficient. I recommend CENX as a medium-term swing trade with a target of 40-45%.
Happy investing and stay healthy!
Final note: Hey, on September 27, we’ll be launching a marketplace service at Seeking Alpha called Beyond the Wall Investing, where we will be tracking and analyzing the latest bank reports to identify hidden opportunities early! All early subscribers will receive a special lifetime legacy price offer. So follow and stay tuned!



Be the first to comment