

TravisLincoln/iStock via Getty Images
Euroseas (NASDAQ:ESEA) is a Greek-Marshallese feeder container ship operator. The company operates a small fleet of about 19 feeder and intermediate size ships, about 50 thousand TEU.
Since the great financial crisis, the whole container ship industry has operated below breakeven levels, with ESEA consistently losing money. The COVID pandemic made ship rent prices explode, and ESEA became incredibly profitable.
However, the market is pricing ESEA at less than 3 times forecasted 2022 earnings. The reason is the market expect the industry to oversupply in the next year or two, and prices to collapse again.
I believe the market is right on this assessment, and that ESEA is even priced for container rent prices very well above what was prevalent in the past decade. With enormous operational leverage, ESEA is double or nothing bet on a cyclical and unpredictable market. If prices remain even moderately above breakeven, ESEA will be incredibly profitable, but if they don’t, then the company cannot even cover operating costs.
Note: Unless otherwise stated, all information has been obtained from ESEA’s filings with the SEC.
The container ship rent industry
First, let’s start with an analysis of the industry where the company operates in. This is always the first step, without which it is futile to think about future dynamics.
ESEA is a small container ship renting company. That means ESEA owns several container ships that are later rented to the big carriers. In particular ESEA owns ships of the feeder and intermediate classes, between 1500 and 3000 TEU, that are used between minor ports or middle-distance trips, not for interoceanic freight.
Porter’s forces
From a Porter’s perspective, the company is in the worst of the industries.
Its clients are gigantic carriers, each moving millions of TEU, against the small ESEA with only 50 thousand TEU. Clients have the upper hand in negotiations.
The ships are collocated through broker agencies that obtain a huge cut without any significant capital investment.
Rivalry among competitors is fierce given that once the ship has been bought, most costs are fixed, meaning that any rate will do. The market is so commoditized that prices are set in index-like fashion, just like any raw material. Barriers of entrance are low, only capital is needed, and not so much. A competitor with a smaller fleet can collocate through the same brokers and managers. Substitution is low though, as there is no comparable way to transport goods as cheaply as by boat.
Its suppliers are concentrated in a few ship makers around the world that are capacity constrained when prices are high and idle when prices are low. We will see more on this on the capital allocation section.
The company’s employees are highly skilled crews that cannot be easily replaced, can become very scarce and usually make high salaries.
Capital, a necessary supply, is usually in good supply, given that most loans are backed by the ships themselves.
Finally, governments were amicable towards shippers, with shippers able to locate the ships in low tributation countries, and the main trading hubs, like the US, China, and Netherlands, providing tax exemptions. This landscape is changing though, with government pressing on environmental grounds.
Therefore, the ship renting industry is just like any other commodity, and even more commoditized, given that ships do not even belong to a particular country in practical terms, have negligible qualitative differences and can move around the globe.
Contractual terms of ship renting
There are three parties to the ship renting industry: the owners of the ships, the brokers/managers of ship fleets, and cargo carriers.
Cargo carriers rent the right to direct the ship, not to actually take control of it. The managers find crews that move the ship from place to place according to contract. The owners pay all expenses, including broker/manager fees, and run the capital risks.
Sometimes small fleet owners enter into pools, with a system not very different from a manager system, but with earnings consolidated one level above the fleet owner, and then distributed according to each owner’s input.
Ships can either be rented spot or through term contracts known as time charters. The spot market runs trip by trip, and is not very usual these days, given that it is inconvenient to have the ship continually recontracting. Time charters are more usual, were the carrier gets the right to direct the ship for a time period, that can range from a few months to a few years.
The time period aspect is very important.
For much of the last decade, term contracts extended for a few months at most, with most of the contracts ending on the same reporting year for 2009, 2014, and 2018 (each year links to ESEA’s 20-F report for that year, and employment can be found under the heading Our Fleet).
This meant the industry was prone to sudden changes of dynamics, with most ship contracts maturing all the time. Things changed after the supply squeeze of 2020. Since then, contracts have lengthened quite substantially. ESEA reports contracts for up to 4 years on its FY21 20-F report. It seems that carriers are now afraid to find themselves under supplied.
Supply and investment dynamics
If we go back to 2006 or 2007, the year when ESEA went public, we find a very similar picture. Then supply was low and ships were contracted for two to three years.
Prices were flying then. Below I use the Baltic Dry Index (BDIY:IND), an index for dry bulk cargo rates, not ship rates, because it is the one going farther into the past. The Contex Index, specifically for feeder ship time charter rates, going back to 2008, tells a similar picture.
Baltic Dry Index Futures 1990-2022 (Seeking Alpha)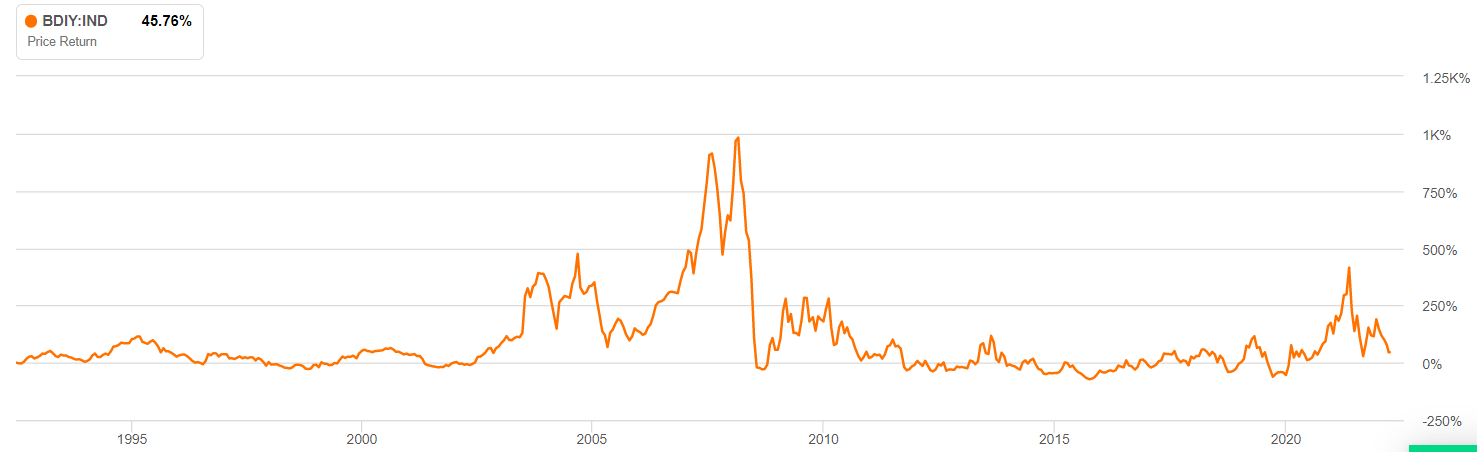
What we also grasp from the BDI is that shipping is a fairly stable commodity that is sometimes squeezed substantially, with prices multiplying almost tenfold to then suddenly collapse again.
This is probably caused by the dynamics of supply. Carriers suddenly find themselves in a constrained situation, say the growth in China in the decade after the 2000, or the COVID crisis with ships standing waiting outside ports all over the world in 2020. Then every carrier wants to lock their supply, with term contracts moving farther into the future and prices bid up fiercely.
During that period, both carriers and fleet owners increase ship orders frantically. In 2007, the order book for new ships reached 7.5 million TEU, then 50% of the world’s already in use fleet. Ships take some time to be made, between one year and a half and three years. This takes even longer when everybody is looking for ships.
Suddenly, after a period of perceived undersupply, supply becomes excessive. Everybody has new ships that need to be put to use, at any price. Prices collapse, contract terms shorten, and the cycle restarts.
The downward portion of the cycle lasts longer than the upward portion. I believe this is caused by the cost dynamics of fleet owners. Most costs of operations are fixed. First, the cost of the ship is paid when ordered, received, or bought if second hand. This is a sunken cost, it does not change if the ship is used or not, only recovery is possible. If the ship was debt financed, then at least interest and amortization has to be obtained, otherwise the ship is taken away. Second, the crews are not a plug and remove fixture of a ship, they are difficult to find and set. Therefore, crews will be on the ship anyways. Finally, maintenance has to be done regularly, if not to protect the ships, because regulations, carriers and insurers mandate it for the ship to be useful.
With most costs being fixed, fleet owners have an incentive to put the ships to use at any price, and not to remove supply for the market unless it can be sold for scrap, at substantial impairment losses and possibly facing bankruptcy. The new ships will be there for 25 years, depressing prices.
For that reason, the ship renting industry operates very close to breakeven for very long periods. This slowly causes a decrease in investment, and an increase in ship scrapping, which again reduces demand, but not too much. Then another perceived supply squeeze happens, everybody invests, and back to the cycle.
Euroseas in specific
Euroseas fits the pattern described above.
Cost structure
ESEA’s revenue and cost per day per ship, 2007-2021 (Own, based on ESEA’s 20-F reports)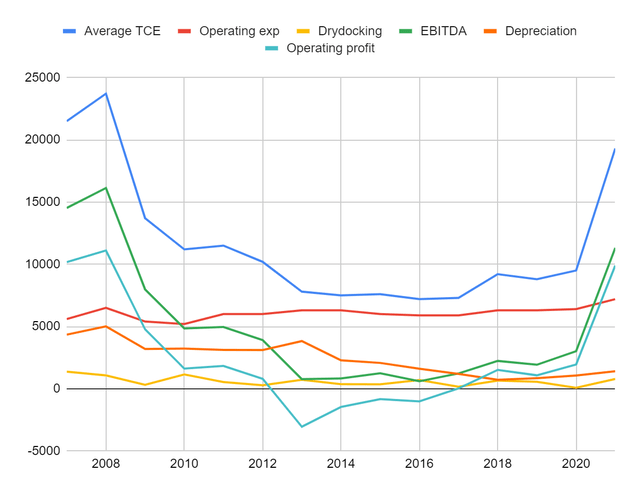
The figures above represent the revenues, costs, EBITDA, and operating profit generated by each ship each day for the years 2007 to 2021. We capture several things.
First, the immutable operating and dry-docking expenses, only slowly trending up. These include the ships management expenses, but not commissions, more on which will be explained later.
Second, revenues (expressed as TCE or term charter equivalent) move wildly and with them EBITDA and operating profits. For almost 5 years, from 2012 to 2017, the company was operationally unprofitable.
Depreciation expenses go down through the decade. This is caused by enormous impairment charges going as high as $70 million in a single year. Each ship’s carrying value is written down and therefore depreciation per ship per day decreases.
Cumulatively, this leads to a very stable but downward drifting breakeven operational TCE rate, which is now close to $10 thousand per day. Take a look at the Contex index linked above, and you will notice that for the most part, prices quite there or below.
ESEA’s operational breakeven TCE price for 2007 to 2021 (Own, based on ESEA’s 20-F reports)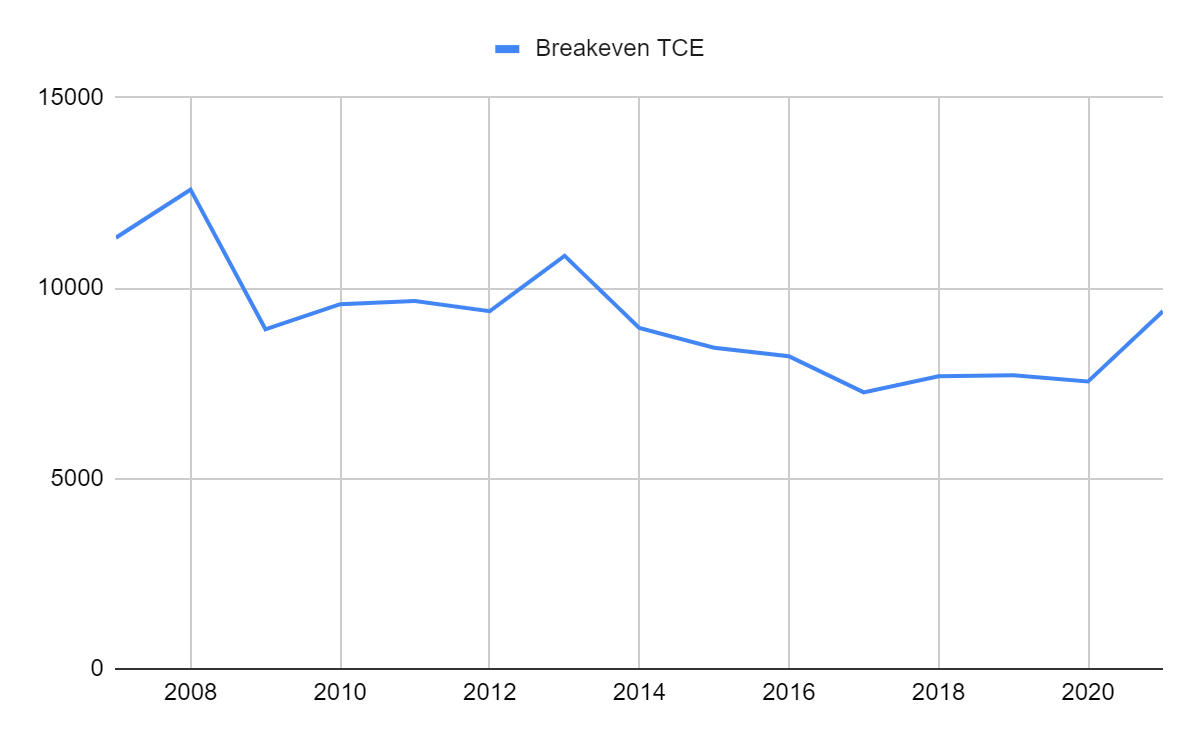
Capital allocation and finance structure
Maybe ESEA would be the contrarian of its industry, accumulating capital when others are not investing and divesting when others are buying frantically.
Unfortunately, this is not the case. The data below shows that ESEA invested heavily going into the collapse and 2008. After the collapse, it ended all investments until 2014, when the company also started taking huge write downs in the process.
ESEA’s EBITDA, Investments, Depreciation and Impairments from 2007 to 2021 (Own, based on ESEA’s 20-F reports)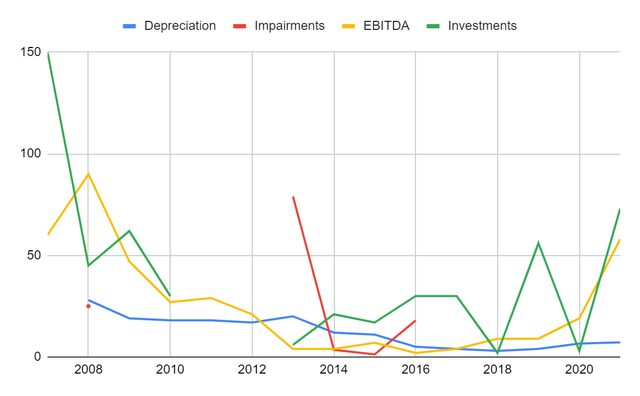
Not only this, but the company is repeating the cycle, with announced ship orders for 2022, 2023 and 2024 for the whopping amount of $385 million.
Capital allocation has not been great at ESEA, we do not know why. It seems that the shipping market dynamics are easy to read.
Fortunately for the company, its cost of debt is relatively low. I believe this is based on the fact that most loans are collateralized by the ship themselves.
Governance concerns
Finally, I am concerned by some governance aspects in ESEA.
The company is run and controlled by the Pittas family, holding 55% of the company’s stock. Two members of the Pittas family are Chairman and Vice Chairman of the company, with one of them being Chairman, President and CEO.
The problem is not the majority holding, which I usually find a good characteristic in a company, but the many relations between ESEA and affiliated companies.
First and foremost, ESEA brokers its ships through a company owned by the Pittas family. This broker company charges commissions as high as 5% from the chart rate, meaning millions each year.
ESEA also contracts all of its managerial tasks to another Pittas family associated company. This includes all of the executive functions. None of the executive members are employees of ESEA. The company pays compensation through a Master Managerial Agreement of a $2 million base plus $700 per ship per day, coming close to $6 million in 2021. The company also paid $500 thousand bonuses in 2021 to its managerial affiliate. These expenses are charged independently of the profitability of the whole company. In fact, when ESEA went public in 2007, Eurobulk, the management affiliate, charged only $2 million, which are now $6.5 million.
Why are not these significant expenses brought inhouse, so they can be curtailed during depressed markets?
ESEA has also purchased several ships from the Pittas family. For example, 4 ships in 2019 alone (Hydra, Spetses, Kea and Diamantis).
A major concern with these transactions is that under Marshallese corporate law, where the company is domiciled, related party transactions do not require an independent party audit, only the vote of independent board members.
What is priced in ESEA’s price?
Fortunately, it is relatively easy to make calculations on ESEA’s future profitability because its expenses have been so fixed in different kinds of environments.
First, we start with debts. ESEA currently owes $100 million and has $50 million in cash. However, it has commitments for $385 million. This means debt of about $435 million in the future.
Profitability for 2022 and 2023 at least is as follows. With fixed costs around $10 thousand per ship, per day, and rates fixed by contracts around $33 thousand, this will mean operating profits of about $130 million, with 16 ships in operation. From the $130 million, $25 million have to be subtracted considering interest rates of about 5%.
This leaves $90 million, from which dividends of $15 million yearly, announced this quarter, have to be subtracted as well. Add back non-cash depreciation of about $10 million considering the current fleet. Considering the company pays no income taxes, this means $86 million in profits for two years.
That comes to $172 million, from which another $20 million in repurchases, also announced last quarter, are subtracted, to yield $150 million that can be (potentially) cancelled from debt. At the end of the bull period, the company can potentially owe $285 million.
Then we calculate after supply excess profitability.
First, we have about $10 thousand of fixed operating costs per day and per vessel. These will probably climb a little because nine new boats will be added to the fleet. With the cost of $348 million depreciated over 25 years over 9 vessels over 360 days, this comes to about $4300 per day per vessel, which is similar to depreciation charges around 2008. With current depreciation around $1400, this means we have to add about $3000. Fixed costs per day per ship come to $13000 approximately.
Then we have to add $15 million to service the $285 million in debts that will remain, if the company does not use money to pay even higher dividends. We also add $20 million in net income for shareholders, considering that the stock’s current market price is around $200 million.
ESEA has six boats that are from 2001 or before. These will need to be scrapped soon, as they reach the usual 25 years of service. Plus nine currently ordered ships. This equals 19 ships in service.
How much is needed to cover fixed costs and then obtain $35 million more for capital, both debt and equity? A daily rate of about $18 thousand per ship.
Conclusion
The question is, will rates remain at profitable prices?
Current context rates stand at about $50 thousand and $80 thousand per day for 2500 and 4500 TEU ships, the core of ESEA’s fleet. In fact, ESEA announced that two 2800 TEU ships to be received in Q123 are already contracted for $40 thousand.
But the problem is that most capacity is going to be added on 2023 and 2024, when several of ESEA’s contracts signed after 2020 end. I expect an enormous amount of supply to be flooding the market then.
Can rates fall below $18 thousand, the magic number we came to for $20 million in net income? I don’t know, but 4500 TEU prices were never above $15 thousand for the whole past decade.
It is definitely a bet, on a relatively predictable commoditized market. Supply is on its way, with almost 8 million TEU in order book, representing 30% of the current 25 million TEU supply. Last time, in 2007, orders reached 60% of then 12 million TEU supply.
My personal opinion is that the ship renting market will collapse again. If I were ESEA, I would have repaid debts, hoarded cash, and waited for competitors to come knock the door, fire selling their ships. This is not what ESEA did. I also do not like their management.
For me, ESEA is an easy pass.
Be the first to comment