

EUR/USD TALKING POINTS
- ECB recap – GDP, inflation & rates.
- U.S. CPI in focus later today.
- IG client sentiment: Bearish.
EURO FUNDAMENTAL BACKDROP
Yesterday’s European Central Bank (ECB) rate decision and press conference (although more hawkish) sent the euro tumbling post-announcement. Leading up to the announcement, markets were pricing in a more aggressive stance but the ECB quelled these projections by opening up the potential for a 50bps rate hike in September and not July as many expected. In addition, growth forecasts were revised lower thus weighing on euro upside despite the possibility of the aforementioned 50bps jump. GDP growth revisions read as follows:
- 2.8% in 2022, 2.1% in 2023, and 2.1% in 2024
While the contrary is true for inflation (revised higher), the talk of the town is stagflation (high inflation coupled with declining growth) once more. Brushed of by many last year, the prospect is becoming ever more likely which could have serious downside effects for the euro should it come to fruition.
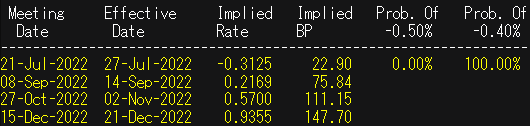
We can see via the table below that money markets have cemented their expectations for 75bps by September which includes a 50bps hike for the month therefore any dovish disappointment (i.e. two 25bps hikes) could seriously push EUR/USD lower.
ECB INTEREST RATE PROBABILITIES
Source: Refinitiv
EUR/USD ECONOMIC CALENDAR
The economic calendar today is dominated by U.S. CPI data for May with much emphasis on the headline figure. Traditionally, core inflation is the preferred measure for the Federal reserve but it seems markets and media favor the headline figure o recent times. The print is forecasted to come in at 8.3% which is the same as April’s print but anything in line or higher could definitely push the euro below 1.0600 today as the U.S. dollar finds support.
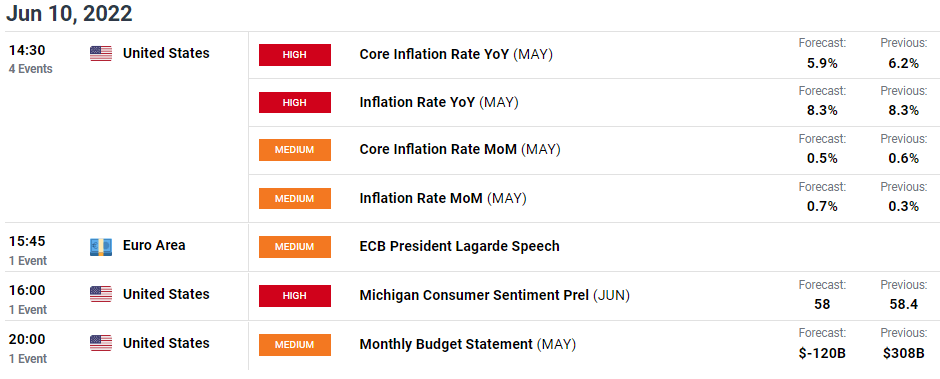
Source: DailyFX economic calendar
TECHNICAL ANALYSIS
EUR/USD DAILY CHART
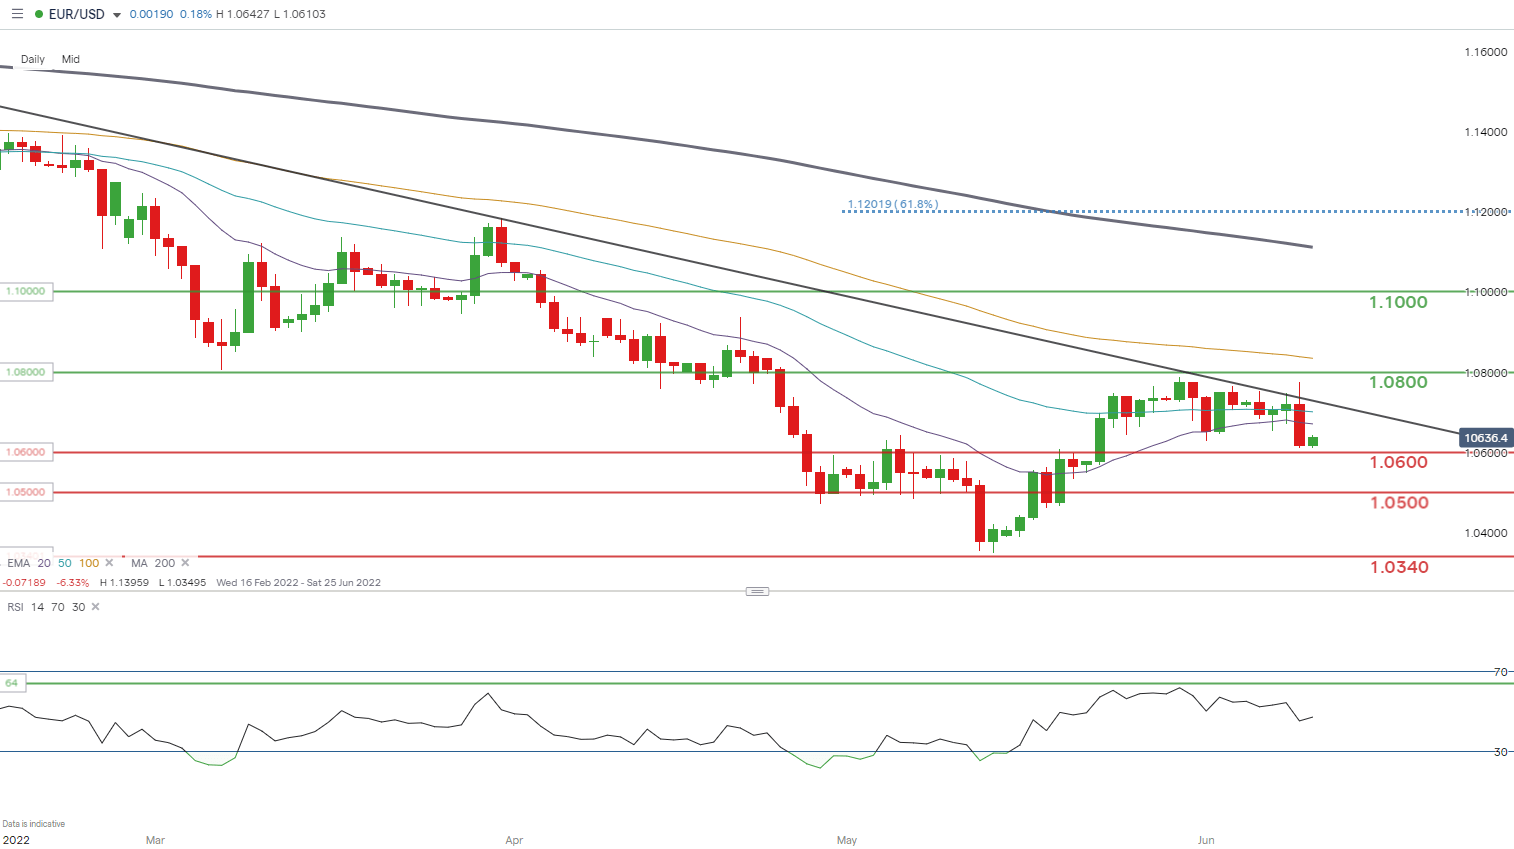
Chart prepared by Warren Venketas, IG
Trendline resistance (black) on the daily EUR/USD chart above has held once again emphasizing its importance since early February 2022. Price action is skewed to the downside and I would not be surprised if we see bears break below 1.0600 towards the 1.0500 psychological zone.
Resistance levels:
Support levels:
IG CLIENT SENTIMENT DATA: BEARISH
IGCS shows retail traders are currently LONG on EUR/USD, with 64% of traders currently holding long positions (as of this writing). At DailyFX we typically take a contrarian view to crowd sentiment resulting in a short-term downside bias.
Contact and follow Warren on Twitter: @WVenketas
Be the first to comment