

Euro, EUR/USD, US Dollar, China, US CPI, Federal Reserve – Talking points
- EUR/USD has retreated from a surge based on US Dollar weakness
- The China story continues to weigh heavily on the market outlook for growth
- If US CPI is a shocker on Thursday, where will it send EUR/USD?
Recommended by Daniel McCarthy
Get Your Free EUR Forecast
EUR/USD TECHNICAL ANALYSIS
EUR/USD rocketed higher last Friday on US Dollar weakness emerging from hopes that China will ease their Covid-19-related lockdowns. These restrictions have hampered business activity in the world’s second-largest economy.
The Euro rallied more than any other ‘big block’ currency units on the speculation, perhaps revealing that market positioning of long US Dollars is more pronounced in the single currency, rather than in Yen, Sterling or Suisse.
These hopes of China re-opening were dashed over the weekend with health authorities there hosing down the rumours and re-affirming that the current practices will be adhered to.
With that in mind, it is not surprising that Monday has brought a reversal in fortunes for EUR/USD, slipping lower at the open.
The more growth-sensitive currencies such as the Australian and New Zealand Dollars were more heavily impacted by the US Dollar strengthening to start the week.
The focus in the week ahead will be US CPI which is due out on Thursday. A Bloomberg survey of economists is showing expectations of 7.9% for the year-on-year print to the end of October. This would be a slight easing from 8.2% previously.
A deviation from the forecast could see an increase in volatility as it may tilt the Federal Reserve from its current path for rate hikes.
Recommended by Daniel McCarthy
How to Trade EUR/USD
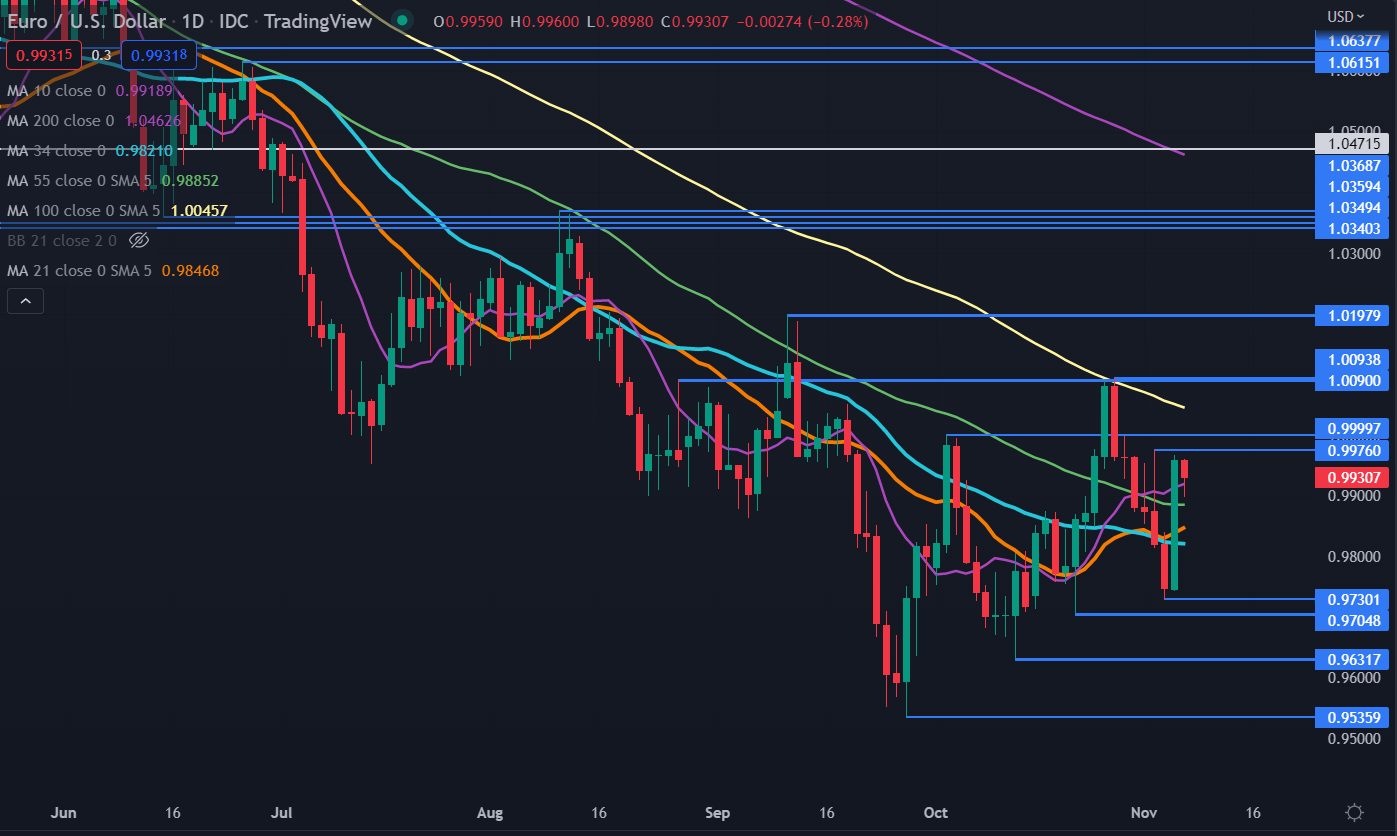
EUR/USD TECHNICAL ANALYSIS
The Euro stalled on its recent run higher just short of the prior peak and a breakpoint at 0.9976 and 1.0000 respectively.
These levels may continue to offer resistance ahead of another break point at 1.0090 which is just below a recent high of 1.0094.
The recent rally has seen the price move above the 10-, 21-, 34- and 55- day simple moving averages (SMA) which may suggest that short and medium-term bearish momentum could be pausing.
A period of consolidation above these SMAs might see all the gradients on them turn positive, which could indicate evolving bullish momentum.
The longer-term 100- and 200-day SMAs remain above the price with negative gradients which may signal that underlying bearish momentum is intact for now.
Support could be at the previous lows at 0.9730, 0.9705, 0.9632 and 0.9536.
— Written by Daniel McCarthy, Strategist for DailyFX.com
To contact Daniel, use the comments section below or @DanMcCathyFX on Twitter
Be the first to comment