

EUR/USD is struggling below the 1.0700 resistance zone. EUR/JPY is rising and might rally further if it clears the 144.20 resistance zone.
Important Takeaways for EUR/USD and EUR/JPY
· The Euro started a fresh decline below the 1.0700 support zone.
· There is a key bearish trend line forming with resistance near 1.0670 on the hourly chart.
· EUR/JPY started a steady increase after it found support near the 141.50.
· There is a major rising channel forming with support near 143.50 on the hourly chart.
EUR/USD Technical Analysis
The Euro struggled to clear the 1.0800 zone and started a fresh decline against the US Dollar. The EUR/USD pair declined below the 1.0740 support to enter a bearish zone.
There was a clear move below the 1.0700 level and the 50 hourly simple moving average. The pair even declined below the 1.0650 level before correcting a few points. The recent low was formed near 1.0637 on FXOpen and the pair is now correcting higher.
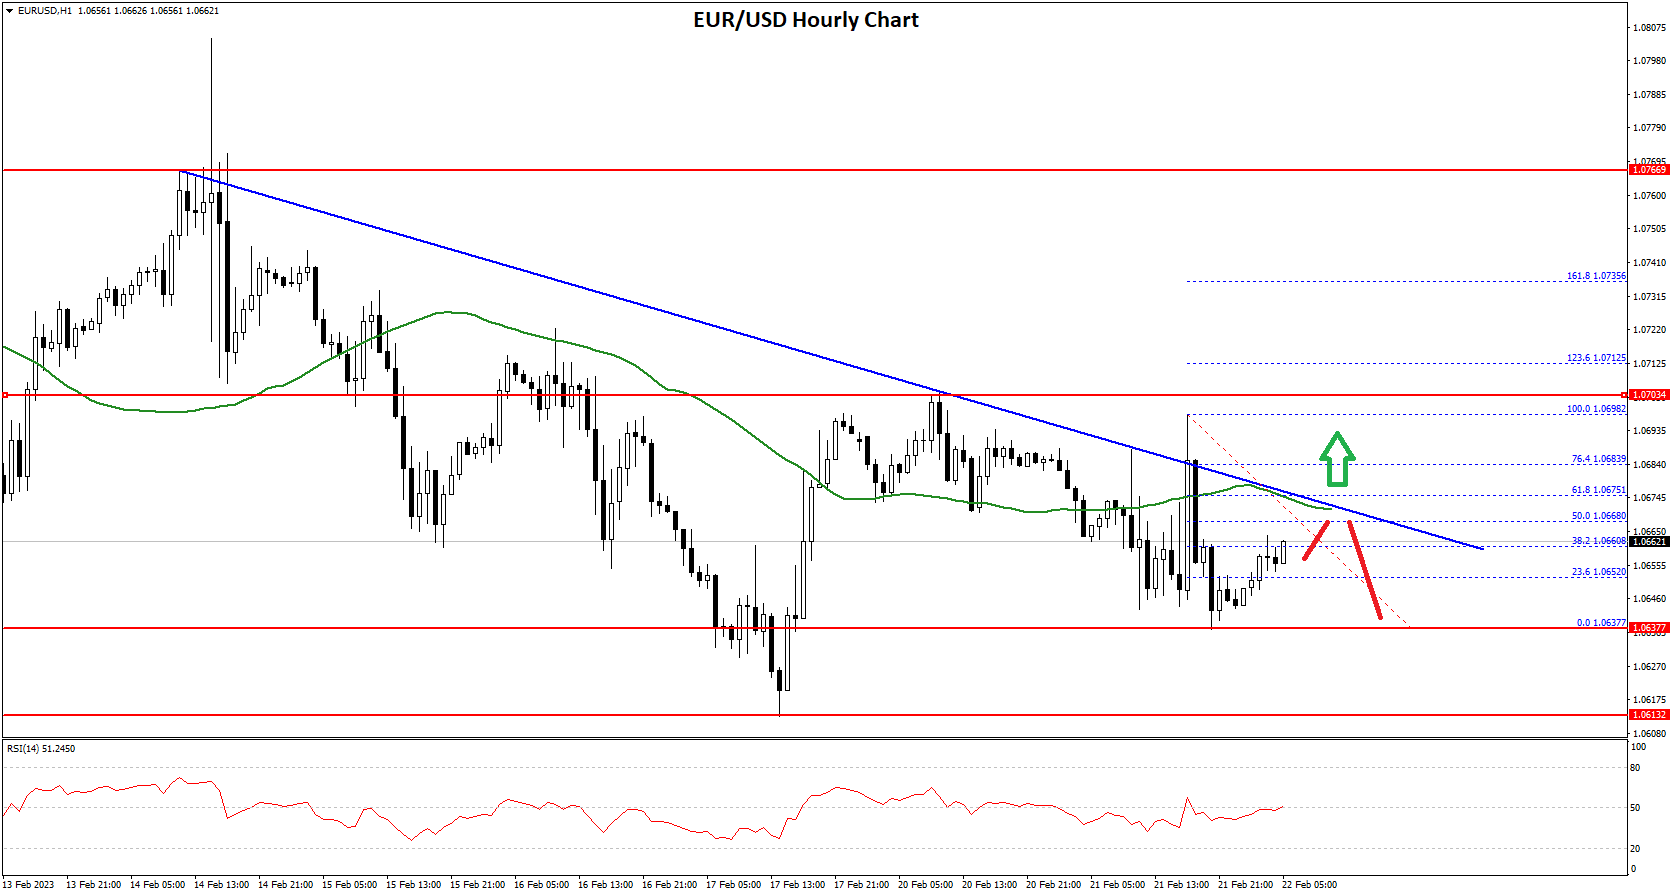
On the upside, an immediate resistance is near the 1.0670 level. There is also a key bearish trend line forming with resistance near 1.0670 on the hourly chart.
The trend line is near the 50% Fib retracement level of the recent decline from the 1.0698 swing high to 1.0637 low. The 50 hourly simple moving average is also near the 1.0670 resistance zone. The next major resistance is near the 1.0685 level.
The 76.4% Fib retracement level of the recent decline from the 1.0698 swing high to 1.0637 low is also near 1.0685. The main resistance is near 1.0700. A clear move above the 1.0700 resistance might send the price towards 1.0750. If the bulls remain in action, the pair could visit the 1.0800 resistance zone in the near term.
On the downside, the pair might find support near the 1.0635 level. The next major support sits near the 1.0610 level, below which the pair could even test the 1.0565 support zone.
If there is a downside break below the 1.0565 support, the pair might accelerate lower in the coming sessions. In the stated case, it could even test 1.0520.
EUR/JPY Technical Analysis
The Euro formed a base above the 141.50 support zone against the Japanese Yen. The EUR/JPY pair started a decent increase above the 142.00 and 142.50 resistance levels.
There was a clear move above the 143.20 level and the 50 hourly simple moving average. The pair traded as high as 144.15 before there was a minor decline. A low is formed near 143.49 and the pair is now rising.
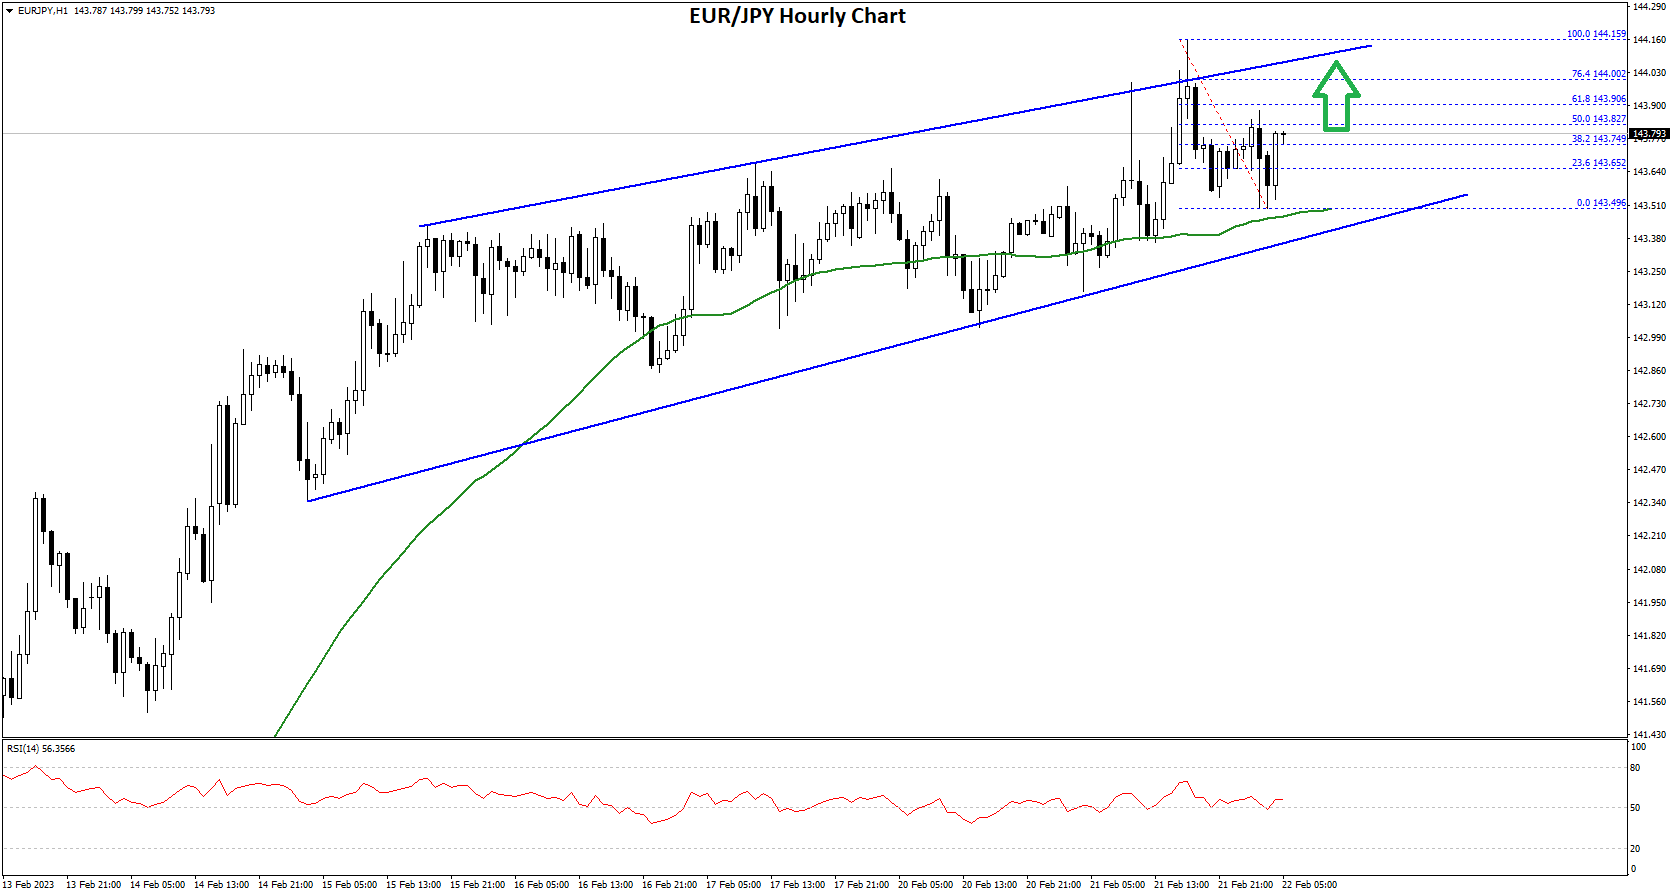
An immediate resistance on the upside is near the 143.80 level. It is near the 50% Fib retracement level of the recent decline from the 144.15 swing high to 143.49 low.
The next major resistance could be near the 144.00 level. If there is an upside break above the 144.00 resistance, the pair could test the 144.50 resistance. Any more gains might send the pair towards the 145.00 level.
On the downside, the pair might find support near the 143.50 level. There is also a major rising channel forming with support near 143.50 on the hourly chart. The next major support is near 143.20. Any more losses could lead the pair towards the 142.50 support level in the near term.
This forecast represents FXOpen Companies opinion only, it should not be construed as an offer, invitation or recommendation in respect to FXOpen Companies products and services or as financial advice.
Trade global forex with the best ECN broker of 2021*.
Choose from 50+ forex markets 24/5.
Open your FXOpen account now or learn more about making your money go further with FXOpen.
* FXOpen International, best ECN broker of 2021, according to the IAFT

Be the first to comment