

Bet_Noire/iStock via Getty Images
As we move from the Powell-is-the-new-Volcker era (which ushered in the bear market) to the recession-will-force-a-Fed-pivot mindset from mid-June until now (which resulted in the S&P recover roughly 50% of this year’s drawdown and even spawning a technical bull market in the Nasdaq), the question is: What will the next narrative be?
Barring a severe liquidity event, which is a very real possibility we’ll discuss in the second half of this article, the coming market zeitgeist will be the Fed-is-pivoting-too-early phase. Before discussing what that means, let’s briefly assess the state of the market. Despite the recent rebound, there remains quite a bit of dry powder on the sidelines. We can see this through various indicators. Look at cash levels reported in BofA’s Fund Manager Survey:
Bank of America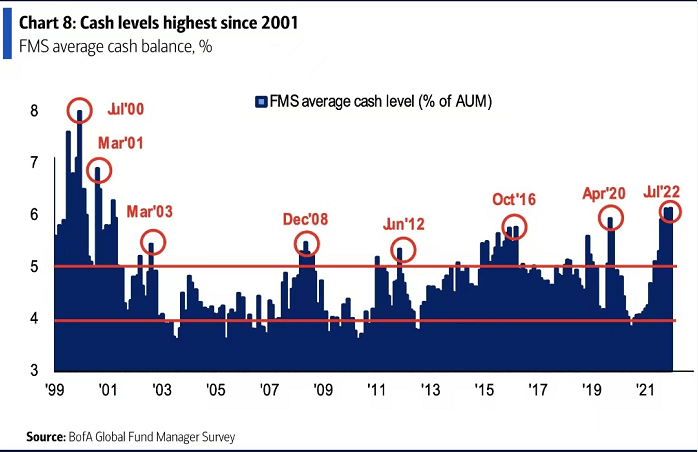
They’ve touched 20-year highs and plateaued the last couple of months. Now have a look at gross exposure of commodity trading advisors, provided by Nomura:
Nomura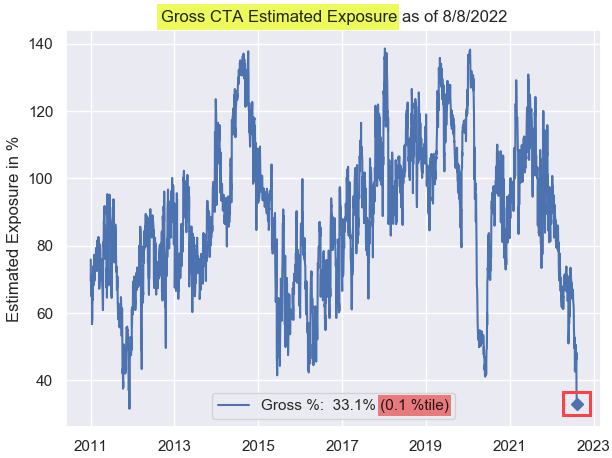
Gross exposure treats both long and short positions as positive exposure, so this measures total capital invested. Still, these funds are estimated to have 33.1% invested, levels not seen since 2011.
Lastly, leverage has moderated substantially. Here’s net leverage among hedge funds provided by Goldman Sachs:
Goldman Sachs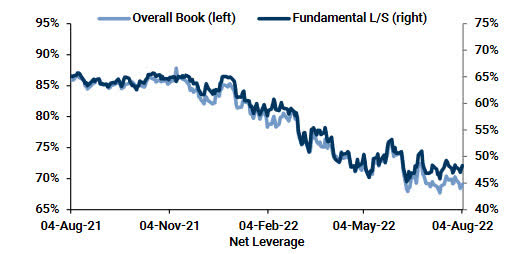
It’s in the bottom one percentile for the year. Not only are we seeing decade highs in sidelined capital, but funds have ample runway for margin debt as well. All three of the above charts were released in August, so the data is fresh.
The bottom line is that stocks could move higher – much higher. But which stocks? Enter the Fed-is-pivoting-too-early narrative, which hinges on inflation.
Yes, inflation has moderated, largely pulled down by energy prices as President Biden drew down the national oil reserves. BLS reported 0% month-over-month inflation for July. However, even with sustained 0% MoM inflation, this leaves the headline print at 6.54% annually at the start of next year:
Bianco Research LLC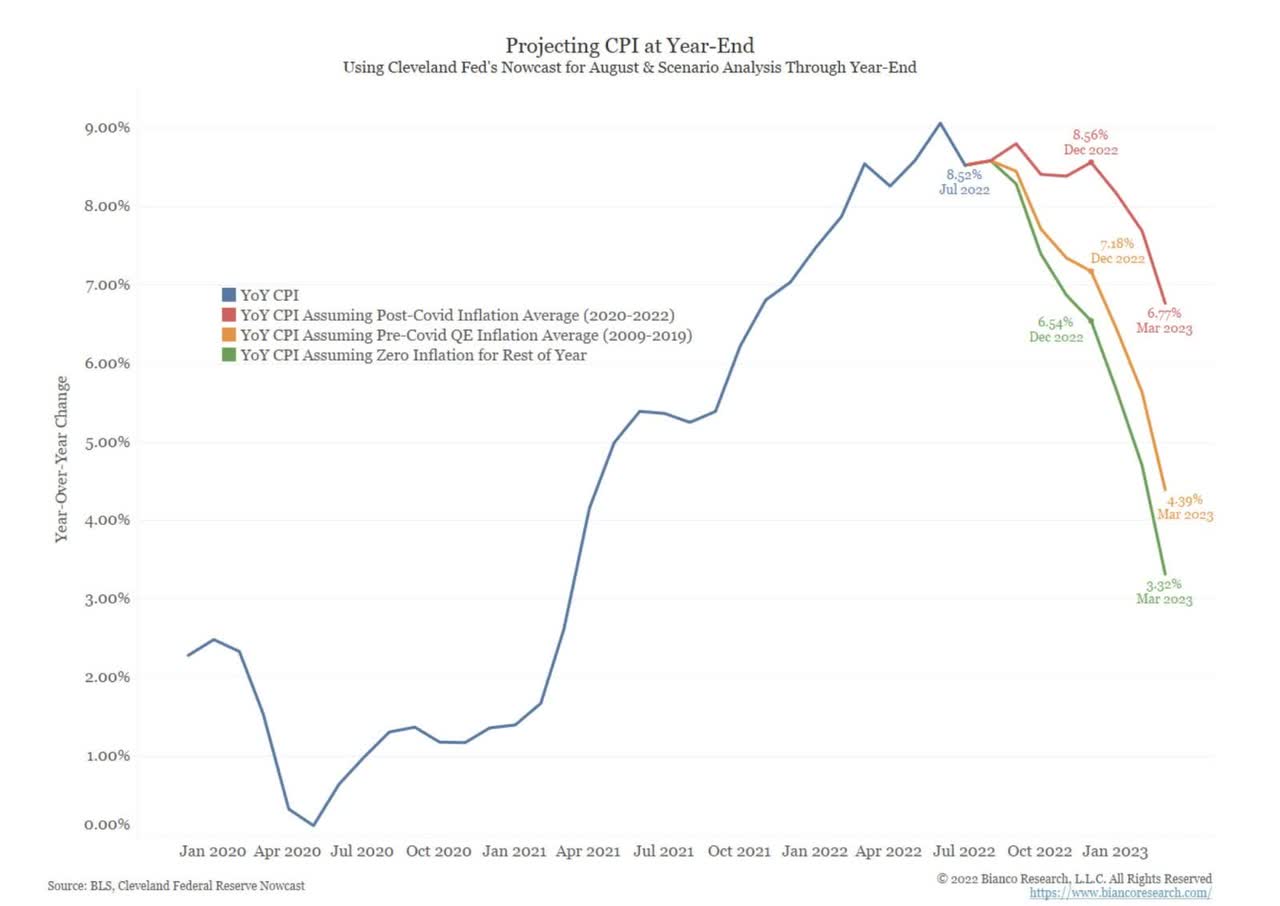
As I wrote last month, this is right around the time the market is pricing in Fed rate cuts. And remember, 0% inflation is somewhat of a best-case scenario. It might prove stickier as head of energy research at Goldman Damien Courvalin has just called for $130 per barrel by end of year, roughly a 30% increase from current levels.
So our best-case scenario is that the Fed starts easing amid inflation with a 6-handle. Markets will come to this realization eventually. Though it might take a shift in rhetoric from key FOMC members or another disinflationary CPI print to take hold, when it happens it will usher in the Fed-is-pivoting-too-early narrative regime.
The asset you’ll want to own ahead of that realization will, without a doubt, be gold:
-
Historically proven inflation hedge (even if the last two years have been wonky).
-
Least demand-driven commodity (unlike copper or oil), which will prove beneficial as the real economy weakens.
-
Gold markets seem more forward looking than others, hence 2021’s underperformance as traders anticipated this year’s hiking cycle.
-
Mining stocks have barely recovered from their 52-week lows.
I’m long the VanEck Vectors Gold Miners ETF (GDX), and will be adding to it on dips.
Now for the market crash scenario and why we also want some volatility exposure. Most agree that between historically high debt levels and the fastest Fed hiking cycle on record (on a percentage basis), something’s gotta give:
Federal Reserve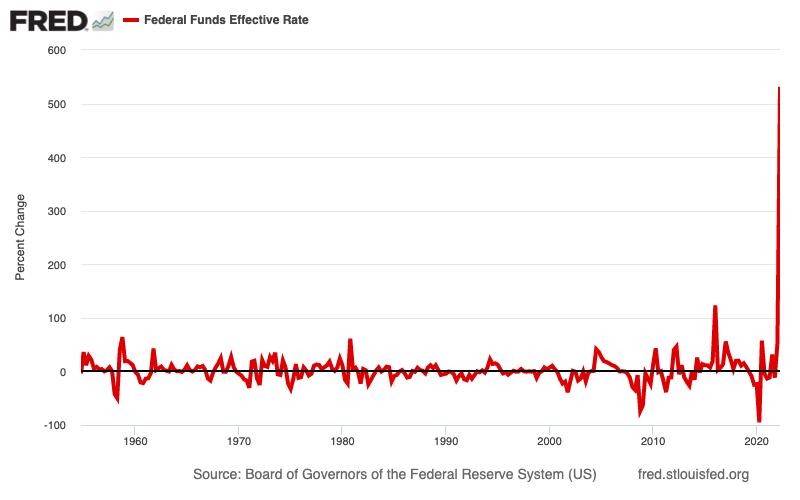
Granted, we started from nearly 0% so measuring on a percentage basis is bound to skew the data (but it’s a fun chart). Still, on a nominal basis we’ve hiked the Fed funds rate by 225 bps in 5 months, a pace not seen since 1981 when Volcker himself was at the helm.
Perhaps more interesting and certainly under-discussed is what global cumulative flows reveal about this year’s downturn. From the Goldman Investment Research Division:
Goldman Sachs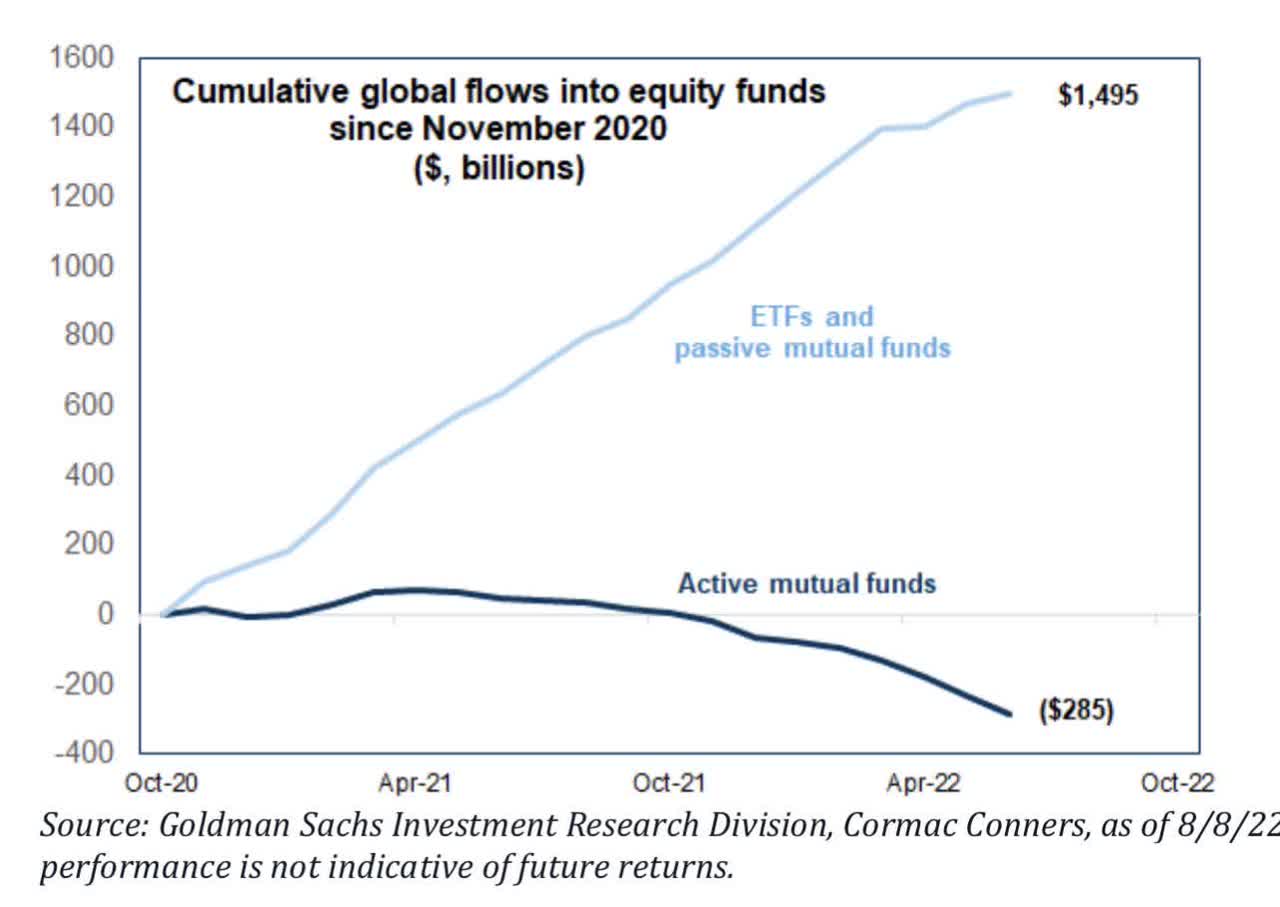
Initial outflows from actively managed funds coincide perfectly with the market’s year end plateau in 2021. On the other hand, passive investment vehicles have yet to experience a single month of net outflows.
Facing outflows, unlike ETFs and passive funds, active fund managers will not simply liquidate their holdings as fast as possible and hit the market bid. Instead, they use various techniques to move large volumes so as not to collapse the price. This explains the low-volatility decline we’ve seen this year (the VIX never touched 40):
YCharts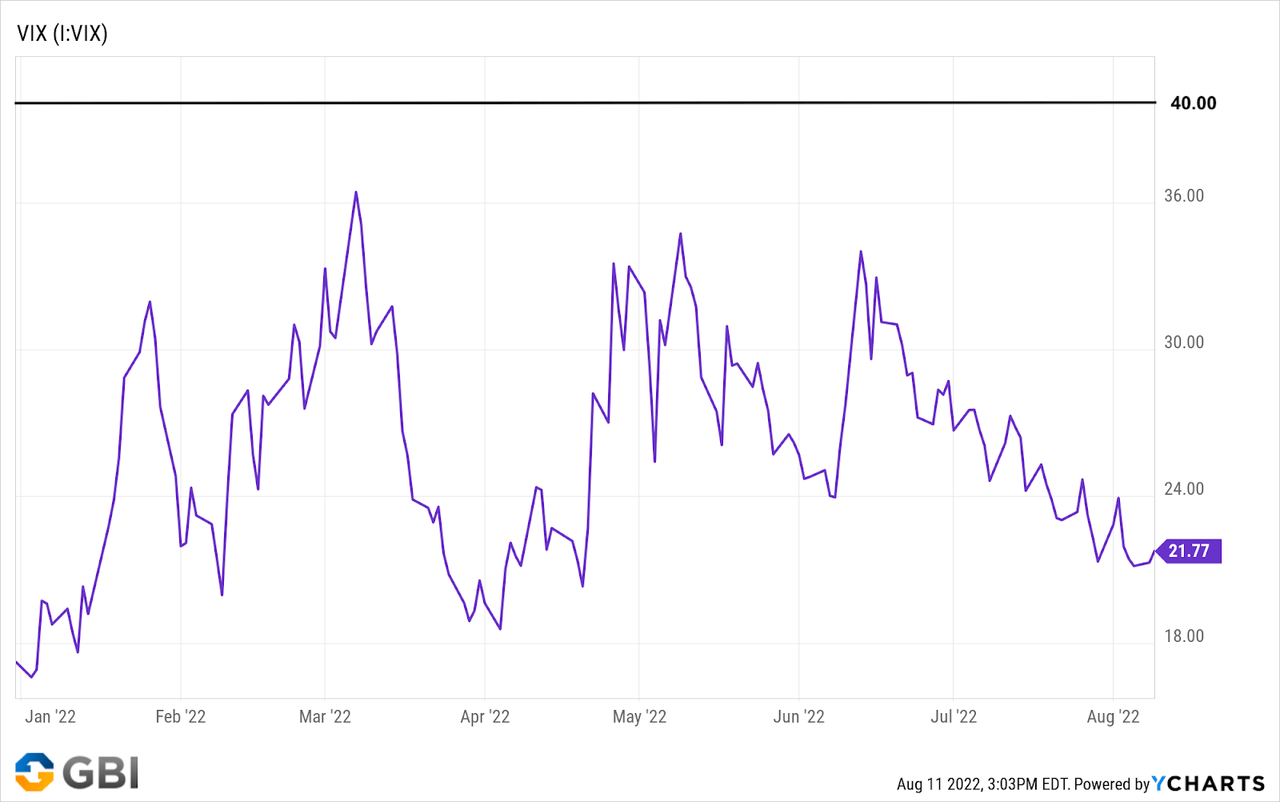
So the question is: When could “The Big Three” passive behemoths (Vanguard, Blackrock, and State Street) start seeing outflows, and how volatile could things get with massive non-discretionary sellers? To get an idea of what might trigger such an event, consider the average passive investor.
According to Vanguard’s “How America Saves” report, the median account balance for all clients in 2021 was $35,345 and $25,775 in 2019. Vanguard states the increase was “driven primarily by the increase in equity markets.” Given we are still roughly 10% off the highs of 2021, we can assume the firm’s median balance is somewhere around $32k. The bottom line: Middle to lower-middle income investors make up the bulk of passive investors.
Why is this important? These income brackets are getting hit hard. The following is hardly an exhaustive list:
-
Inflation squeezing consumers at the grocery store and gas pump.
-
Mortgage rates that have roughly doubled from a year ago.
-
The steady increase in jobless claims and layoff announcements across the board.
-
Much of the employment gains last month were multiple job holders (a sign of financial stress).
-
Overwhelming non-essential inventories at retail stores due to, according to Walmart (WMT), “higher prices consumers are paying for food and gasoline are cutting into their ability to buy other items.”
-
Record credit card debt levels (presumably being used on gas and groceries given the huge inventories).
The pain being inflicted on the middle class could catalyze a necessity-driven mass exodus from passive funds. And, as discussed, there is no strategic unwind process for ETFs and index funds.
Even more ominous, a recent Harvard Business School study suggests passive’s market share is likely far greater than most estimates and has more than doubled in the last decade.
marcosammon.com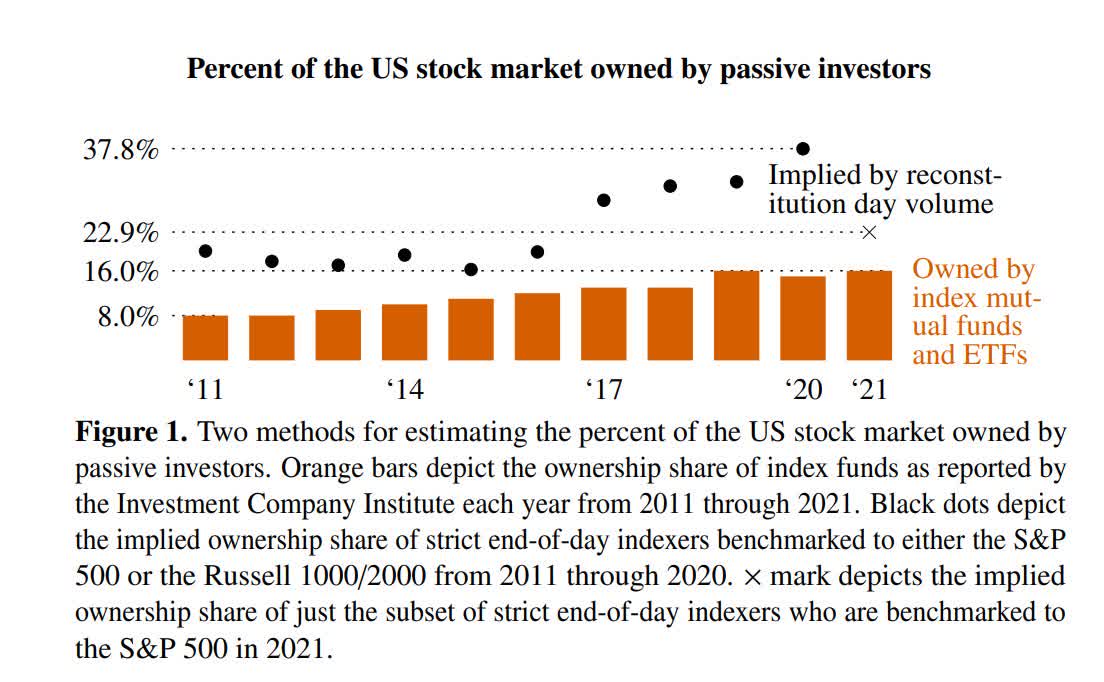
In other words, the 2008 crash (more than 50% drawdown in most major indices) did not occur under the passive-dominant regime we see today. Given there hasn’t been a serious crash since then, we don’t really know what this could look like.
I can say one thing – sitting 10% off all-time highs during the most aggressive Fed hiking cycle in 40 years doesn’t sound reassuring. The GDX on the other hand, remaining 30% off its 52-week high, looks more attractive.
Be the first to comment