

EUR/USD Rate Talking Points
EUR/USD appears to be on track to test the monthly high (1.1640) despite the rebound in longer-dated US Treasury yieldsas the Relative Strength Index (RSI) recovers from oversold territory.
EUR/USD Rate Eyes Monthly High as RSI Recovers from Oversold Zone
EUR/USD stages a near-term correction following the kneejerk reaction to the US Consumer Price Index (CPI), and as mixed data prints coming out of the US economy dampen bets for an imminent shift in Federal Reserve policy.
However, recent remarks from Richmond Fed President Thomas Barkin, who votes on the Federal Open Market Committee (FOMC) this year, suggest the recent developments will do little to derail the central bank from scaling back monetary support as the official insists that the committee will “have a discussion in November on tapering.”
During an interview on CNBC, Barkin acknowledged that the US economy has “come a long way on both the labor market and certainly on inflation,” but went onto say that the Fed will “learn a lot over the next several months” in response to the timing of a rate hike.
It seems as though the FOMC will revert to a wait-and-see approach after winding down its quantitative easing (QE) program as the central bank looks at a “defined sequence” of normalizing monetary policy, and it remains to be seen if Chairman Jerome Powell and Co. will implement higher interest rates in 2022 as the central bank insists that “a gradual tapering process that concludes around the middle of next year is likely to be appropriate.”
In turn, the US Dollar may face additional headwinds ahead of the next FOMC rate decision on November 3 as the weaker-than-expected Non-Farm Payrolls (NFP) report warns of a slowing recovery, but a larger recovery in EUR/USD may continue to alleviate the tilt in retail sentiment like the behavior seen earlier this year.
The IG Client Sentiment report shows 61.77% of traders are currently net-long EUR/USD, with the ratio of traders long to short standing at 1.62 to 1.
The number of traders net-long is 3.44% higher than yesterday and 0.11% higher from last week, while the number of traders net-short is 12.93% higher than yesterday and 5.04% higher from last week. The marginal rise in net-long position comes as EUR/USD appears to be on track to test the monthly high (1.1640), while the increase in net-short interest has helped to alleviate the tilt in retail sentiment as 63.01% of traders were net-long the pair last week.
With that said, the rebound from the monthly low (1.1525) may turn out to be a correction in the broader trend as EUR/USD trades to fresh yearly lows in the second half of 2021, but the exchange rate may stage a larger correction over the coming days as the Relative Strength Index (RSI) recovers from oversold territory.
EUR/USD Rate Daily Chart
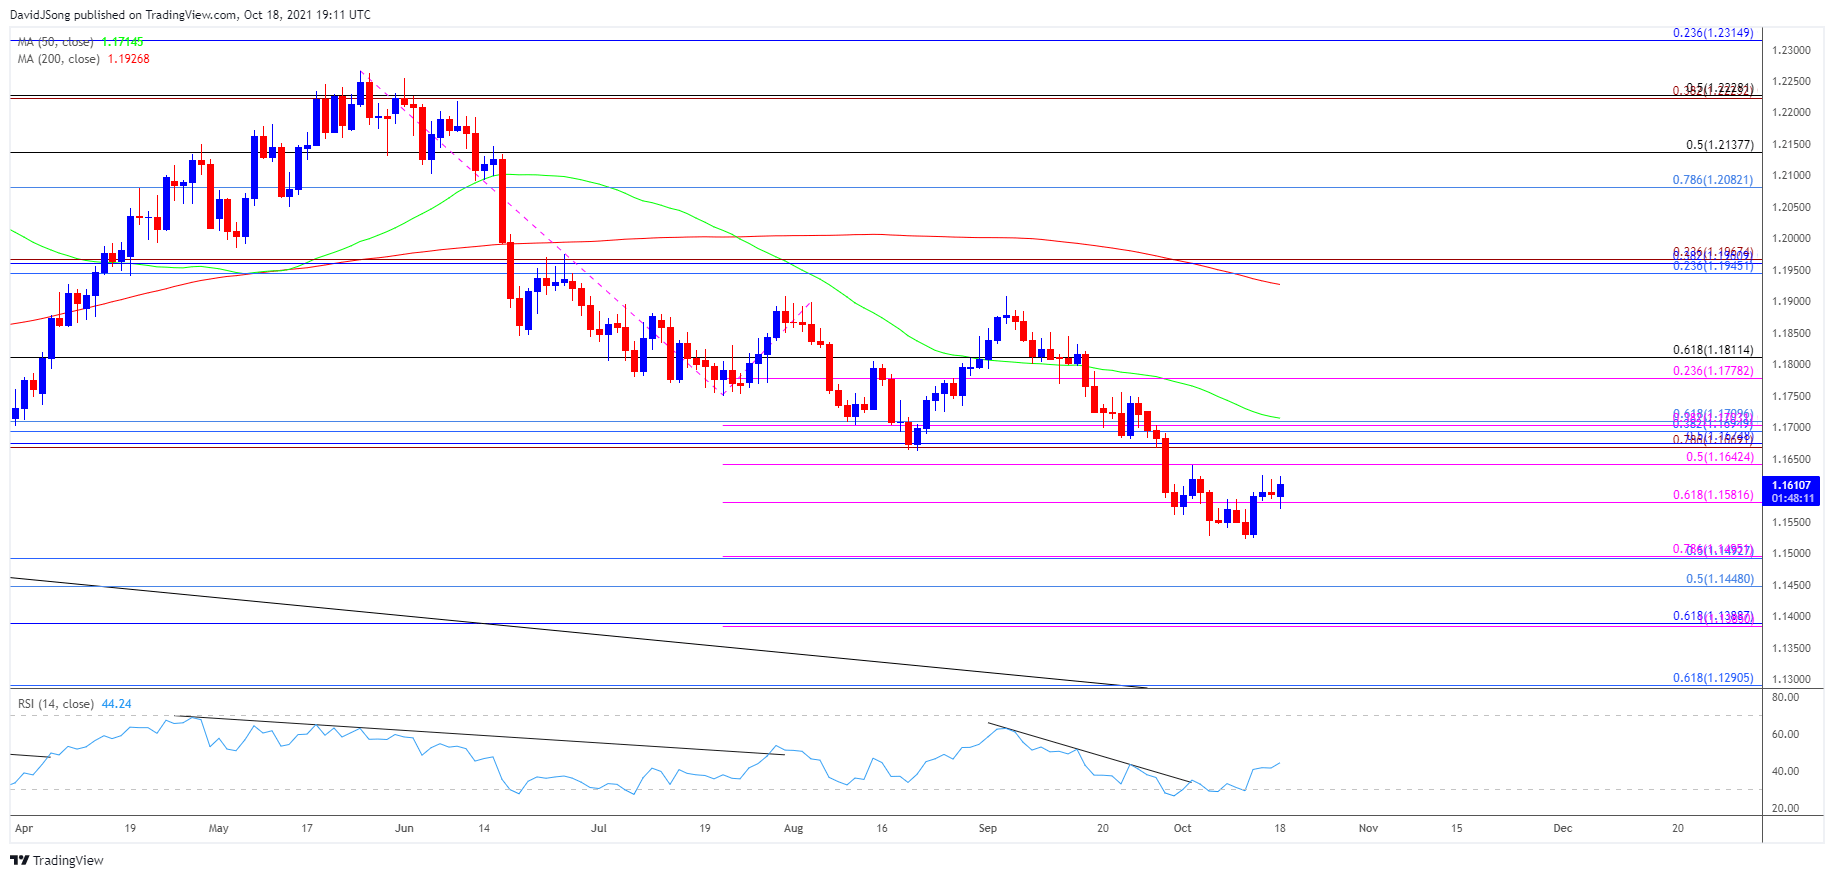
Source: Trading View
- Keep in mind, EUR/USD sits below the 200-Day SMA (1.1927) for the first time since April as the advance from the March low (1.1704) failed to produce a test of the January high (1.2350), with the exchange rate trading to a fresh yearly low (1.1563) in September, which pushed the Relative Strength index (RSI) into oversold territory.
- The bearish price action continued to take shape in October as EUR/USD slipped to a fresh yearly low (1.1525), but a textbook RSI buy signal emerged as at the start of the month as the oscillator climbed above 30, and the exchange rate may stage a larger recovery as the indicator continues to recover from oversold territory.
- The failed attempt to test the Fibonacci overlap around 1.1440 (78.6% expansion) to 1.1490 (50% retracement) has pushed EUR/USD back towards the 1.1610 (50% expansion) region, with a break of the monthly high (1.1640) opening up the overlap around 1.1670 (78.6% expansion) to 1.1710 (61.8% retracement).
- A move above the 50-Day SMA (1.1715) brings the 1.1770 (23.6% expansion) to 1.1810 (61.8% retracement), with a break of the September high (1.1909) bringing the 200-Day SMA (1.1927) on the radar.
— Written by David Song, Currency Strategist
Follow me on Twitter at @DavidJSong
Be the first to comment