

EUR/USD is facing resistance near the 1.1050 and 1.1080 levels. USD/CHF could gain pace if there is a move above the 0.9375 resistance.
Important Takeaways for EUR/USD and USD/CHF
· The Euro started a downside correction from the 1.1140 resistance zone against the US Dollar.
· There is a key bearish trend line with resistance near 1.1040 on the hourly chart of EUR/USD.
· USD/CHF formed a base above the 0.9300 support zone and corrected higher.
· There was a break above a major bearish trend line with resistance near 0.9330 on the hourly chart.
EUR/USD Technical Analysis
The Euro gained pace above the 1.1000 resistance level against the US Dollar. The EUR/USD pair even gained pace above the 1.1100 resistance level.
It traded as high as 1.1139 on FXOpen before the pair started a downside correction. There was a sharp decline below the 1.1100 and 1.1020 support levels. The pair even spiked below 1.1000 and traded as low as 1.0916.
EUR/USD is now rising and trading above 1.1000. There was a break above the 50% Fib retracement level of the recent decline from the 1.1071 swing high to 1.0961 low.
It is now consolidating above the 1.1020 level and the 50 hourly simple moving average. On the upside, an initial resistance is near the 1.1040 level. There is also a key bearish trend line with resistance near 1.1040 on the hourly chart of EUR/USD.
The next major resistance is near the 1.1070 zone. A clear upside break above the 1.1070 zone could open the doors for a steady move. The next major resistance sits near the 1.1140 level.
On the downside, an immediate support is near the 1.1015 level. The next major support is near the 1.0950 level. A downside break below the 1.0950 support could start another decline.
USD/CHF Technical Analysis
The US Dollar started a fresh decline after it failed to clear the 0.9460 resistance zone against the Swiss franc. The USD/CHF pair declined below the 0.9375 support zone to move into a bearish zone.
The pair tested the 0.9300 support and formed a low near 0.9293. It is now rising and trading above 0.9320. There was a move above the 23.6% Fib retracement level of the key decline from the 0.9460 swing high to 0.9293 low.
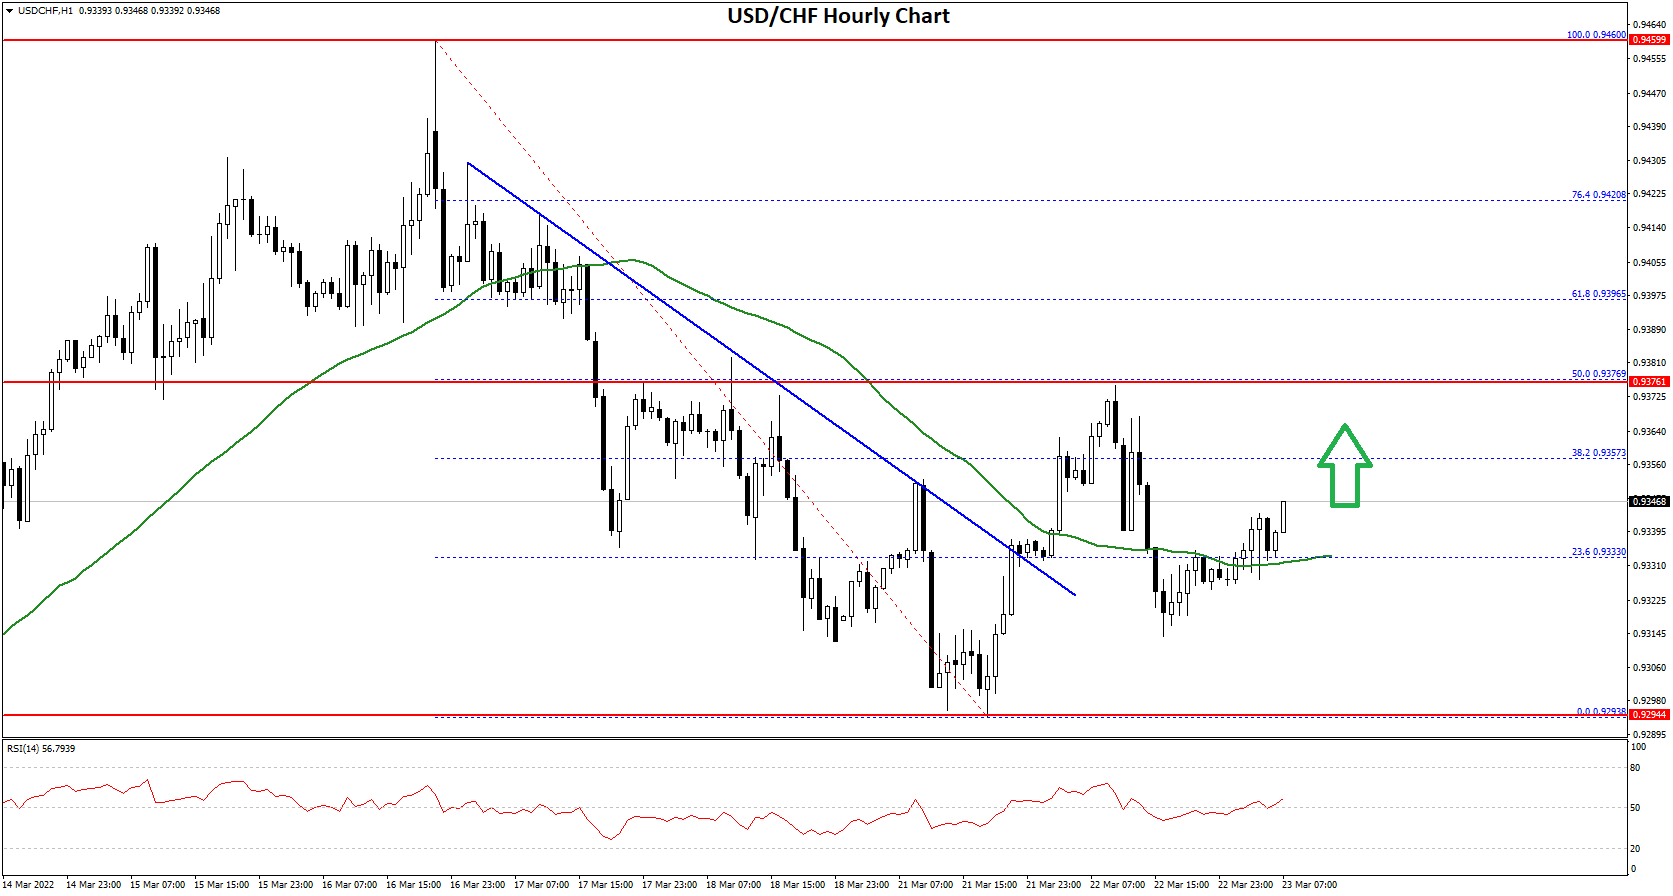
Besides, there was a break above a major bearish trend line with resistance near 0.9330 on the hourly chart. It is now consolidating above 0.9335 and the 50 hourly simple moving average.
It is now facing resistance near the 0.9350 level. The next major resistance is near the 0.9375 level. It is near the 50% Fib retracement level of the key decline from the 0.9460 swing high to 0.9293 low.
If there is a clear break above the 0.9375 resistance zone, the pair could start another increase. The next major resistance is near the 0.9420. Any more gains could send the pair towards the 0.9460 level in the near term.
On the downside, the pair might find bids near the 0.9320 level. The main support is now forming near the 0.930 level. Any more losses may possibly open the doors for a move towards the 0.9250 level. The next major support below 0.9250 is near the 0.9200.
This forecast represents FXOpen Markets Limited opinion only, it should not be construed as an offer, invitation or recommendation in respect to FXOpen Markets Limited products and services or as financial advice.

Be the first to comment