

EUR/USD Price, Chart, and Analysis
- EUR/USD is unable to break through the parity wall.
- ECB monetary policy accounts are released later.
Recommended by Nick Cawley
Get Your Free EUR Forecast
The Euro’s struggle against the US dollar continues in early European trade with the pair back below 0.9900 after testing and failing to break through parity (1.0000) on Wednesday. The latest bout of Euro weakness stems from recent reports that Germany is breaking EU ranks and providing a EUR200 billion emergency finance package to protect the country’s businesses and consumers from soaring energy costs. This unilateral action has not gone down well with the European Commission and various member states who feel that Germany is using its fiscal weight to borrow and spend, leaving less wealthy EU members at a disadvantage.
The latest ECB monetary policy minutes are released at 12:30 BST and should provide more clarity about the central bank’s view of the economy moving forward. The ECB hiked its policy rates by 75 basis points on September 8 and revised higher their inflation forecasts. Financial markets now expect the central bank to hike rates by a further 75 basis points at the October 27 meeting and to continue to increase rates going into the end of the year.
For all market-moving economic releases and events, see the DailyFX Calendar
EUR/USD remains below 1.0000 and is likely to remain sub-parity going forward. The Euro remains weak and is likely to stay that way, while the US dollar is starting to pick back up from its recent low as Federal Reserve board members continue to preach the central bank’s mantra of higher rates for longer. The recent talk of a potential Fed pivot at its next monetary policy meeting is now seen as highly unlikely as the central bank remains determined to break the back of inflation, even if it means sending the economy into a short-term recession.
Trade Smarter – Sign up for the DailyFX Newsletter
Receive timely and compelling market commentary from the DailyFX team
Subscribe to Newsletter
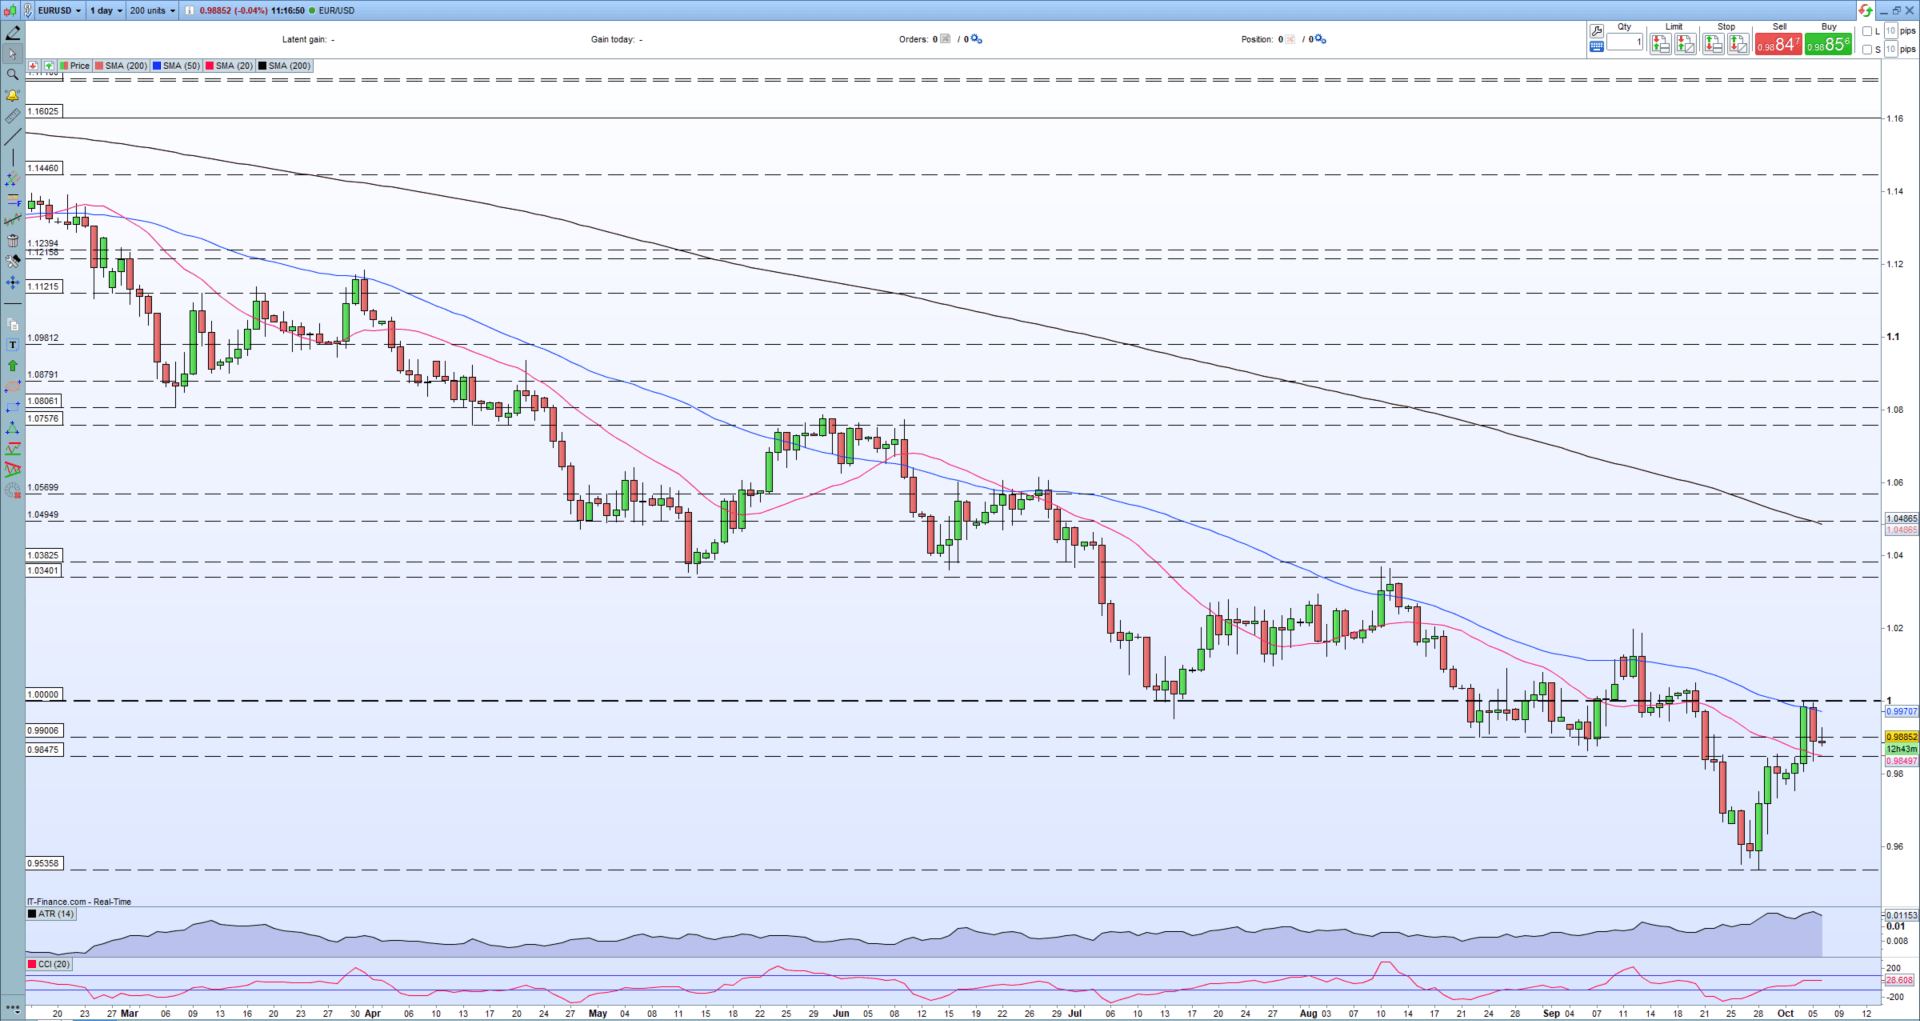
Looking at the daily EUR/USD chart, the latest rejection of parity also coincides with both the 50-day simple moving average. The longer-term series of lower highs and lower lows remain in place, while a break below the 0.9850 level would open the way for a further decline. The 20-year EUR/USD low at 0.9536 and this level may come threat again in the coming weeks.
EUR/USD Daily Price Chart October 6, 2022
Retail trader data show that 55.03% of traders are net-long with the ratio of traders long to short at 1.22 to 1.The number of traders net-long is 15.12% higher than yesterday and 17.72% lower from last week, while the number of traders net-short is 11.60% lower than yesterday and 48.63% higher from last week.
We typically take a contrarian view to crowd sentiment, and the fact traders are net-long suggests EUR/USD prices may continue to fall. Positioning is more net-long than yesterday but less net-long from last week. The combination of current sentiment and recent changes gives us a further mixed EUR/USD trading bias.
| Change in | Longs | Shorts | OI |
| Daily | 9% | -7% | 1% |
| Weekly | -24% | 49% | -1% |
What is your view on the EURO – bullish or bearish?? You can let us know via the form at the end of this piece or you can contact the author via Twitter @nickcawley1.
Be the first to comment