

EUR/USD gained pace above the 1.0200 resistance zone. USD/CHF is declining and remains at a risk of more losses below the 0.9200 support.
Important Takeaways for EUR/USD and USD/CHF
· The Euro started a fresh increase above the 1.0200 resistance against the US Dollar.
· There was a break above a major bearish trend line with resistance near 0.9880 on the daily chart of EUR/USD.
· USD/CHF started a fresh decline below the 0.9750 and 0.9400 support levels.
· There was a break below a key rising channel with support near 0.9840 on the daily chart.
EUR/USD Technical Analysis
This week, the Euro started a steady increase from the 0.9600 zone against the US Dollar. The EUR/USD pair gained pace above the 1.0000 level to move into a bullish zone.
The pair even climbed above the 1.0200 resistance and settled above the 50-day simple moving average. During the increase, there was a break above a major bearish trend line with resistance near 0.9880 on the daily chart of EUR/USD.
Moreover, there was a move above the 1.0500 level. It traded as high as 1.0735 on FXOpen and is currently consolidating gains. There was a move below the 1.0650 level. The pair traded below the 23.6% Fib retracement level of the upward move from the 1.0223 swing low to 1.0735 high.
On the downside, an immediate support is near the 1.0500 level. The 50% Fib retracement level of the upward move from the 1.0223 swing low to 1.0735 high is also near the 1.0500 zone.
The next major support is near the 1.0220 level. A downside break below the 1.0220 support could start another decline towards the 1.0000 handle.
An immediate resistance is near the 1.0750 level. The next major resistance is near the 1.0800 level. A clear move above the 1.0800 resistance zone could set the pace for a larger increase towards 1.1000. The next major resistance is near the 1.1200 zone.
USD/CHF Technical Analysis
The US Dollar started a fresh decline from well above the 1.0000 level against the Swiss franc. The USD/CHF pair traded below the 0.9800 support to move into a bearish zone.
There was a clear move below the 0.9650 support and the 50 hourly simple moving average. During the decline, there was a break below a key rising channel with support near 0.9840 on the daily chart. The pair even broke the 76.4% Fib retracement level of the upward move from the 0.9370 swing low to 1.0147 high.
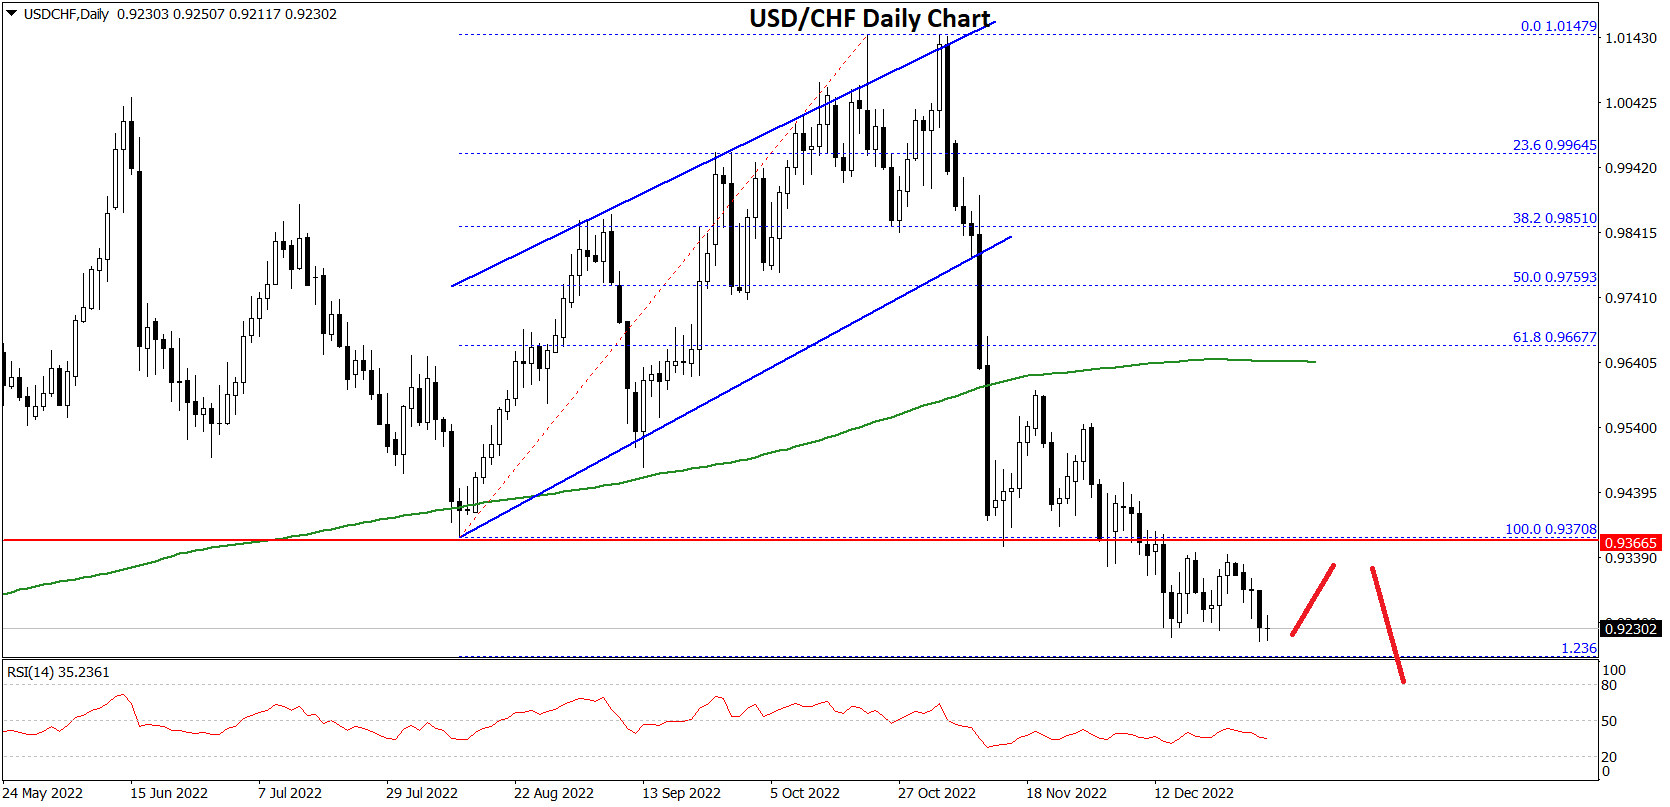
The pair is now trading below the 0.9400 level. An immediate resistance is near the 0.9370 level. The next major resistance is near the 0.9450 level.
If there is a clear break above the 0.9450 resistance zone, the pair could start another increase. In the stated case, it could test 0.9600. Any more gains might send the pair towards the 0.9800 level.
On the downside, an immediate support is near the 0.9200 level. The next major support is near the 0.9120 level. Any more losses may possibly open the doors for a move towards the 0.9000 level or even 0.8800 in the coming weeks.
This forecast represents FXOpen Companies opinion only, it should not be construed as an offer, invitation or recommendation in respect to FXOpen Companies products and services or as financial advice.
Trade global forex with the best ECN broker of 2021*.
Choose from 50+ forex markets 24/5.
Open your FXOpen account now or learn more about making your money go further with FXOpen.
* FXOpen International, best ECN broker of 2021, according to the IAFT

Be the first to comment