

EUR/USD failed to recover and declined below the 1.1620 support. EUR/JPY is facing a major resistance near the 132.50 and 132.65 levels.
Important Takeaways for EUR/USD and EUR/JPY
· The Euro gained bearish momentum below 1.1620 and 1.1600.
· There was a break below an ascending channel with support near 1.1600 on the hourly chart.
· EUR/JPY is attempting a recovery wave above the 132.30 resistance level.
· There is a key bearish trend line forming with resistance near 132.65 on the hourly chart.
EUR/USD Technical Analysis
The Euro started another decline after it struggled to clear the 1.1665 resistance against the US Dollar. The EUR/USD pair broke the 1.1620 support zone to move into a bearish zone.
The pair even traded below the 1.1600 support and settled below the 50 hourly simple moving average. A low was formed near 1.1585 on FXOpen and the pair is now correcting losses. It is currently facing resistance near the 1.1600 level.
The 23.6% Fib retracement level of the downward move from the 1.1664 swing high to 1.1585 low. The first major resistance on the upside is near the 1.1620 level and the 50 hourly simple moving average.
The 1.1620 resistance is also close to the 50% Fib retracement level of the downward move from the 1.1664 swing high to 1.1585 low. A clear break above the 1.1620 resistance could push EUR/USD towards 1.1665.
On the downside, the 1.1585 level is a major support. Any more losses might lead EUR/USD towards the 1.1525 support zone in the near term. The next major support sits near the 1.1500 level.
EUR/JPY Technical Analysis
The Euro started a fresh decline from well above 133.20 against the Japanese Yen. The EUR/JPY pair traded below the 132.65 support zone to move into a bearish zone.
There was a break below the 132.00 support zone and the 50 hourly simple moving average. The pair tested the 131.85 zone and a low is formed near 131.85. It is now attempting a recovery wave above the 132.00 resistance.
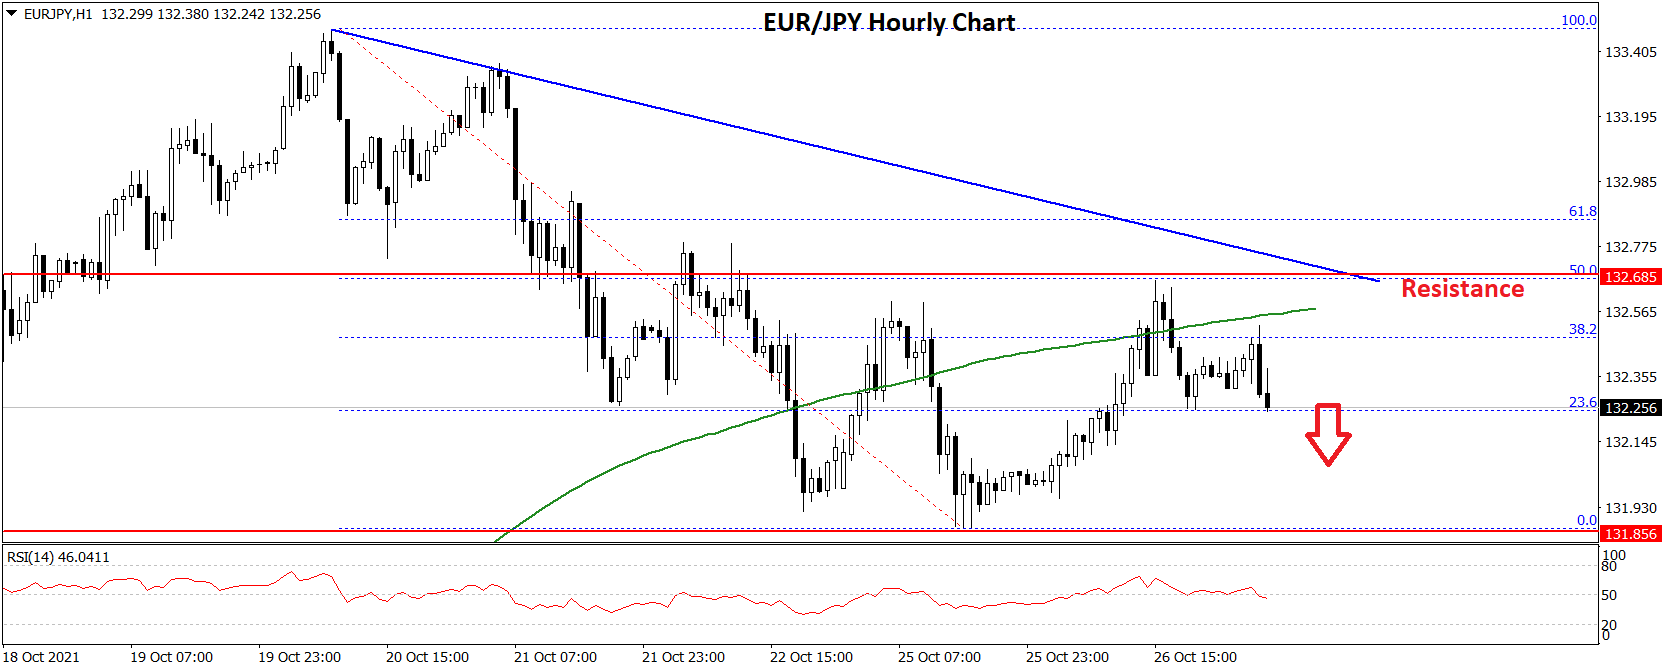
It surpassed the 23.6% Fib retracement level of the main decline from the 133.47 high to 131.85 low. An immediate resistance is near the 132.50 level and the 50 hourly SMA.
The first key resistance is near 132.65. There is also a key bearish trend line forming with resistance near 132.65 on the hourly chart. The trend line is close to the 50% Fib retracement level of the main decline from the 133.47 high to 131.85 low.
If there is an upside break above the 132.65 resistance, the pair could start a decent recovery above 132.80. The next major resistance could be near the 133.40 level. Any more gains could lead the pair towards the 134.00 level.
On the downside, an initial support is near the 132.00 level. The first major support is near the 131.85 level. A downside break below the 131.85 level could spark another major decline.
The next major support is near the 131.20 level. Any more losses could lead the pair towards the 130.50 support level in the near term. The main breakdown support sits near the 130.00 level.
This forecast represents FXOpen Markets Limited opinion only, it should not be construed as an offer, invitation or recommendation in respect to FXOpen Markets Limited products and services or as financial advice.

Be the first to comment