

ETHUSD: Ascending Triangle Pattern Above $1006
Ethereum was unable to sustain its bullish momentum, and after touching a high of 1251 on 9th July started to decline against the US dollar touching a low of 1006 on 13th July.
After this steep decline, we can see that the prices have recovered and started upwards correction with a bullish momentum.
We can see that ETH is gaining traction against the US dollar as the price remains supported above the $1050 handle in the European trading session today.
The prices touched an intraday low of $1075 and an intraday high of $1125 in the Asian trading session today.
We can clearly see an ascending triangle pattern above the $1006 handle which is a bullish pattern and signifies the end of a bearish phase and the start of a bullish phase in the markets.
ETH is now trading below its pivot levels of 1101 and is moving into a mildly bullish channel. The price of ETHUSD is now testing its classic resistance level of 1107 and Fibonacci resistance level of 1112 after which the path towards 1200 will get cleared.
The relative strength index is at 54 indicating a NEUTRAL market and the continuation of the uptrend in the markets.
The Williams percent range and commodity channel index are indicating NEUTRAL levels, which means that the prices are expected to enter into a consolidation phase in the short-term range.
Some of the technical indicators are giving a BUY market signal. Some of the moving averages are giving a BUY signal, and we are now looking at the levels of $1100 to $1150 in the short-term range.
ETH is now trading below both its 100 hourly simple and exponential moving averages.
- Ether: bullish continuation seen above the $1006 mark
- Short-term range appears to be mildly BULLISH
- ETH continues to remain above the $1000 level
- The average true range is indicating LESS market volatility
Ether: Bullish Continuation Seen Above $1006
ETHUSD is now moving in a mildly bullish channel with the prices trading above the $1050 handle in the European trading session today.
We have also detected the formation of MA20 and MA50 crossover patterns in the hourly time frame indicating that the price is likely to climb higher crossing the $1150 level.
We can see that the prices of Ethereum are slowly preparing for the next move above the $1100 level today.
The STOCHRSI is indicating an oversold market, which means that the prices are due to correct upwards in the short-term range.
The current price action is positive for the markets, and the prices are expected to remain above the $1000 level in the US trading session today.
The key support levels to watch are $1085 and $1093, and the prices of ETHUSD need to remain above these levels for the continuation of the bullish trend.
ETH has increased by 2.90% with a price change of 30$ in the past 24hrs and has a trading volume of 18.112 billion USD.
We can see an increase of 39.80% in the total trading volume in the last 24 hrs which is due to buying seen at lower levels by the medium-term investors.
The Week Ahead
On an upside potential $1300 remains as a major hurdle, and the price of Ethereum will test this resistance zone next week.
The price of Ethereum continues to remain above the important psychological support level of $1000 and some of the technicals are now indicating a bullish market.
The immediate short-term outlook for Ether has turned mildly BULLISH; the medium-term outlook has turned NEUTRAL; and the long-term outlook for Ether is NEUTRAL in present market conditions.
This week, Ether is expected to move in a range between $1000 and $1150, and next week, it is expected to enter into a consolidation phase above $1150.
Technical Indicators:
The STOCH (9,6): at 57.54 indicating a BUY
The moving averages convergence divergence (12,26): at 10.20 indicating a BUY
The rate of price change: at 0.321 indicating a BUY
Bull/Bear power (13): at 1.08 indicating a BUY
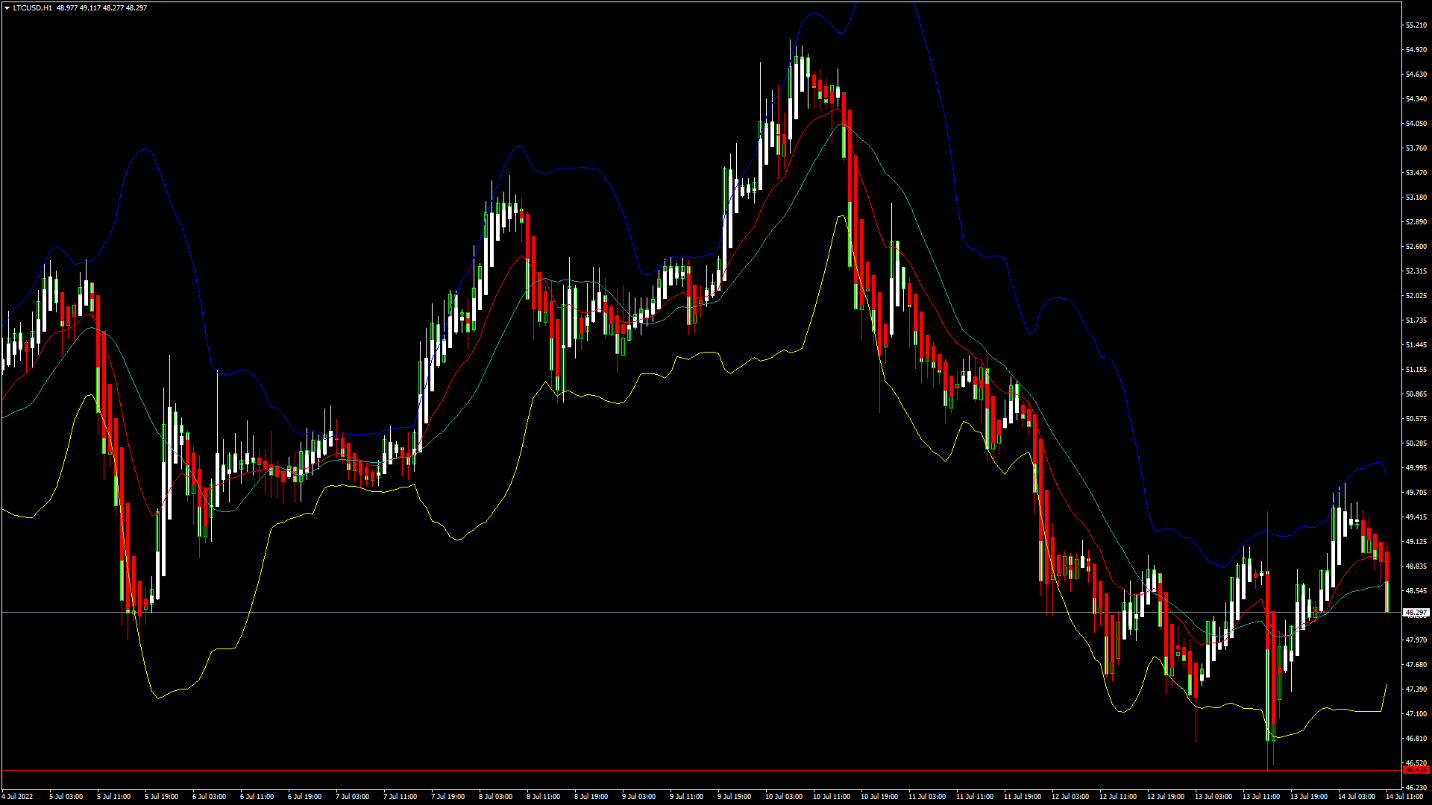
LTCUSD: Double Bottom Pattern Above $46
Litecoin was unable to sustain its bullish momentum last week and after touching a high of 54.95 on 10th July started to decline heavily against the US dollar, touching a low of $46.56 on 13th July.
We can see that after this decline, the prices of Litecoin have entered into a consolidation channel above the $47 handle. We have seen a bullish gap opening of the markets this week indicating the bullish nature of the markets.
We can clearly see a double-bottom pattern above the $46 handle which is a bullish pattern and signifies the end of a bearish phase and the start of a bullish phase.
Litecoin is now trading below its 100 hourly simple moving averages and 100 hourly exponential moving averages. The price of LTCUSD is just below its pivot level of 48.89.
The relative strength index is at 50 indicating a NEUTRAL market and the move towards the consolidation channel.
The price of Litecoin continues to remain below most of the moving averages, some of which are now giving a BUY signal at current market levels of 48.30.
The STOCHRSI is indicating an oversold level, which means that the prices are due to correct upwards in the short-term range.
The short-term outlook for Litecoin has turned mildly BULLISH.
- Some of the technical indicators are giving a BUY signal
- Litecoin: Bullish reversal seen above $46
- The commodity channel index is indicating a neutral level
- The average true range is indicating LESS market volatility
Litecoin: Bullish Reversal Seen Above $46
We can see that the prices of Litecoin continue to remain in the consolidation phase and are now trading above the $47 handle in the European trading session today.
We can see a bearish price exhaustion at $40, and a bullish correction wave has started, which can continue its propagation beyond the $55 and $60 levels in the coming week.
The price of LTCUSD is now facing its classic resistance level of 49.10 and Fibonacci resistance level of 49.23 after which the path towards $50 will get cleared.
Litecoin’s price continues to suffer losses due to the strength of the US dollar as many medium-term investors are selling due to weaker global sentiments.
We have also detected the formation of a bullish harami pattern above the $47 handle in the hourly time frame indicating the underlying bullish nature of the markets.
The daily RSI is printing at 41 which is indicating a neutral market and continuation of the consolidation phase in the short-term range.
LTC has decreased by 1.22% with a price change of 0.58$ in the past 24hrs and has a trading volume of 0.440 billion USD.
Litecoin’s trading volume has increased by 19.28% compared to yesterday which appears to be normal.
The Week Ahead
We can see the formation of a bearish engulfing pattern in the 30-minutes time frame indicating the weakness in the markets, but a positive correction is expected next week.
The price of Litecoin needs to remain above the $47 handle for the continuation of the uptrend.
The short-term outlook for Litecoin has turned mildly BULLISH; the medium-term outlook is NEUTRAL; and the long-term outlook is NEUTRAL at present market conditions.
This week, we are looking at levels of $46 to $52, and next week, Litecoin is expected to consolidate at levels above $52.
Technical Indicators:
The relative strength index (14 days): at 50 indicating a NEUTRAL market
The moving averages convergence divergence (12,26): at 0.162 indicating a BUY
The STOCHRSI (14): at 0.00 indicating an OVERSOLD market
The Williams percent range: at -89.44 indicating an OVERSOLD market
Be the first to comment