

Andres Victorero
Investment Thesis
Despite the present bear market, the Ethereum (ETH-USD) network has expanded and recently responded to the announcement of the Ethereum merger. In terms of network profitability, ETH is running into a significant resistance in the range of $1800 and $2400. When they hit break-even, holders who are losing will probably divide their pack to cover their positions.
The Adoption Towards Ethereum 2.0
The current drop in Ethereum hash rate before the merge into the POS chain itself wasn’t a bad thing because mining ETH could be a concept of the past when Ethereum upgraded to the POS consensus mechanism. It suggests that miners might have had to shut down their equipment because they need to cover their average cost or reach break-even. So far, it doesn’t adversely affect the network security, although there may be some bad network effect on the price in the short term.
Ethereum hash rate has dropped before the merge into the POS consensus. (Etherscan)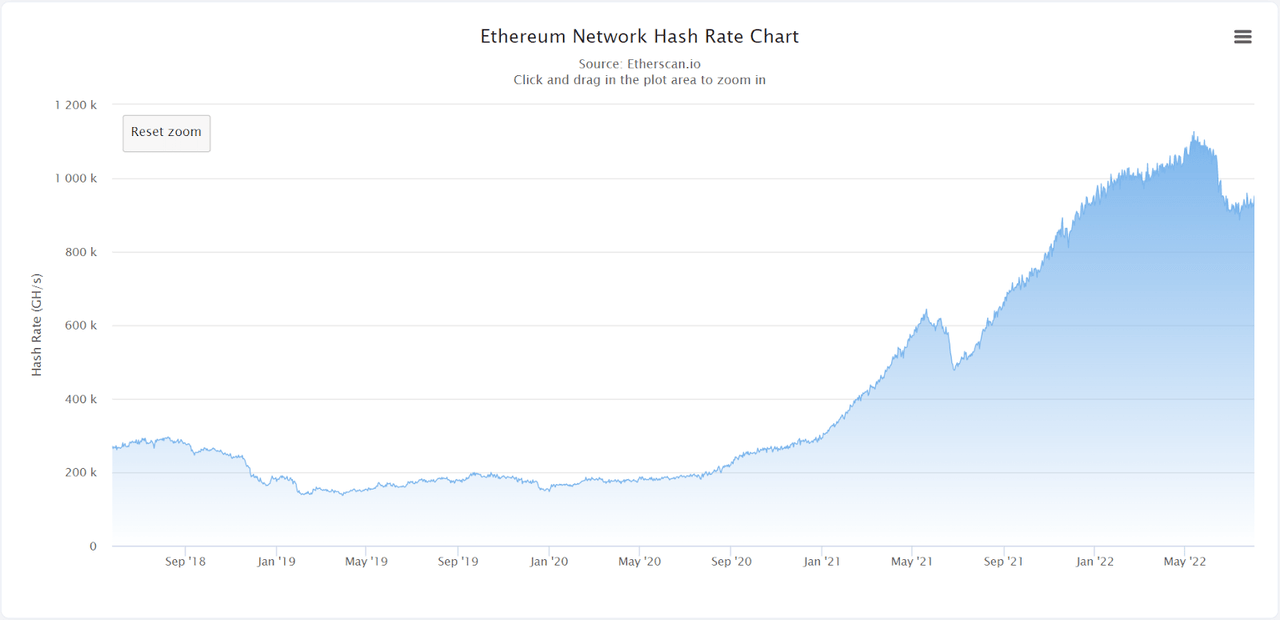
Ethereum 2.0, also referred to as Serenity or ETH 2.0, is an upgrade of Ethereum by switching from the Proof-of-Work consensus mechanism to the more advanced Proof-of-Stake consensus mechanism. It aims to boost the transaction capacity on the Ethereum network, lower the transaction fee, and improve the network’s sustainability. Looking at the total amount of ETH staked in the Ethereum 2.0 deposit contract, this data has gradually increased despite the recent drop in Ethereum hash rate. It suggests that stakeholders believe in the future of ETH 2.0 and are preparing for the shift of the network.
The total amount of ETH deposited into the staking contract on the Ethereum mainnet has increased gradually. (IntoTheBlock)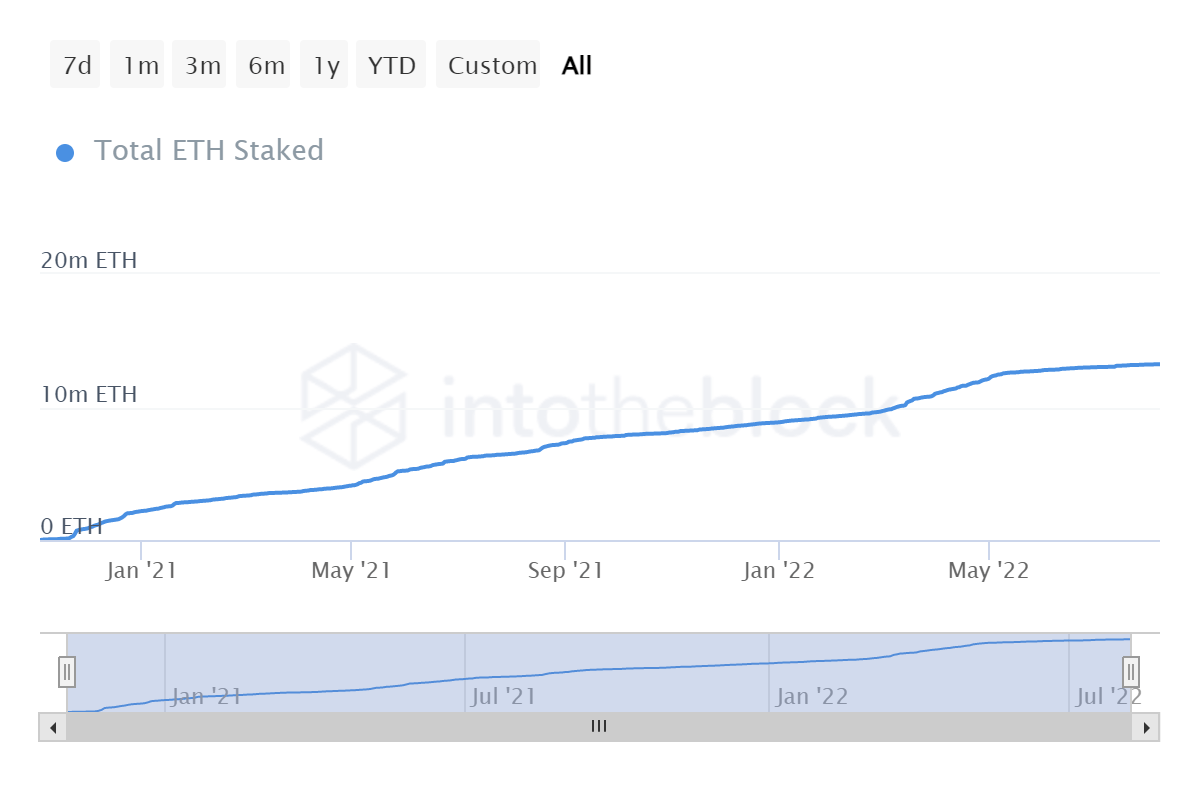
Furthermore, the total number of unique addresses depositing ETH to the staking contract has constantly risen along with the amount of ETH. It gives a better insight into the adoption of the beacon chain among stakeholders when many holders have endorsed the staking pools.
The total number of unique addresses supplying ETH to the staking contract has gradually increased. (IntoTheBlock)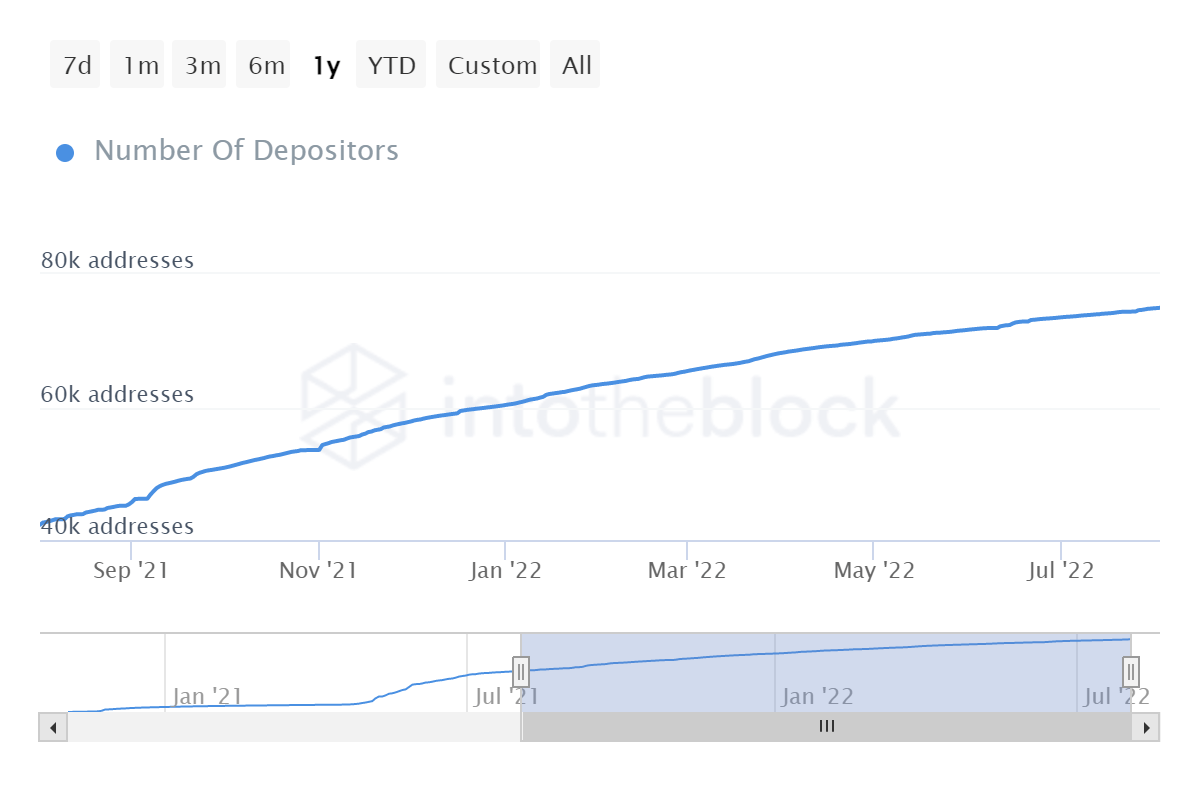
Network Growth Is Strong
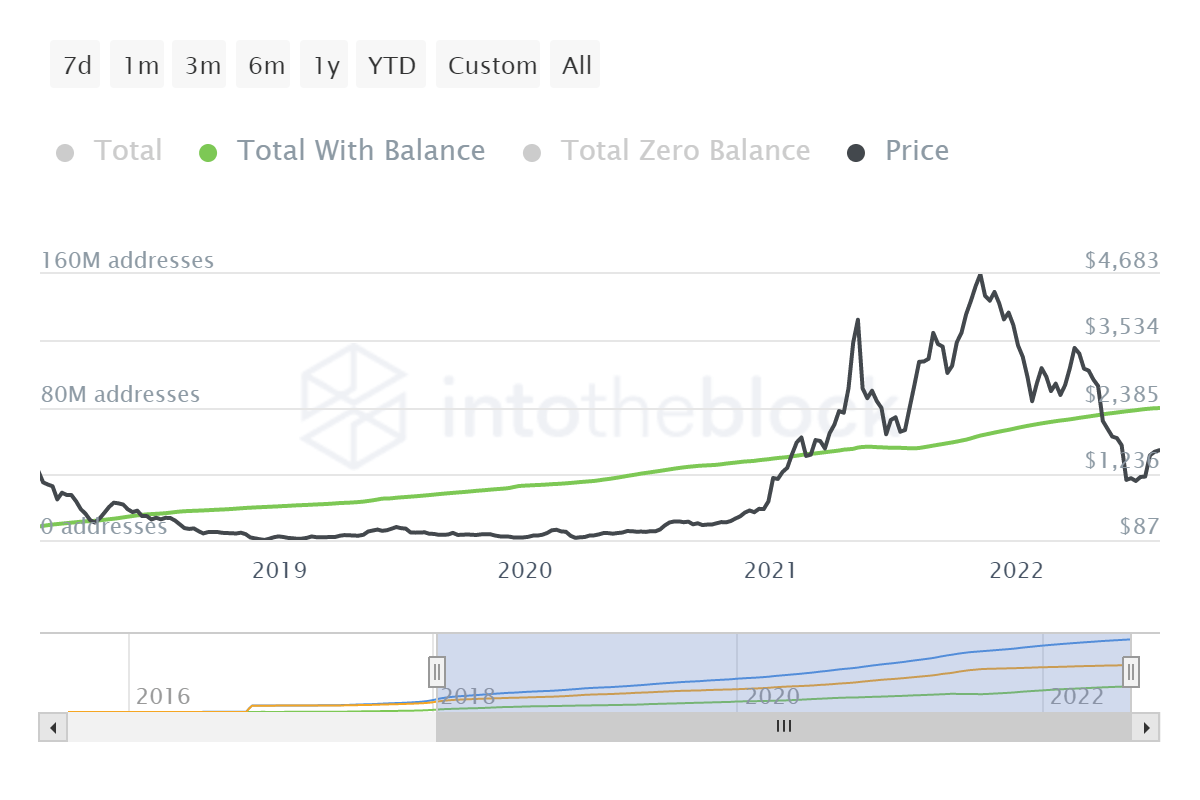
Generally, the number of unique addresses on the Ethereum blockchain has steadily grown since Ethereum’s inception. A sudden upsurge in the number of distinct addresses may lead to short-term volatility in the price action as traders are positioning or new users adopt the network, normally causing a consequent rally. In addition, a long-term balance across all unique addresses implies interest in holding and investing in Ethereum. In terms of decentralization, the expanding user base and the asset being fairly distributed to its stakeholders may have a positive effect on the network in the long-term horizon.
The total number of unique addresses has gradually climbed since Ethereum’s inception. (Etherscan) The total number of unique addresses with a non-zero balance has steadily risen since Ethereum’s inception. (IntoTheBlock)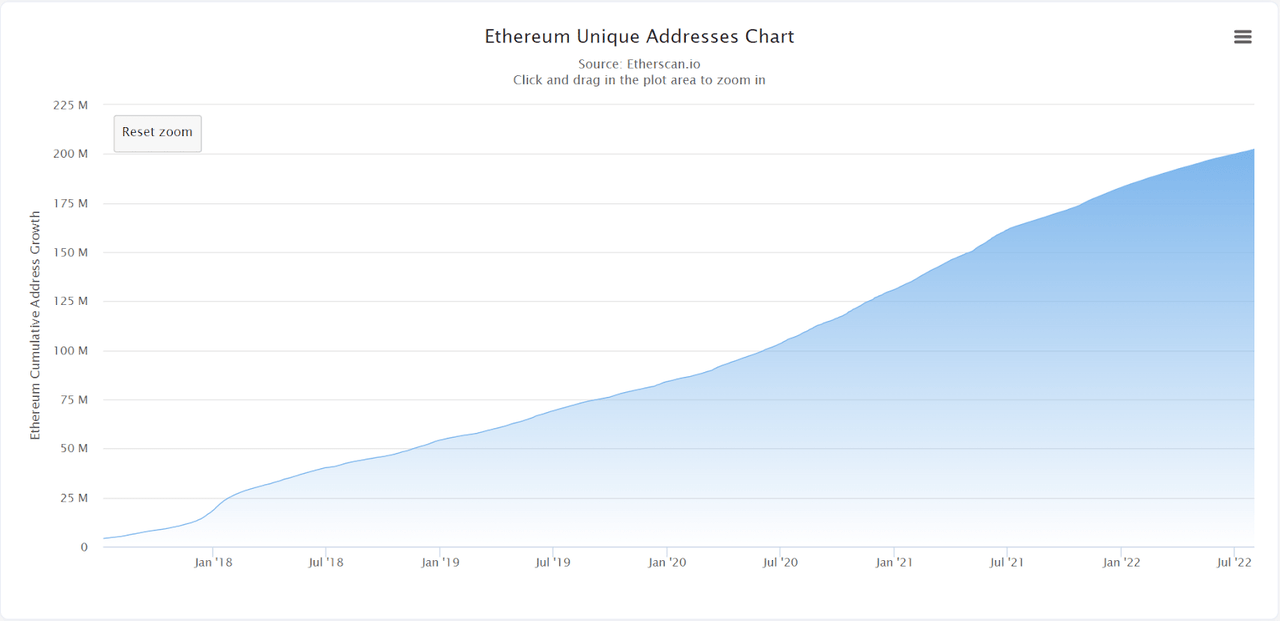
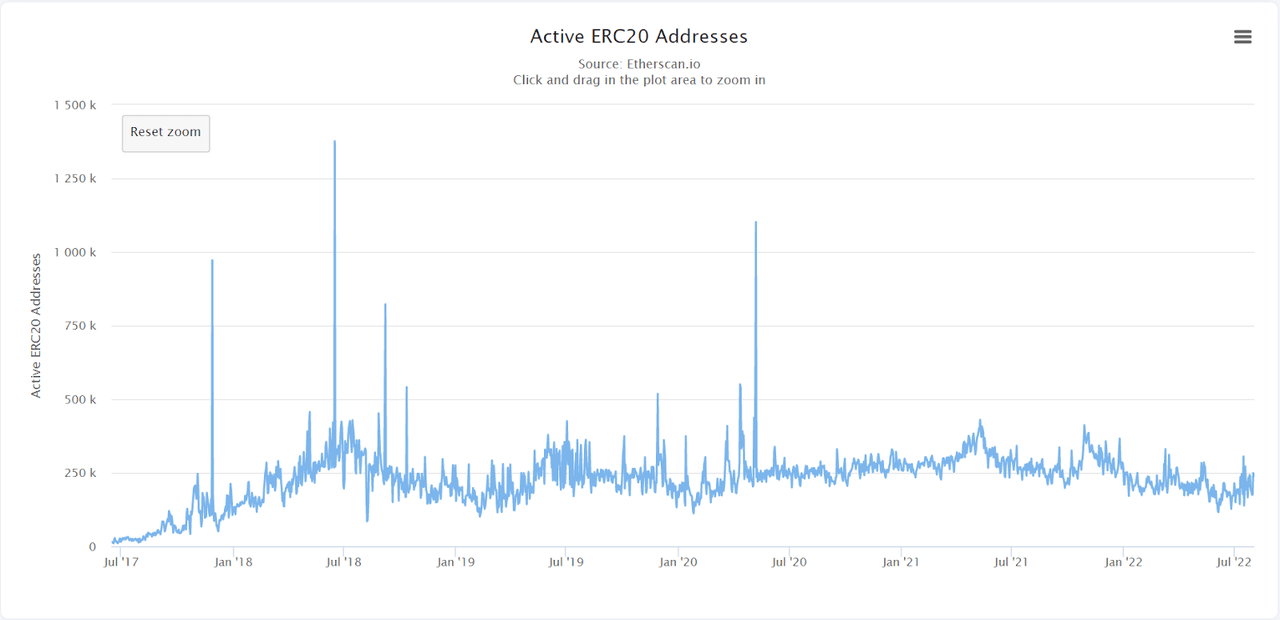
During the current weak market, there was a gradual increase in the overall number of Ethereum unique addresses that were daily active on the network as a sender or receiver. This amount has suddenly surged during the past week, which can have an impact on the price action as the network effect. Additionally, the total number of ERC20 unique addresses that were daily active on the network as a ERC20 token sender or receiver has remained stable throughout this bear market. It suggests that the decentralized utilization in the Ethereum ecosystem has maintained and grown.
The number of Ethereum unique active addresses has surged. (Etherscan) The number of ERC20 unique active addresses has maintained the status quo. (Etherscan)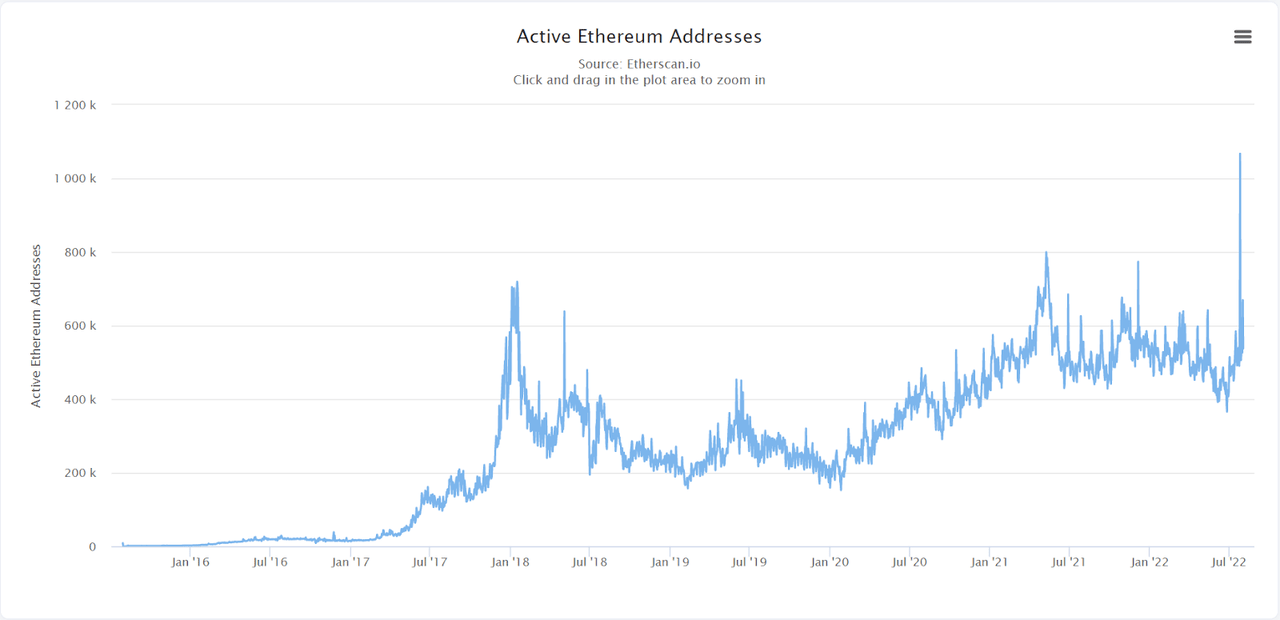
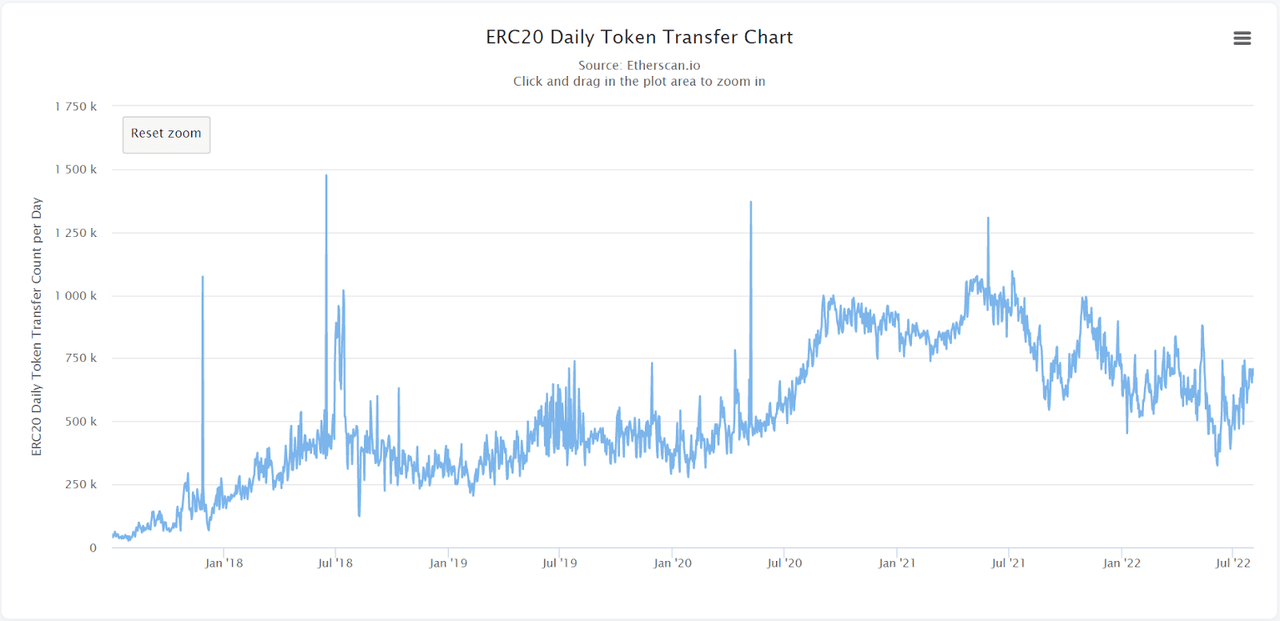
Meanwhile, the sum count of daily transactions on the Ethereum blockchain was slowly decreasing during the bear market along with the number of ERC20 tokens transferred daily. Recently, the network is more active when the daily transaction count has surged before the Ethereum merge.
The daily transaction count has surged before the Ethereum merge. (Etherscan) The number of ERC20 tokens transferred daily has not decreased deeply in the bear market. (Etherscan)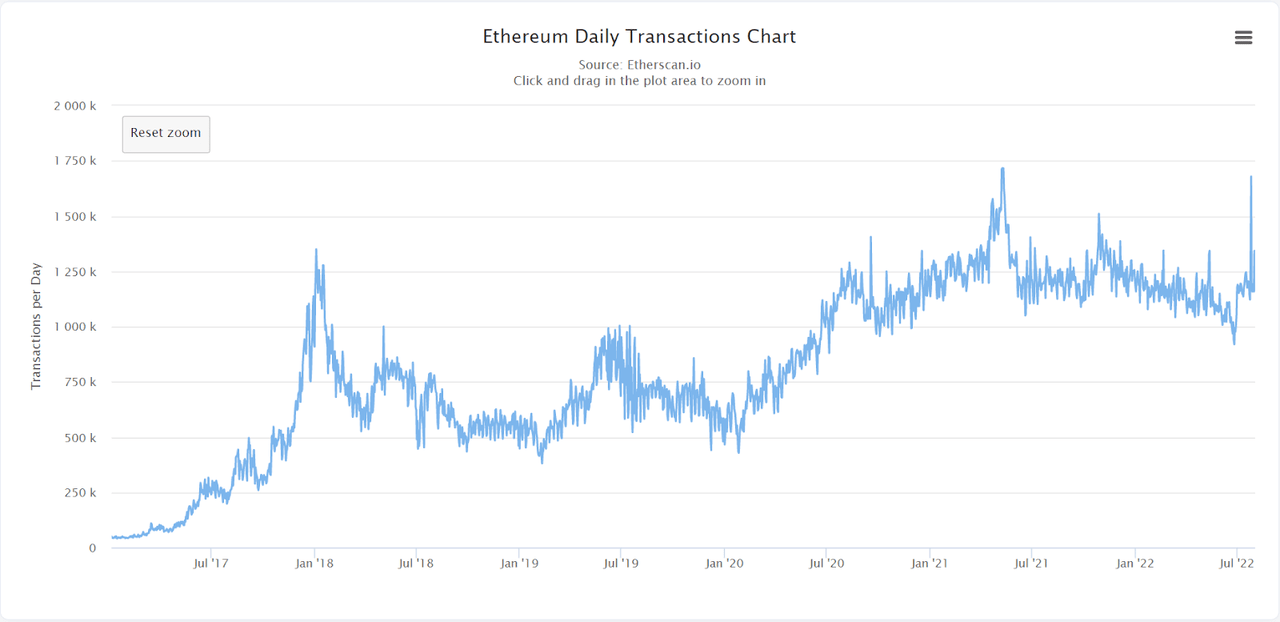
Asset’s Distribution Seems Fair
As reported by IntoTheBlock, the asset allocation is mostly held by retailers with the balance of roughly 58.93% of the circulating supply while whales and investors hold the rest of 23.19% and 17.87%, respectively. It looks good in terms of decentralization when the asset has been fairly distributed to users.
Where:
-
Whales are referred to addresses holding over 1% of the circulating supply.
-
Investors are referred to addresses holding from 0.1% to 1% of the circulating supply.
-
Retails are referred to addresses holding less than 0.1% of the circulating supply.
Retails hold 58.93%, Whales hold 23.19%, Investors hold 17.87%. (IntoTheBlock)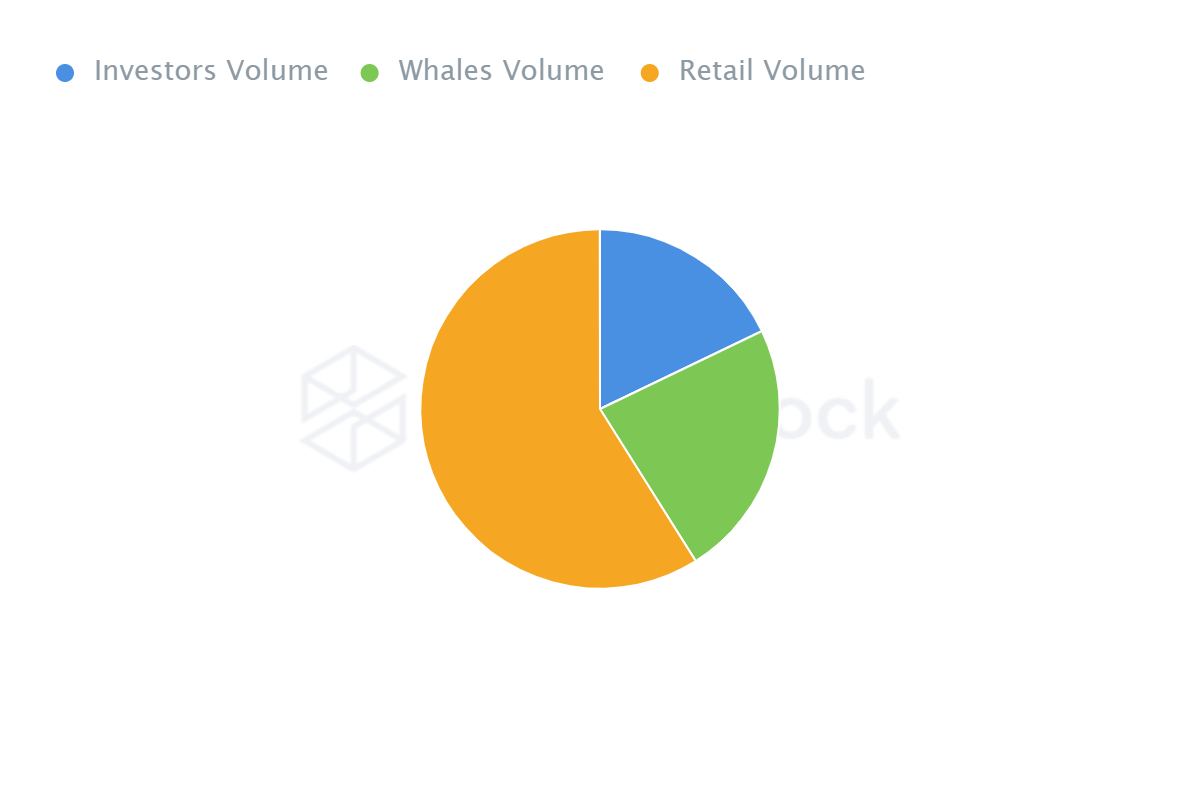
Regarding the asset’s allocation, fewer traders have been using coins for speculative objectives since early 2022. In the meantime, there has been a gradual increase in the percentage of holders who hold their coins for more than a year and cruisers who keep their coins for one to twelve months. This may be deduced from the network utility since the digital asset holders seek to profit from their coins by using useful decentralized applications. It can significantly lower the negative risk and contribute greatly to the long-term sustainability of the network.
There has been a gradual increase in the proportion of holders and cruisers since early 2022. (IntoTheBlock)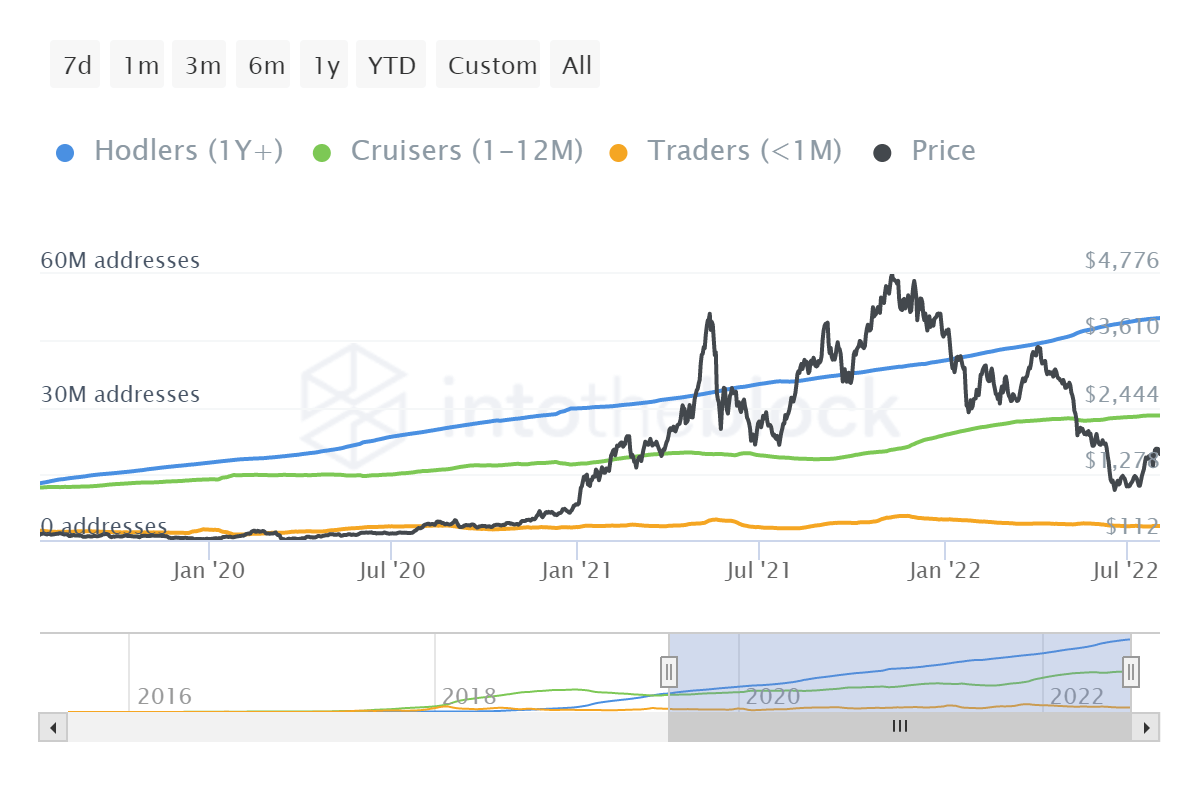
Futures And Options Markets Are Heating
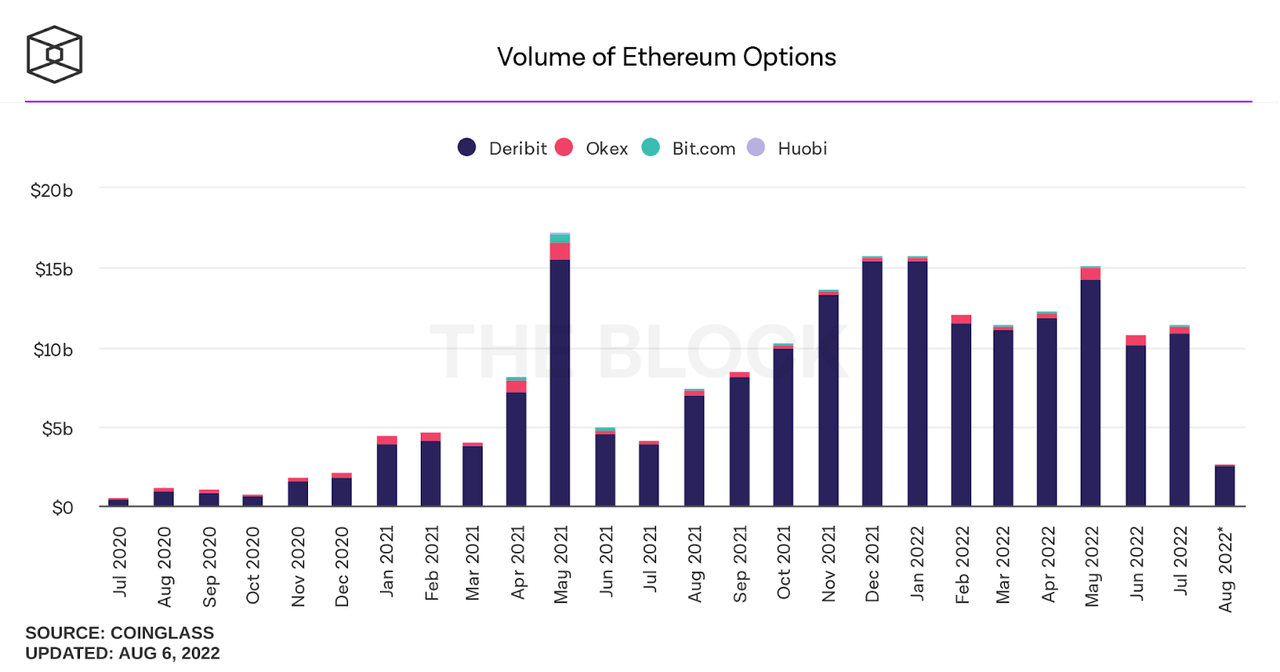
The aggregate open interest in Ethereum options across all cryptocurrency exchanges has dramatically surged since the recent dip. Not only the count of contracts, but also the aggregate Ethereum options trading volume in dollar terms across the largest cryptocurrency exchanges. The volume has remained high since early 2022 and is almost the same with that in May and November 2021. This can be assumed from the investors’ expectation aroused by the news of Ethereum merge. Hence, the market state can get overheated and produce huge volatility as can be seen clearly in the peaks of May 2021 and November 2021, respectively.
The ETH options market has overheated recently which may cause volatility. (TheBlock) The aggregate Ethereum options trading volume in dollar terms has reached the level seen in May and November 2021. (TheBlock)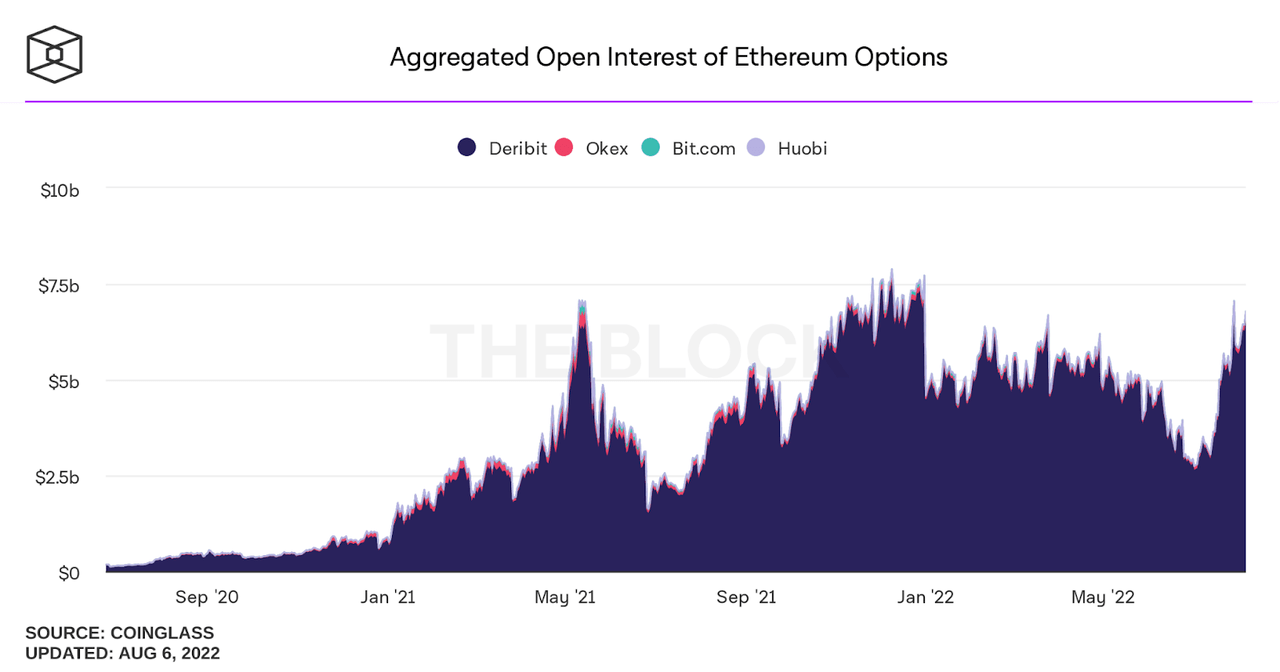
Looking at the aggregate Ethereum futures trading volume in dollar terms across the largest cryptocurrency exchanges, this data has gradually increased since March 2022, largely from Binance and Okex exchanges. Thus, Ethereum futures traders are more active during this rally.
Ethereum futures traders are more active during this rally. (TheBlock)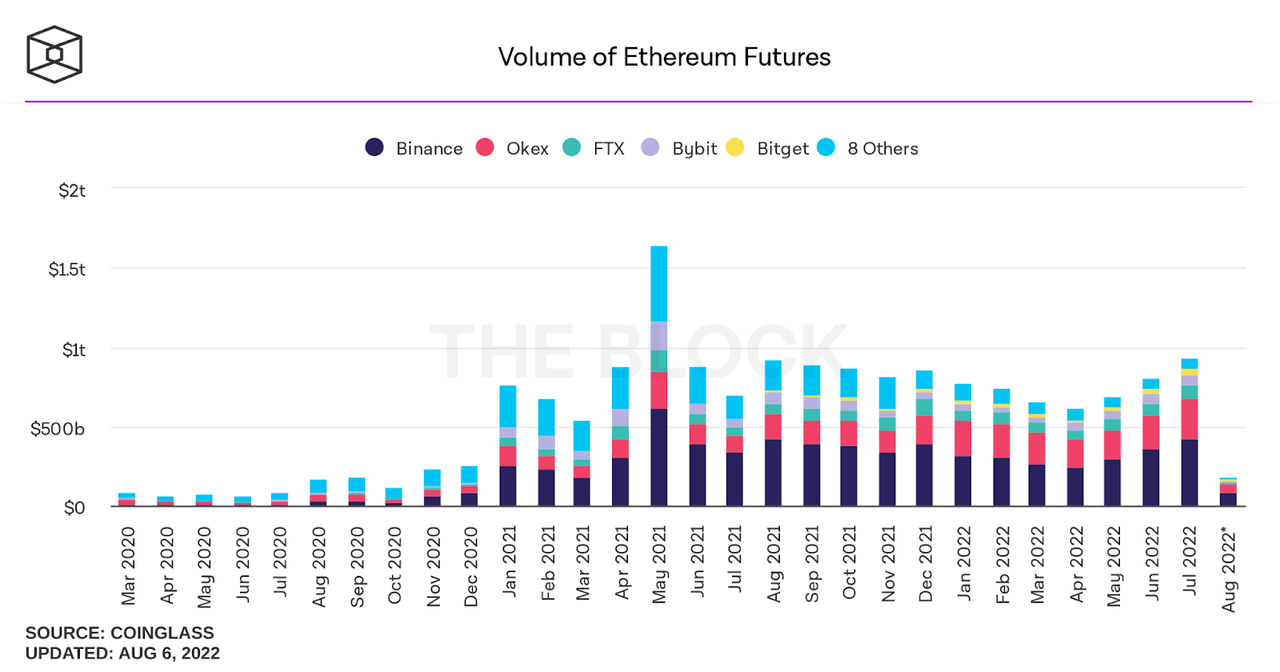
Regarding the ETH spot to futures volume metric, it is calculated as the aggregate daily ETH spot market volume divided by the total ETH futures trading volume. This data has dramatically plummeted while ETH’s price has surged recently. It suggests that this market rally of Ethereum is mainly driven by the futures market. Therefore, there would be high volatility in price action if open interest gets liquidated.
This market rally of Ethereum is mainly driven by the futures market. (TheBlock)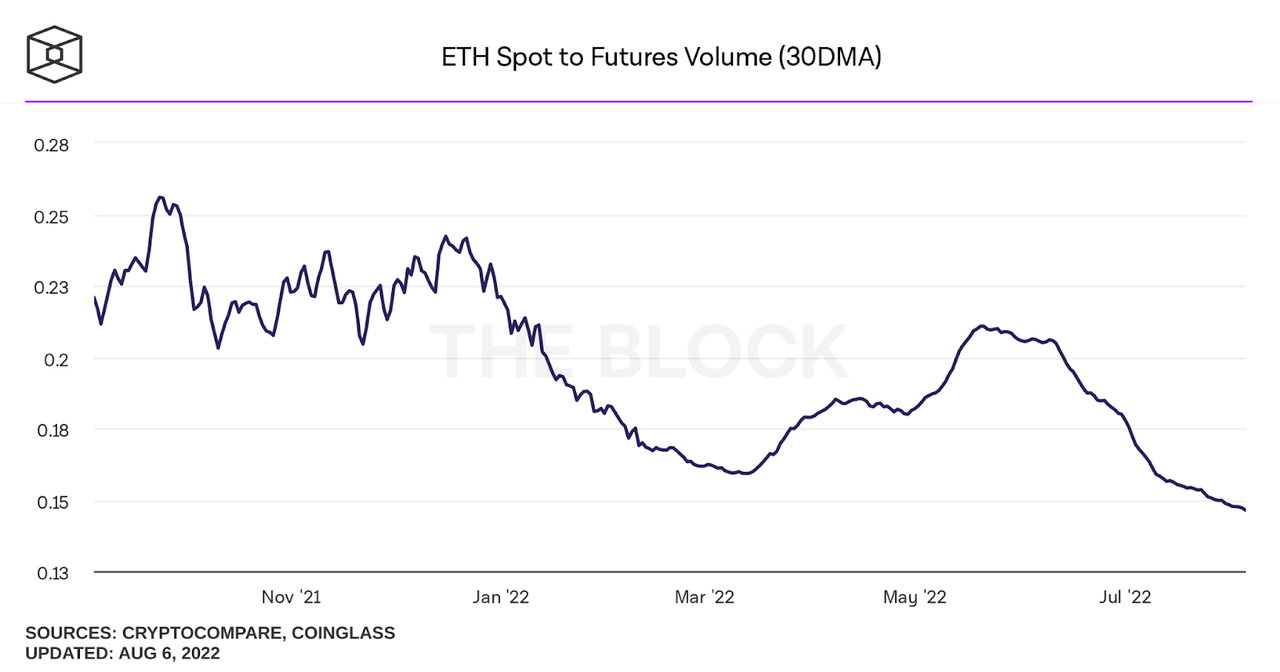
Network Profitability
Regarding addresses with a non-zero balance, we define the wallet average cost as the average price at which all tokens in the wallet were purchased. If the current market price is greater than the wallet average cost, the wallet is labeled as “In the Money” (or unrealized profit). If the current market price is less than the wallet average cost, the wallet address is labeled as “Out of the Money” (or unrealized loss). Those addresses in the money at a certain level of price is illustrated by a green cluster. Those addresses out of the money at a specific level of price is illustrated by a red cluster. This metric offers a comprehensive grasp of the critical levels of price at which users must bear losses or profits. Due to the tendency of holders to cover their positions at these price levels, they are likely to act as support or resistance. In this short-term rally, the zone of $1762-$1810 plays as the strong resistance for ETH when ETH is moving upwards from $1000.
The zone of $1762-$1810 is the strong resistance for ETH when ETH is moving upwards from $1000. (IntoTheBlock)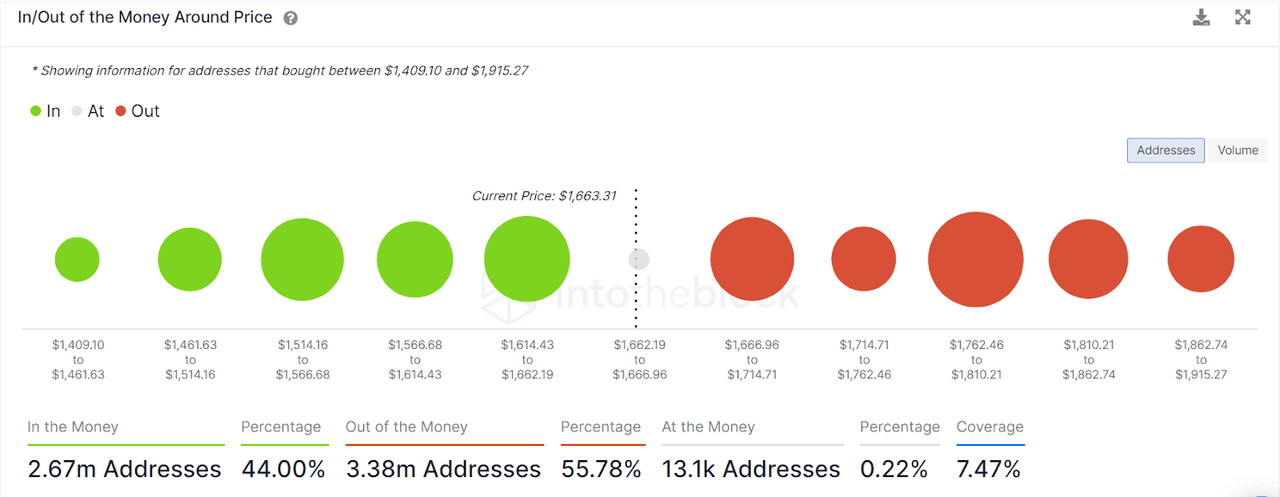
In terms of realized profit and loss, an address has realized loss when it sells at the current market price that is lower than its wallet average cost. Conversely, an address has realized profit when it sells at the current market price that is higher than its wallet average cost. Green clusters account for those addresses that have realized profit, while red clusters are attributed to addresses that have realized loss. In this case, there are 8.98 million addresses that need ETH to surge to about $1800 to reach break-even. At this price, holders are likely to cover their position and average cost to reach break-even. Therefore, this level once again plays as the strong resistance for ETH in the short-term price action.
The price of $1800 plays as the strong resistance for ETH in the short-term price action. (IntoTheBlock)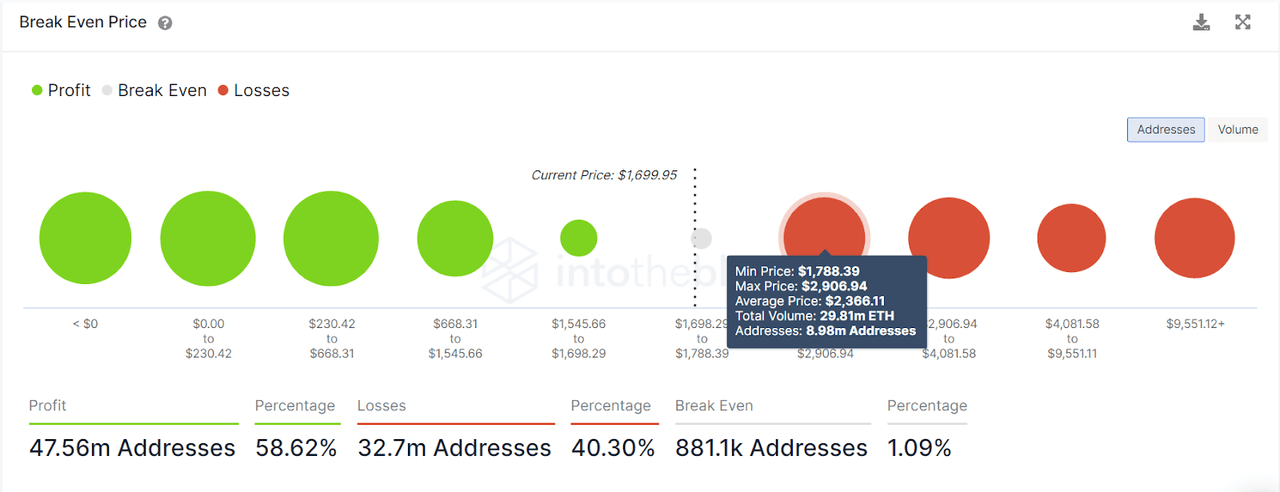
The Bottom Line
Looking at Ethereum’s price action, the zone of from $1800 to $2400 is a strong resistance for ETH in the next possible short-term bear run. The price is likely to react to this level and move downwards amid the news of Ethereum merger.
The zone of from $1800 to $2000 is a strong resistance for ETH in the next possible short-term bear run. (TradingView)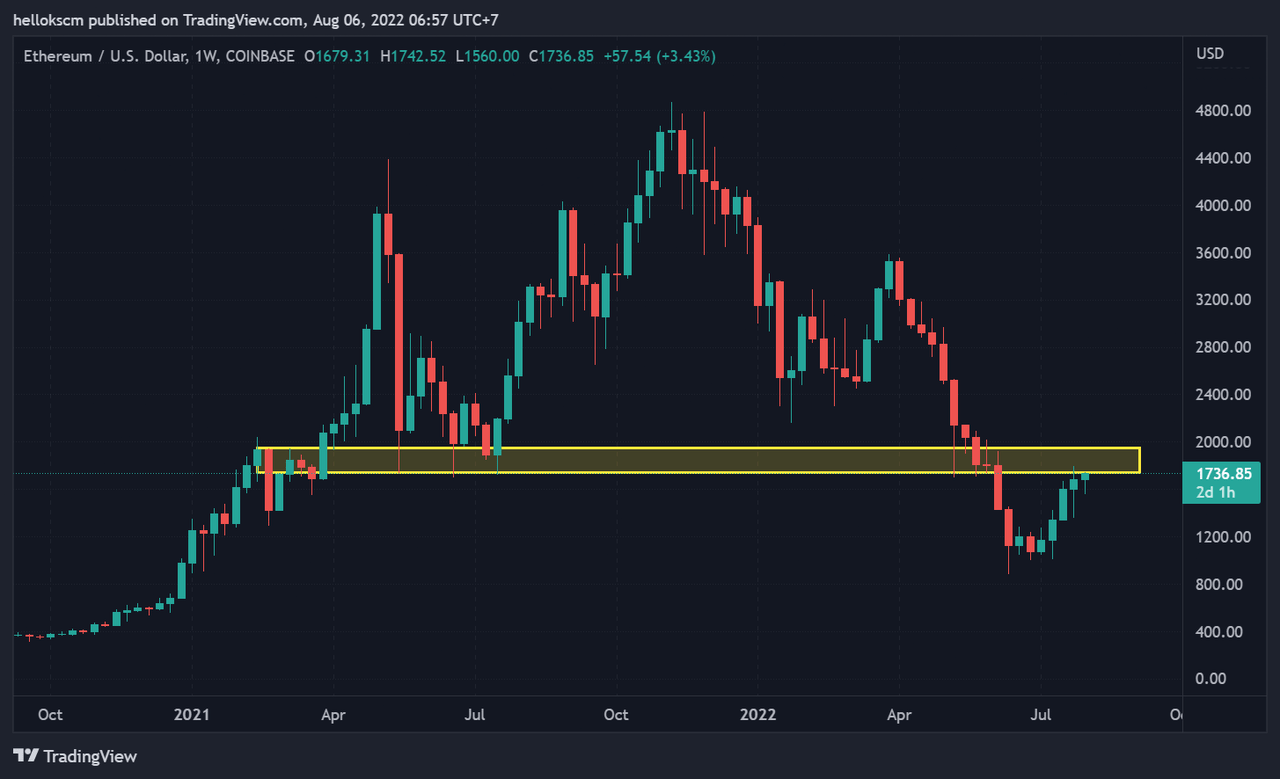
In looking for the next feasible bottom, we can see that the zone between $250 and $450 is the strong support for ETH which may be the base for the next rally. Thus, the next accumulation phase may begin within this range of price, and this may be the good entry area for the next bull market.
The zone between $250 and $450 is the strong support for ETH which may be the base for the next rally. (TradingView)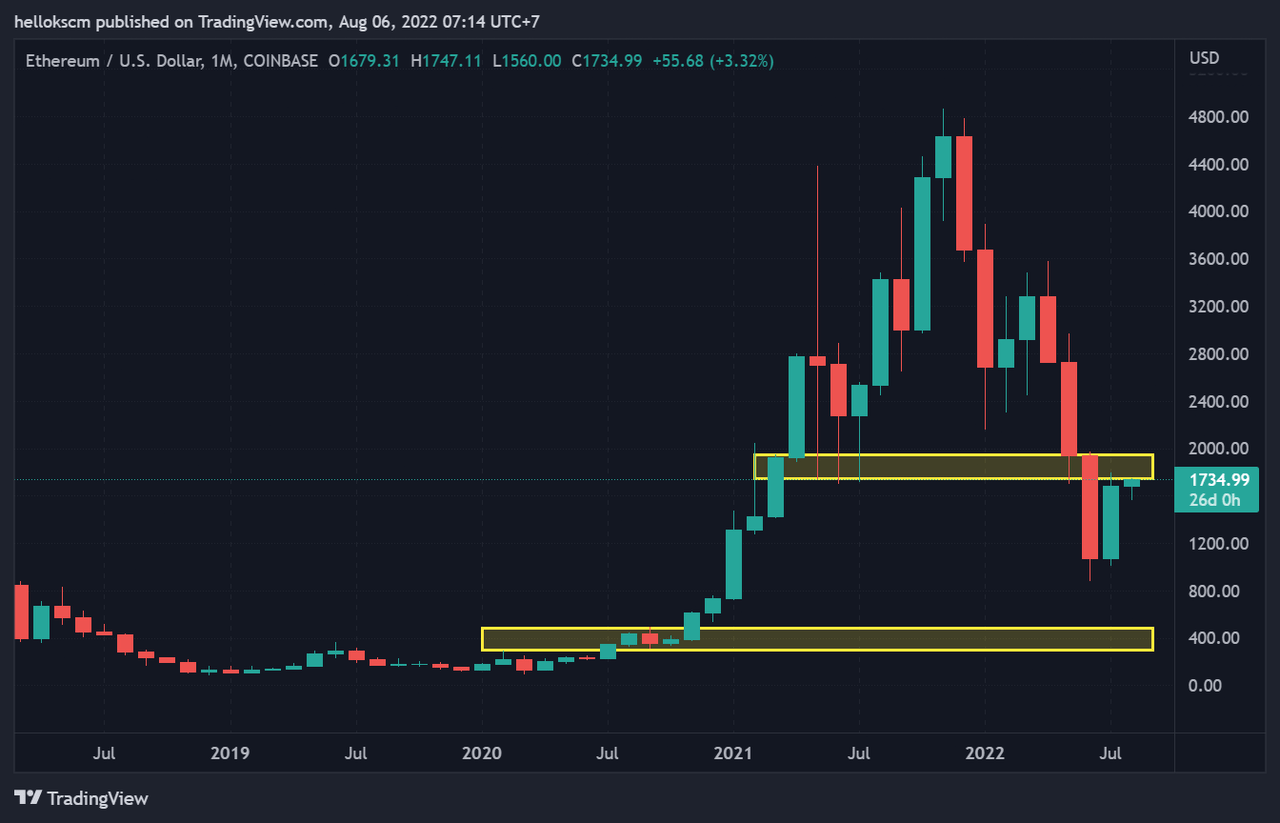
In conclusion, the Ethereum network has grown despite the current bear market and recently reacted to the news of the Ethereum merger. Regarding the network profitability, ETH is encountering a strong resistance at the zone between $1800 and $2400. Holders in loss are likely to divide their pack to cover their positions when reaching the break-even. It should be a sound strategy to hedge against the downside risk when the selling pressure is intense near the resistance. In particular, the area of $250 – $450 could be an optimal entry zone to gradually accumulate more coins before the next rally.
Be the first to comment