

Ethereum (ETH) Prices, Charts, and Analysis
- Ethereum breaks through multi-month resistance.
- Shanghai upgrade passes without incident.
Recommended by Nick Cawley
Get Your Free Introduction To Cryptocurrency Trading
Most Read: Ethereum (ETH/USD) Breaks Higher as Shanghai Upgrade Nears
Ethereum is rallying hard and is back at levels last seen in September last year. The 2nd largest crypto by market cap broke sharply higher mid-week after the successful implementation of its latest upgrade. The Ethereum Shanghai upgrade took place this Wednesday without incident. This upgrade allows Ethereum network validators to withdraw their staked ETH (stETH), although the speed of withdrawal will be decided by individual staking pools. According to the Ethereum Roadmap, ‘staking withdrawals refer to transfers from a validator account on Ethereum’s consensus layer (the Beacon Chain), to the execution layer where it can be transacted with’. In short, any staked Ethereum that was locked up as stETH can now be changed back to ETH on a 1:1 basis and sold if required.
Market fears that the upgrade would potentially release billions of dollars worth of Ethereum into the market have not come to pass as yet. While some stETH have been withdrawn and sold, some validator pools have already said that withdrawals will not happen immediately. Lido Finance, the largest staking pool, said a few weeks ago that withdrawals of stETH will not happen until May.
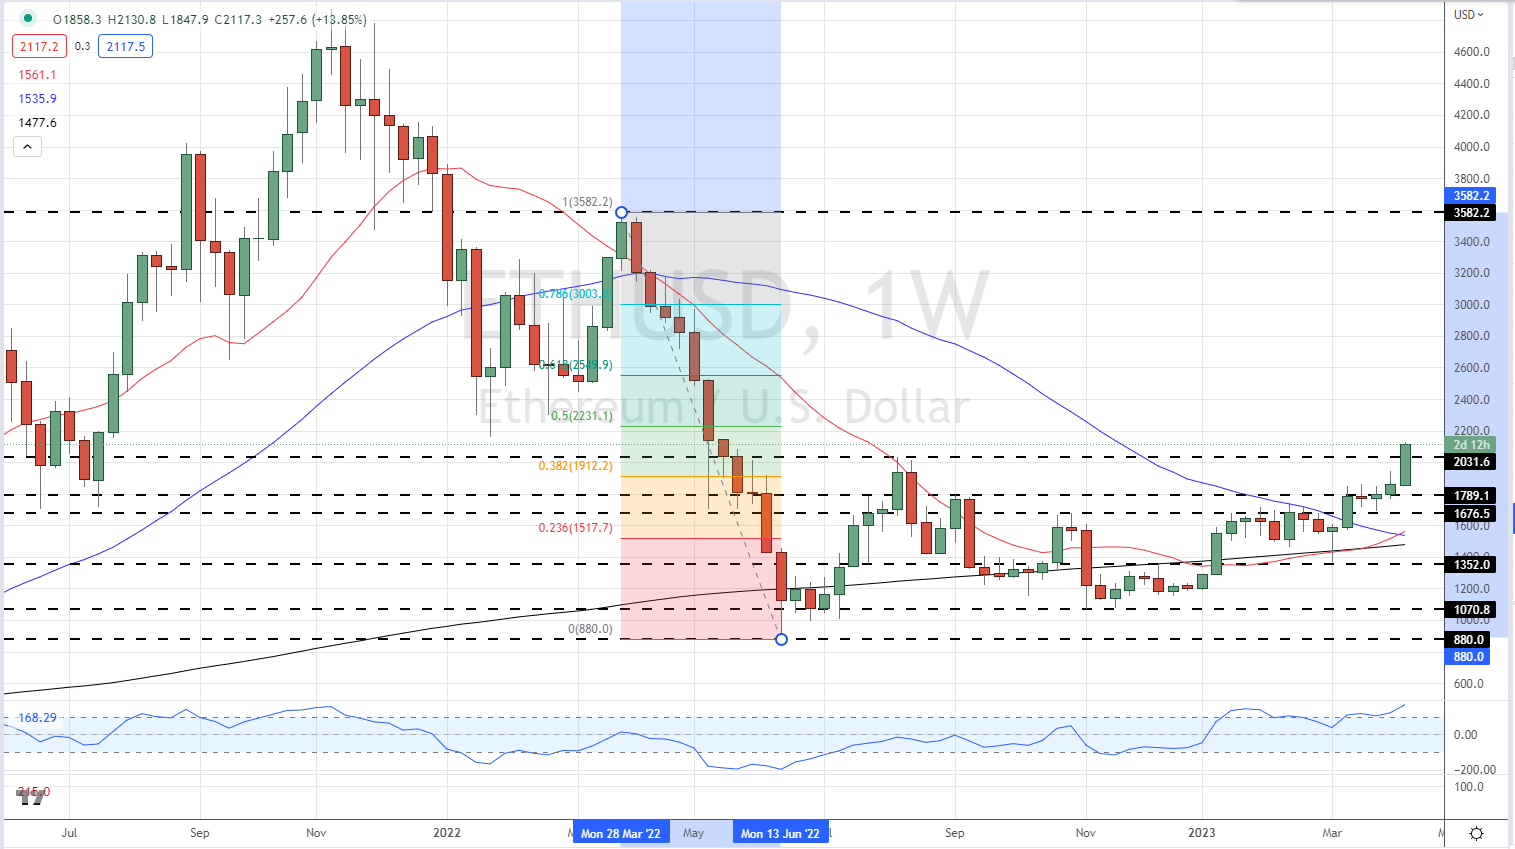
Ethereum is back above $2,100 and is looking to press higher. If we use a medium-term Fibonacci retracement from March 28, 2022 swing high at $3,582 to June 13, 2022, low at $880, then a 50% retracement of this move can be seen at $2,231, while a 61.8% retracement is situated at $2,550 level.
Ethereum (ETH/USD) Weekly Price Chart – April 14, 2023
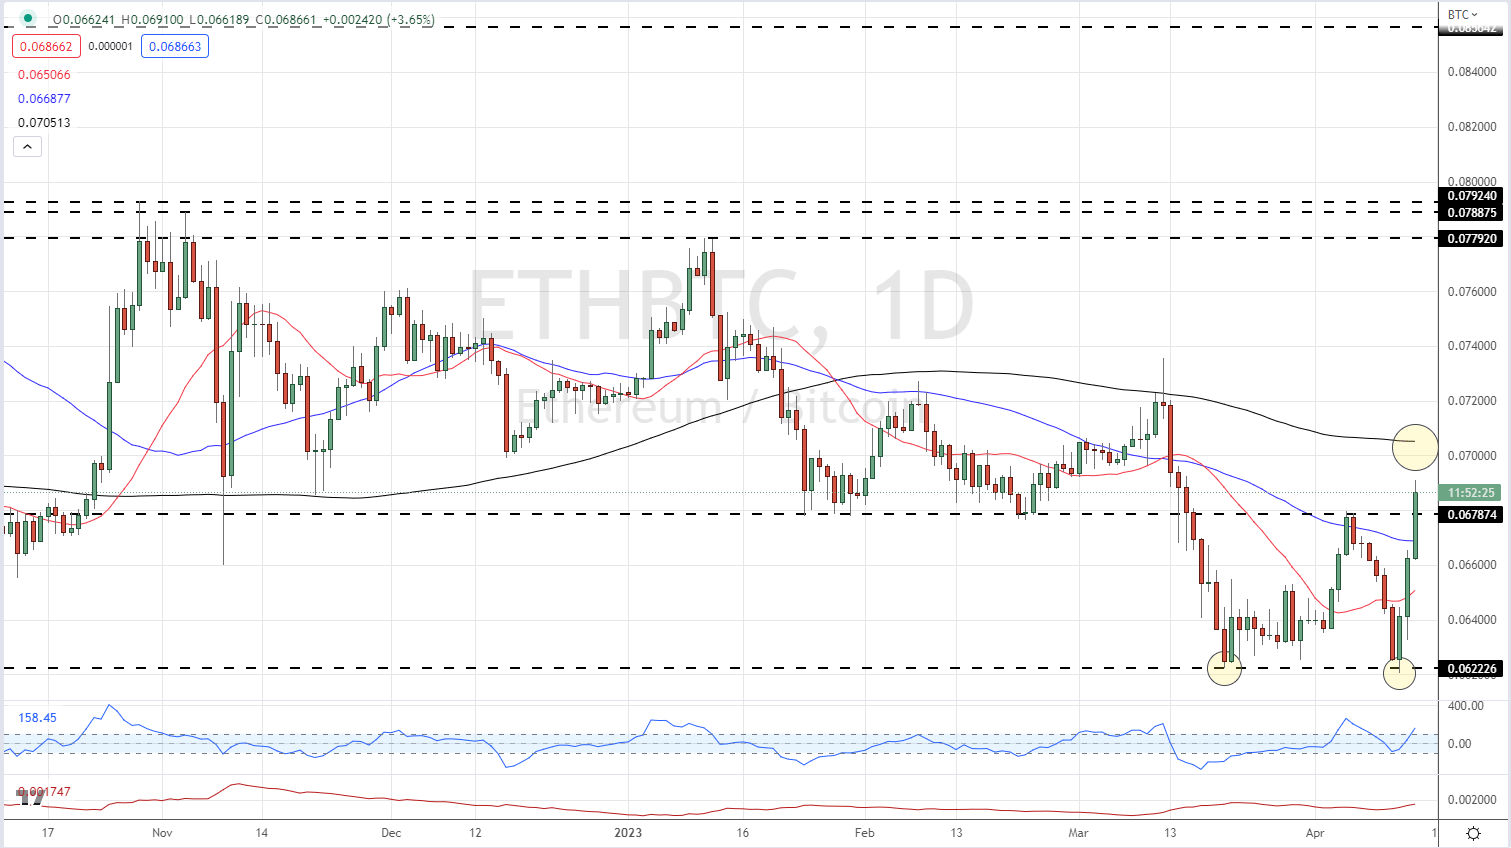
The recent underperformance of Ethereum against peer Bitcoin has also turned higher this week. A prior level of support from mid-March held the spread from going lower and another re-test of this level this week also prompted a reversal and turn high. A prior level of resistance has been taken out by today’s move higher and it will be interesting to note if the spread opens above this level. The 200-day sma (black line) is the next technical level of resistance.
Ethereum/Bitcoin (ETH/BTC) Spread Daily Chart – April 14, 2023
Charts via TradingView
What is your view on Ethereum – bullish or bearish?? You can let us know via the form at the end of this piece or you can contact the author via Twitter @nickcawley1.
Be the first to comment