

Facing An Uncertain 2022: ETF Reliable Retirement Portfolio (By ETF Monkey) MicroStockHub/iStock via Getty Images
(This article was co-produced with Hoya Capital Real Estate.)
On November 12, 2021, in conjunction with the Hoya Capital Income Builder (hereafter HCIB) marketplace service, I introduced the ETF Reliable Retirement Portfolio.
For tracking purposes, the official inception date of the portfolio was November 9, 2021. The purchase prices used were the closing prices from the previous day, November 8, 2021. We decided on $500,000 as the opening value of the hypothetical portfolio, as we felt this amount perhaps struck a nice median as being representative of an investor who subscribed to a service such as HCIB.
For a complete discussion of the theory behind the initial portfolio construction, please feel free to reference the article referenced in the opening paragraph. In the next section, however, I will offer an abbreviated overview of key data points and concepts to lay a groundwork for the performance update that is ultimately the subject of this article.
Portfolio Structure and Themes
Based on 2022 investment outlooks from several reputable sources, here are the key themes that drove portfolio construction.
- A bias toward value stocks in the U.S. – Of late, a relatively small subset of U.S. growth stocks has significantly outperformed virtually every other asset class. Various analyses suggest that value stocks may offer a better risk/reward profile moving forward.
- The return from U.S. equities may be only marginally higher than bonds – Particularly for retirees, finding a solid balance of risk/reward is worthy of consideration. I attempt to find this balance in my portfolio.
- Superior growth opportunities may come from outside the U.S. – A mid-year 2021 update from Vanguard forecast Euro-area stocks as potentially outperforming their U.S. cousins by roughly one-half percent; a range of 2.9% – 4.9% as opposed to 2.4% – 4.4%. And emerging markets offered even higher potential, albeit with more volatility and risk.
Below, I have reproduced the table of ETFs included in the portfolio. However, the weightings are proprietary to subscribers of Hoya Capital Income Builder.
ETF Reliable Retirement Portfolio by ETF Monkey (Hoya Capital Income Builder)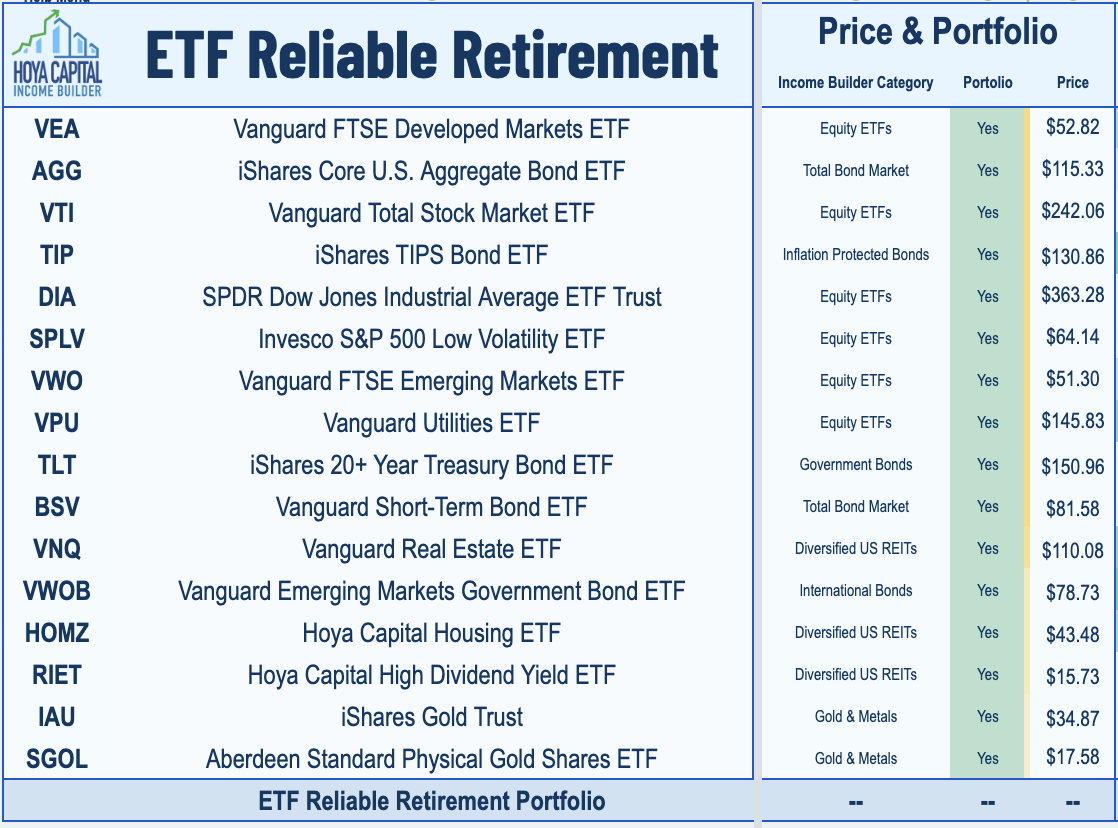
At a high level, the portfolio is comprised of five asset classes:
- U.S. Stocks
- Foreign Stocks
- Bonds/TIPS
- Real Estate
- Gold
As a conclusion to this section, I might note that, while a high dividend level was not the primary focus of this portfolio, nine of the 14 dividend-producing ETFs pay their dividends monthly, with the remaining five paying quarterly. The two gold-backed ETFs, of course, pay no dividends.
2022 Q1 Update (11/9/21 – 3/31/22): Where The Rubber Meets The Road
As the very first performance update on the portfolio, this article will cover the entire period from its inception on November 9, 2021 through March 31, 2022.
Without further ado, then, here is the high-level breakdown of the portfolio as of March 31, 2022.
ETF Reliable Retirement Portfolio – Dashboard (Author-Developed Tracking Sheet)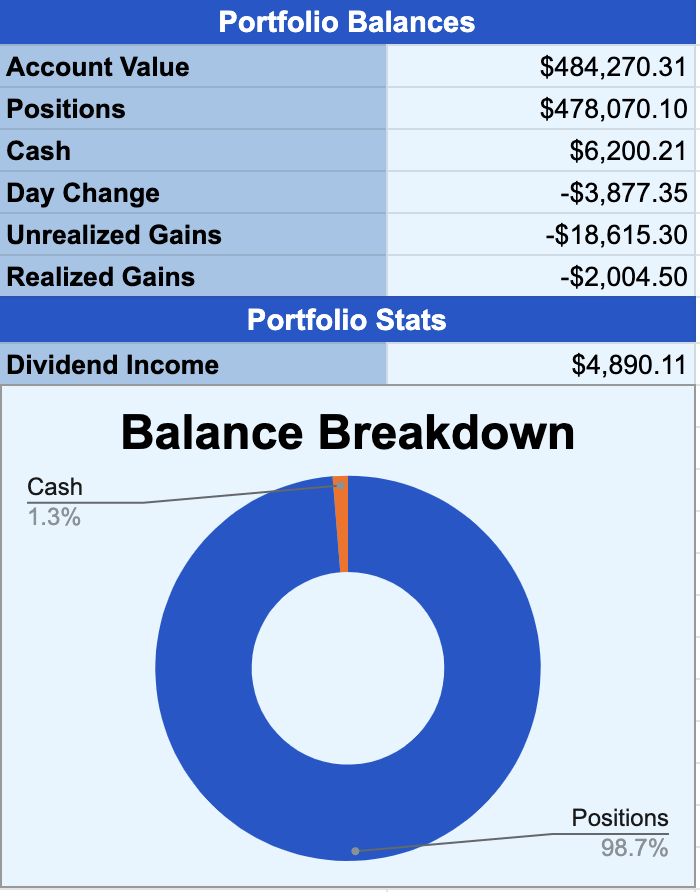
As can be seen, the portfolio ended Q1 with a balance of $484,270.31, representing an overall decline of 3.15%. Since the portfolio generated $4,890.11 of dividend income, or roughly .98%, this breaks down to an overall loss of roughly 4.13% in the holdings themselves, offset by that .98% of dividend income.
How does that compare with major U.S. averages? Here’s a quick peek at the Dow Jones Industrial Average and the S&P 500 index, as two reference points.
| November 8, 2021 | March 31, 2022 | Difference | |
| DJIA | 36,432.22 | 34,678.35 | -4.81% |
| S&P 500 | 4,701.70 | 4,530.41 | -3.64% |
Overall, then, the portfolio was roughly in line with major U.S. market averages, in terms of total performance.
For a better evaluation, however, I ran a comparison in Portfolio Visualizer against the Vanguard Balanced Index, as represented by a mutual fund such as Vanguard Balanced Index Fund Admiral Shares (VBIAX). Here are the results.
Returns – ETF Reliable Retirement vs. Vanguard Balanced Index (PortfolioVisualizer.com)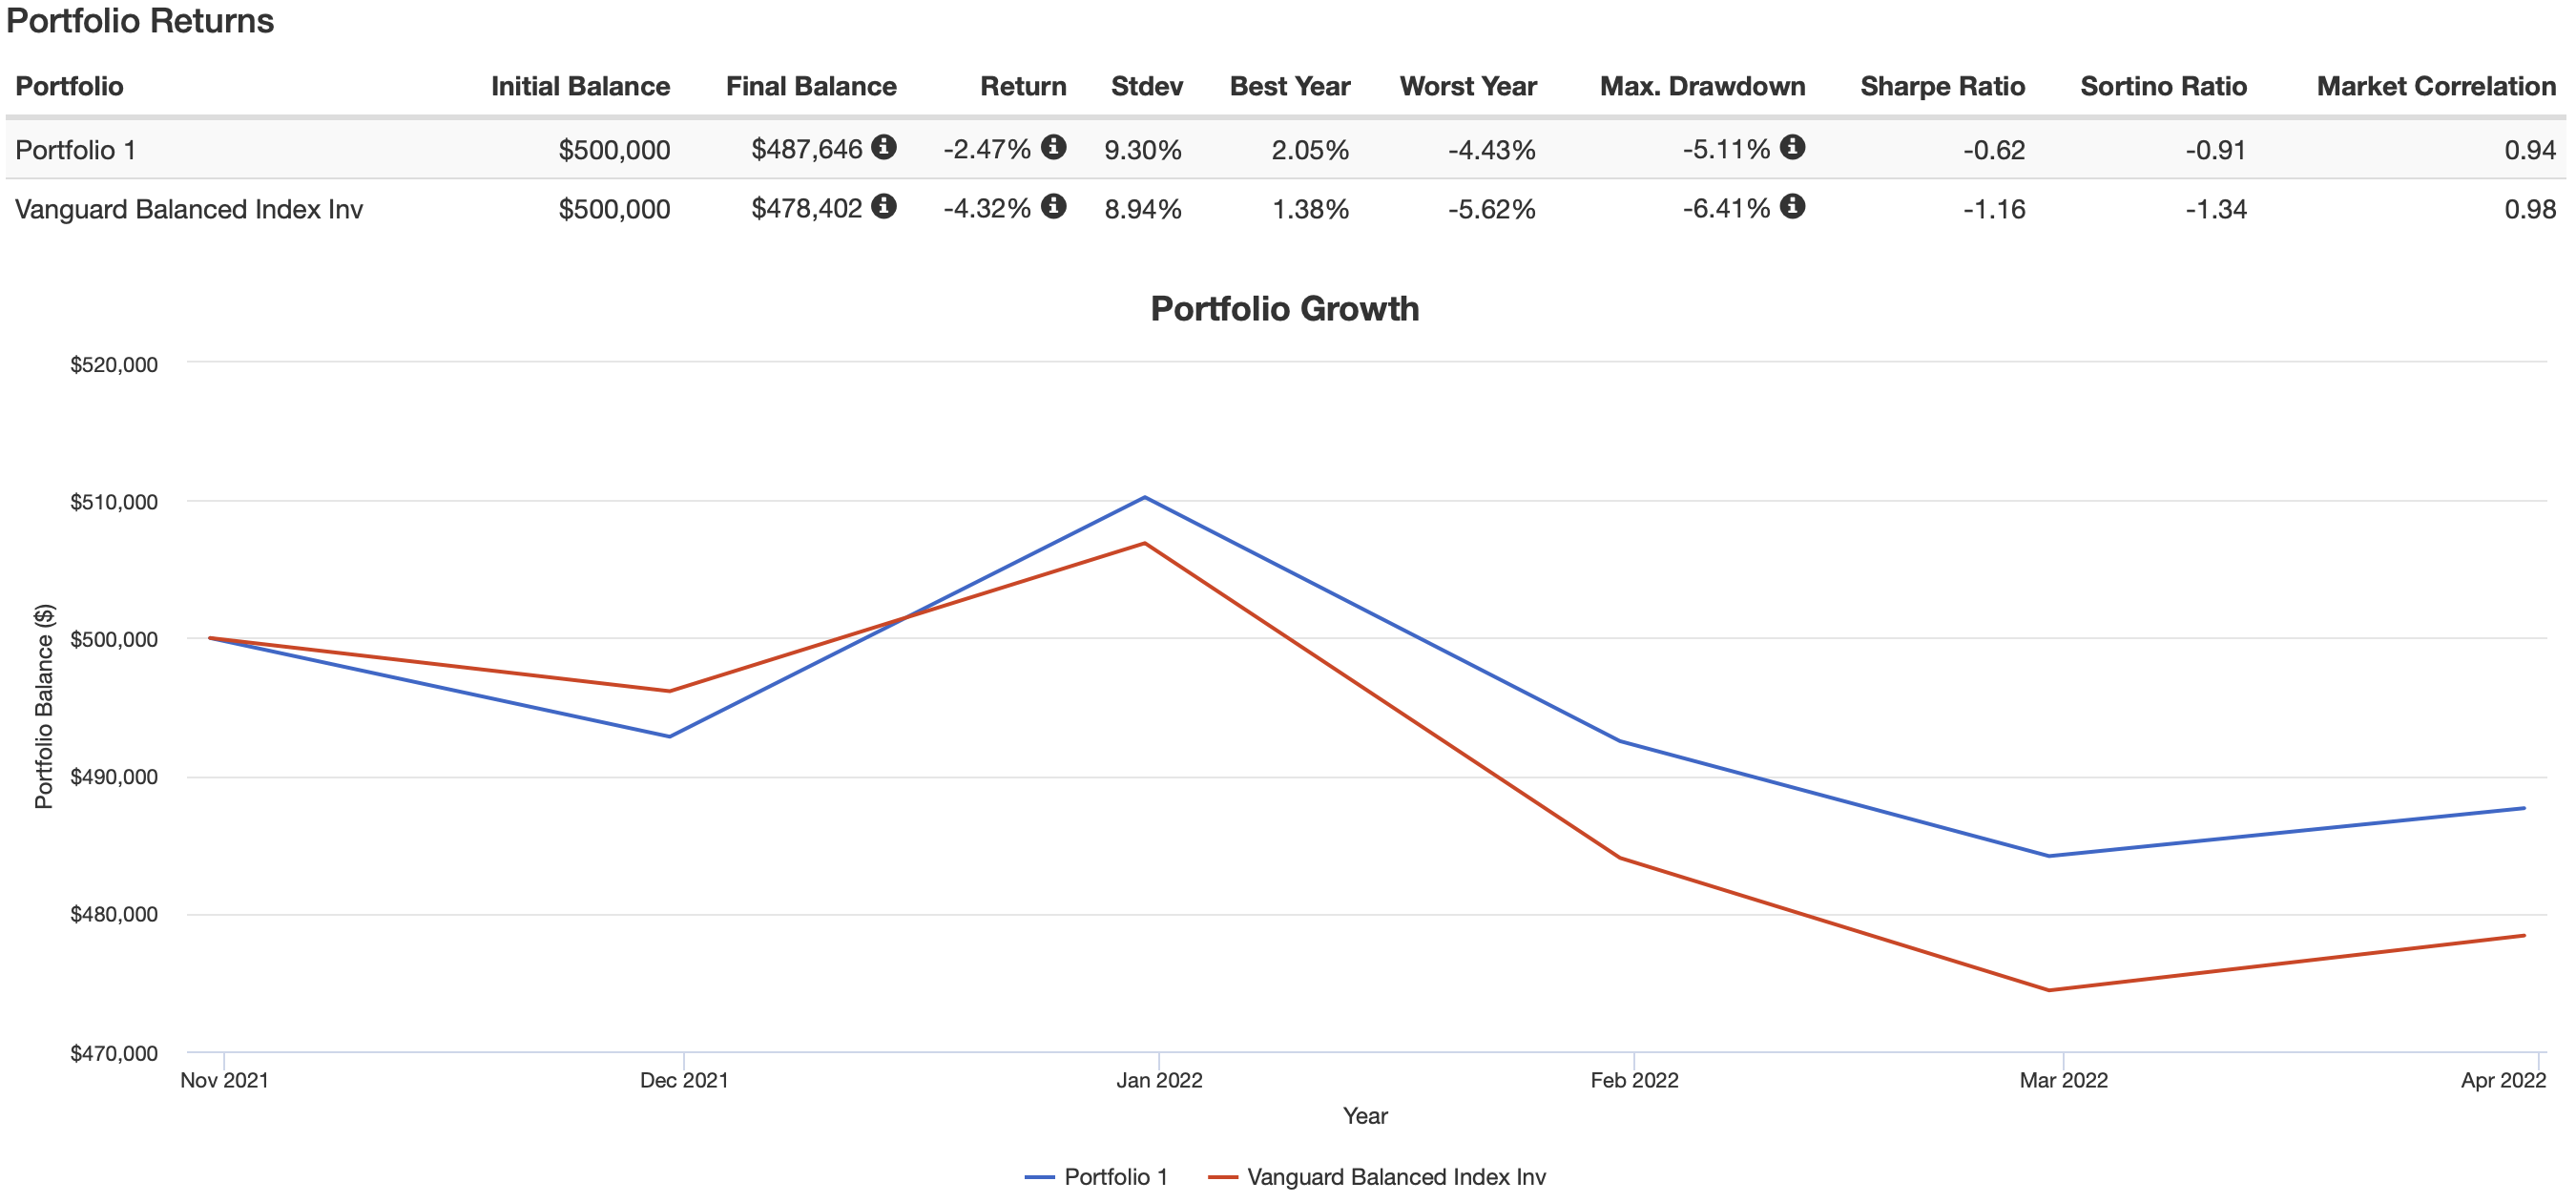
Please note that, for this comparison, the best I could do was evaluate the full months of November, 2021 through March, 2022. Thus, the evaluation period varies slightly from the portfolio inception date of November 9, 2021. In the analysis, I set the flag to include, and reinvest, all dividends.
Even taking note of the slight differences, when you compare the results to the dashboard of actual results shown above, you can see they are fairly represented.
All in all, then, I find myself happy with how the portfolio performed. In every metric across the results line, the ETF Reliable Retirement Portfolio slightly outperformed the Vanguard index. Notably, even though I will be brutally honest about the performance of the bond allocation in my commentary to follow, you will notice that portfolio was slightly less affected than the classic 60/40 mix of stocks and bonds represented by VBIAX.
Let’s break things down, then, by asset class.
U.S. Stocks
In total, the 4 ETFs I selected for my allocation to U.S. stocks, including Utilities, performed extremely well! I show a total loss of a mere $592.90 in the positions themselves. The $1,074.34 of dividends received bring the overall return into positive territory.
Two ETFs in particular; Invesco S&P 500 Low Volatility ETF (SPLV) and Vanguard Utilities ETF (VPU), ended the period with gains of 5.06% and 11.53%, respectively, in addition to the dividends generated!
As can be seen, my decision to include dedicated allocation to utilities paid off handsomely. VPU has risen by a whopping 15% since Vladimir V. Putin made the decision to invade Ukraine.
Foreign Stocks
In the previous section, I referenced Russia’s invasion of Ukraine in the context of the supercharged performance of the utilities sector.
This asset class was the opposite side of that coin. One of my themes, referenced at the outset of this article, was that “superior growth opportunities may come from outside the U.S.” However, as I learned several years ago in a wonderful article from Peter L. Bernstein; “The constant lesson of history is the dominant role played by surprise.”
And that’s what happened here. Shaken by the events in Ukraine, foreign stocks in general took a hit. Emerging markets were affected to an even greater extent. As a result, my two ETFs of choice, Vanguard FTSE Developed Markets ETF (VEA) and Vanguard FTSE Emerging Markets ETF (VWO), experienced declines of 7.41% and 10.29%, respectively, over the period covered by this report.
Bonds/TIPS
In various articles, including this recent example, I argue that bonds deserve at least some place in every portfolio. In this particular period, that advice has come with a cost. Let’s start with the 3 ETFs I selected for my bond allocation.
Over this period,Vanguard Short-Term Bond ETF (BSV), iShares Core U.S. Aggregate Bond ETF (AGG), and iShares 20+ Year Treasury Bond ETF (TLT) declined by 4.44%, 6.88%, and a whopping 11.37%, respectively. Overall, the 3 ETFs combined, in the weightings I selected, absorbed a paper loss of 7.38%, or a little over $7,000. Happily, they also contributed $587.72 in dividends, softening the blow ever so slightly.
In hindsight, I should have weighted the 3 ETFs slightly differently to keep my overall duration levels a little shorter at this particular period of time.
I will discuss TIPS separately, because I also need to report on a change I made with respect to my ETF of choice for this asset class.
All in all, TIPS did a little better than general bonds. The portfolio absorbed losses of roughly $2,200, or 4.5%, in this asset class. However, it received $623.20 in dividends, bringing the overall loss down to roughly 3.24%.
As featured in this article, I recently made an adjustment to the ETF used in the portfolio for this asset class, from iShares TIPS Bond ETF (TIP) to Schwab U.S. TIPS ETF (SCHP). Please see the article if you are interested in the reasons behind that decision.
Finally, I included a small weighting in Vanguard Emerging Markets Government Bond ETF (VWOB) in the portfolio, calling it “perhaps the most adventurous ETF in the portfolio.” As it turned out, VWOB became a little more adventurous than I would have hoped! That led to a follow-up article in which I suggested that VWOB might now be too cheap to ignore and a small rebalancing transaction to heed my own advice.
Real Estate
This asset class ended the period down 5.03% in terms of price. At the same time, it pulled in a healthy $710.72 in dividends, reducing the overall loss to roughly 3.60%.
Of the 3 ETFs in this class, Hoya Capital Housing ETF (HOMZ) experienced the sharpest decline, at 10.32%. Leading detractors during the period were the Real Estate Technology, Brokerage & Services and Home Furnishings & Home Goods sectors.
Additionally, builders are trading lower by 30-40% and now trading at an average of 4x P/E which is rather incredible considering they have delivered average EPS growth of over 25% over the past three years and expect another 20% this year. This may be a basis for optimism as we move forward.
Gold
Simply put, gold proved to be very positive offset over this period, gaining a solid 6.13% as investors perhaps sought a safe haven amidst all the uncertainty.
Earlier, I featured that the portfolio experienced a smaller decline than my benchmark, the Vanguard Balanced Index. The performance of gold is likely a major reason for this.
Summary and Outlook
As we close, just a couple of observations. As a result of the severe decline in U.S. and foreign stock markets following Russia’s invasion of Ukraine, on March 8 I decided to rebalance these asset classes in the portfolio. I also went a little further than that. As opposed to simply bringing them back to their original target weights, I upped the weighting slightly in both asset classes, lowering my weighting in AGG as the offset.
One of the challenges of this particular period was that both stocks and bonds performed poorly. According to a recent Vanguard update, this year’s first-quarter drawdown of –6.7% ranks as the third-worst quarter for bonds in the last 50 years. At the same time, for most investors, the recommendation is still to stay the course, perhaps rebalancing funds into the worst performers, but not making drastic changes other than that.
Ironically, in this portfolio, the indicated move would be to add funds to iShares 20+ Year Treasury Bond ETF (TLT). As featured above, this ETF declined by a whopping 11.37%. At the same time, I find myself cautious when it comes to committing additional funds to the longer end of the yield curve. I don’t have a clear position on this yet, but will ponder the question as time moves forward. Other than that, I remain happy with the overall weightings of the portfolio at this time.
Thanks for reading! Until next time, I wish you . . .
Happy Investing!!
Be the first to comment