

Ivan-balvan
ESTA – Establishment Labs Holdings
We recently revisited our rating on Establishment Labs Holdings Inc. (NASDAQ:ESTA) to potentially extract any additional findings contrary to the hold thesis. Within our broad healthcare coverage universe, we’ve been fortunate to capture upside across a selective basket of opportunities in FY22 by following our rigorous allocation process.
Following its latest set of numbers, we’re back again today to reiterate our balanced viewpoint in ESTA. Whilst it was a reasonable period of top-line growth for the company in Q3, looking ahead, it sees a tighter rate of expansion for FY22 and beyond. Hence, we’ve no reason to change our thesis, despite market data implying a potential move towards the $92 zone. Net-net, we continue to rate ESTA a hold.
We would also note from our latest findings, the key upside risk to our thesis is that technical studies indicate a possible run to $92. We discuss this below, although this should be recognized by investors.
ESTA 12-month price action vs. S&P 500
Note the down-shifting correlation structure. This could be evidence of idiosyncratic risk premia in the name.
Data: Updata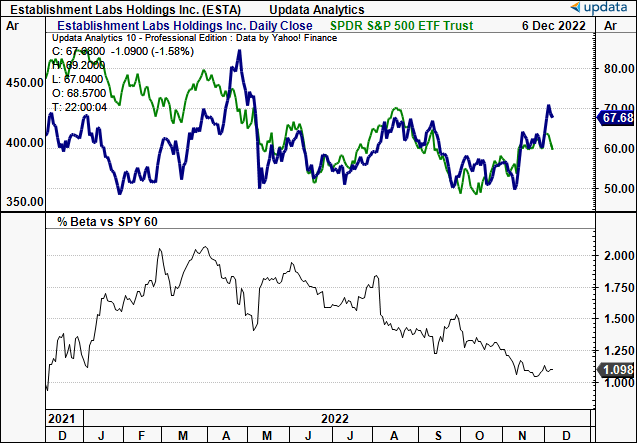
Q3 financial results corroborate neutral view
Turning to ESTA’s quarterly numbers, we’d note it was a period marred by foreign exchange (“FX”) headwinds. Note, it reported Q3 FY22 earnings in early November.
Nevertheless, we saw ESTA’s total YoY revenue growth of 31.7%, reaching $38.2mm on an operating loss of $10.5mm. The impact of foreign currency changes reduced this figure by $1.7mm, a ~600bps headwind. In constant currency terms adjusted revenue growth was 37.7%. As we noted, the distribution of revenue was influenced by both currency fluctuations and seasonality, particularly in Europe where summers are typically a slower period for the company.
Direct sales made up 38% of total revenue, while distributor sales contributed the remaining 62% to the top line. Moving to the regional highlights, Europe accounted for 23% of global sales, while APAC and Middle East regions made up 44%. Latin America, including the largest market of Brazil, accounted for the remaining balance.
Moving down the P&L, gross profit pulled in to $26mm at 68.1% of revenue. This is compared to the same period in 2021, when gross profit was at $19.6mm or 67.6% of revenue. The negative effects of foreign currency exchange rates were particularly damaging, leading to a decline in overall average selling prices from the previous quarter.
It’s also worth noting that ESTA lost leverage at the SG&A line, with maintenance SG&A up 26.2% YoY to $31.3mm, a $6.5mm change. We suggest the increase was likely due to investments in uncertain growth initiatives like the launch of its Mia Femtech segment [which includes the Mia procedure]. Overall, total OpEx for the quarter stretched up to $36.6mm, an increase of approximately $7.9mm or 27.5% from the previous year.
These challenges ultimately led to a net loss from operations of $10.5mm or $0.76/share, compared to a loss of $9mm in the same period the previous year. It exited the quarter with on-balance sheet cash of $65.3mm, an increase from $53.4mm last year. However, this increase was only the result of the first tranche of a new term loan itself totalling $150mm. We’d note that the term loan has 3 additional tranches totalling $75mm, accessible on certain revenue and regulatory milestones. A full look back at ESTA’s quarterly operating performance per quarter from FY16 to Q3 FY22 is seen below in Exhibit 1.
Exhibit 1. ESTA quarterly operating numbers, FY16 to Q3 FY22 [revenue, core EBIDTA].
Data: HBI, Refinitiv Eikon, Koyfin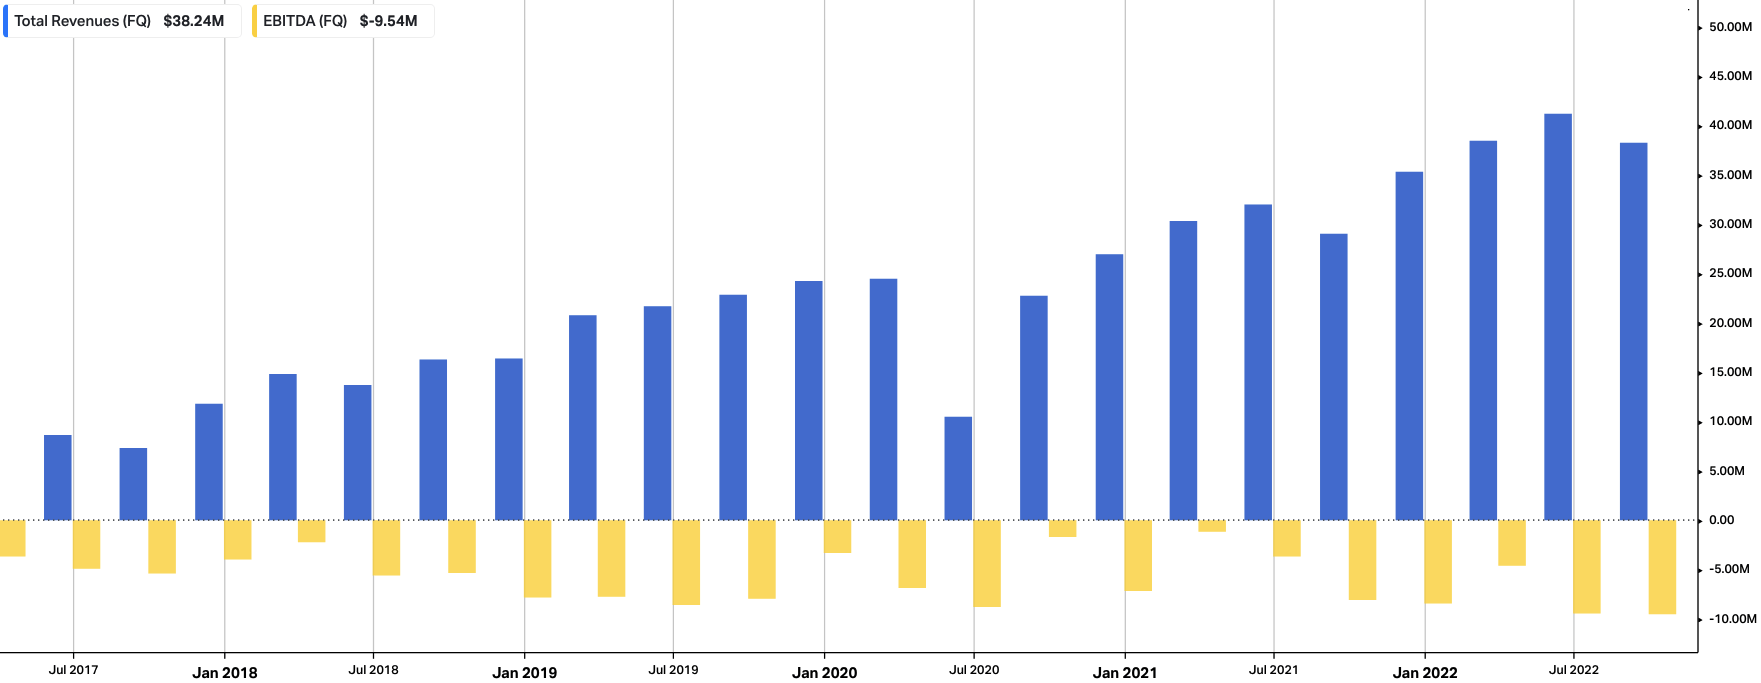
New guidance ranges also unsupportive
We also saw that management tightened its FY22 guidance ranges on the earnings call. It now forecasts revenue growth of 25–28% for the full year, calling for $158mm–$162mm at the top line.
This is a change from the previous range of $155mm–$165mm. The business is experiencing strong momentum, but the negative impact of currency on sales is expected to be a headwind of ~400bps to $6.5mm.
It also forecasts OpEx to increase as the company prioritizes investment in development and commercialization programs. In particular, we note the launch of Mia and corresponding entry into the U.S. remain centre stage for the company in FY23, and we estimate OpEx will reflect these investments.
ESTA technicals balance the downside
Despite a narrower growth forecast, we’d also highlight that technical data is pointing to upside on the charts. You can see below that ESTA has retraced more than 50% of the down-leg it experiences from May 2022.
After bouncing from its double bottom the stock is now testing the $70 mark, having pulled back from this mark this week.
However, with the latest rally, the volume trend is descending, potentially indicating a lack of large buyer accumulation in our opinion.
Should it reverse back to the upside, the next technically derived targets are to $79 then to $93.
Exhibit 2. ESTA weekly price evolution showing retracement of >50% of down-leg since May 2022. Next targets are $79 then $93 if it breaks out above 61.8% mark.
Data: Updata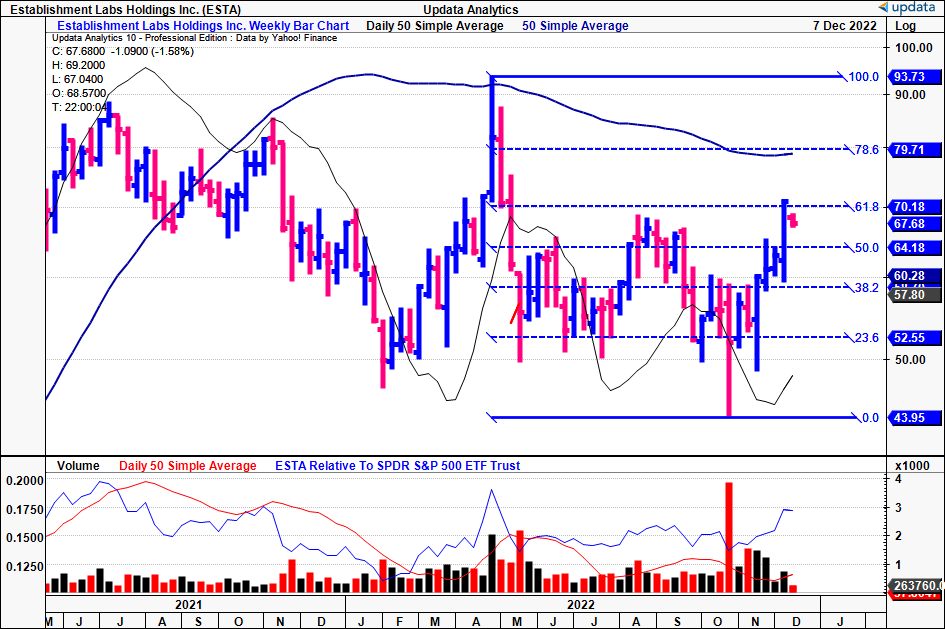
There’s good support to the $92–$93 region, as seen on the point and figure analysis below. In fact, the stock has broken out above an outer resistance line shown, and has upside support to its current levels. We’d suggest this is something to take note of and could demonstrate an upside risk to our investment thesis.
Exhibit 3. Upside targets to $92, having previously taken out $52.50 target.
Data: Updata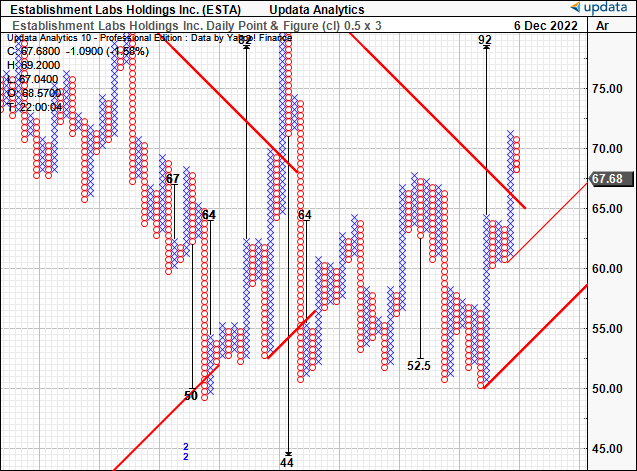
Furthermore, there is bullish weight to the current trend with shares and the lag line trading well above cloud support, as seen below. Momentum is ticking higher as well, whilst the cloud itself has turned blue and is widening at the mouth.
Balancing this picture, is the level of on-balance volume that has reversed sharply and is now positioned at 6-month lows. Again, the fact that price action is bullish without the volume support is supportive of our neutral view.
Exhibit 4. Trading above cloud support but without the backing on on-balance volume
Data: Updata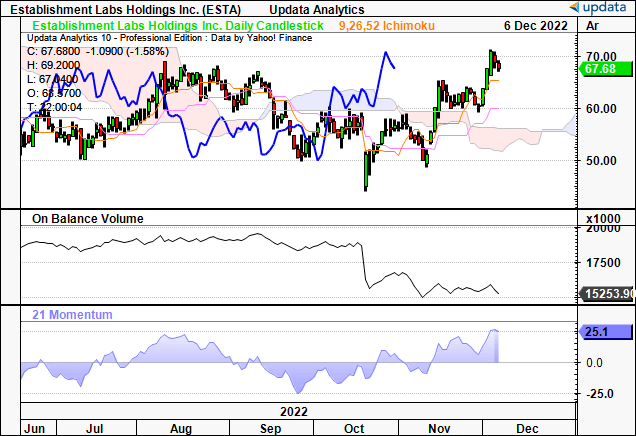
Valuation and conclusion
We’d advise that consensus has priced the stock at ~11x forward EV/sales. This is a substantial premium to the sector median’s 4x.
The question is, is the substantial premium warranted or not? Recall, the company narrowed revenue guidance and foresees troublesome impacts from FX headwinds this year. Moreover, in the absence of earnings and profitable EBITDA, we’d say this is unjustified. However, we’d also note there are many names within the peer group that skew the presentation of the data.
Moreover, as we noted in our last publication, the underlying market is poised for strong growth of CAGR ~11.6% into 2030.
Hence, applying the 11x forward sales multiple to ESTA’s FTY22 sales forecasts of $162mm [upper range] prices the stock at $73.33.
With little upside forecasted in its share price from here, this supports our neutral view.
Be the first to comment